
Remember me
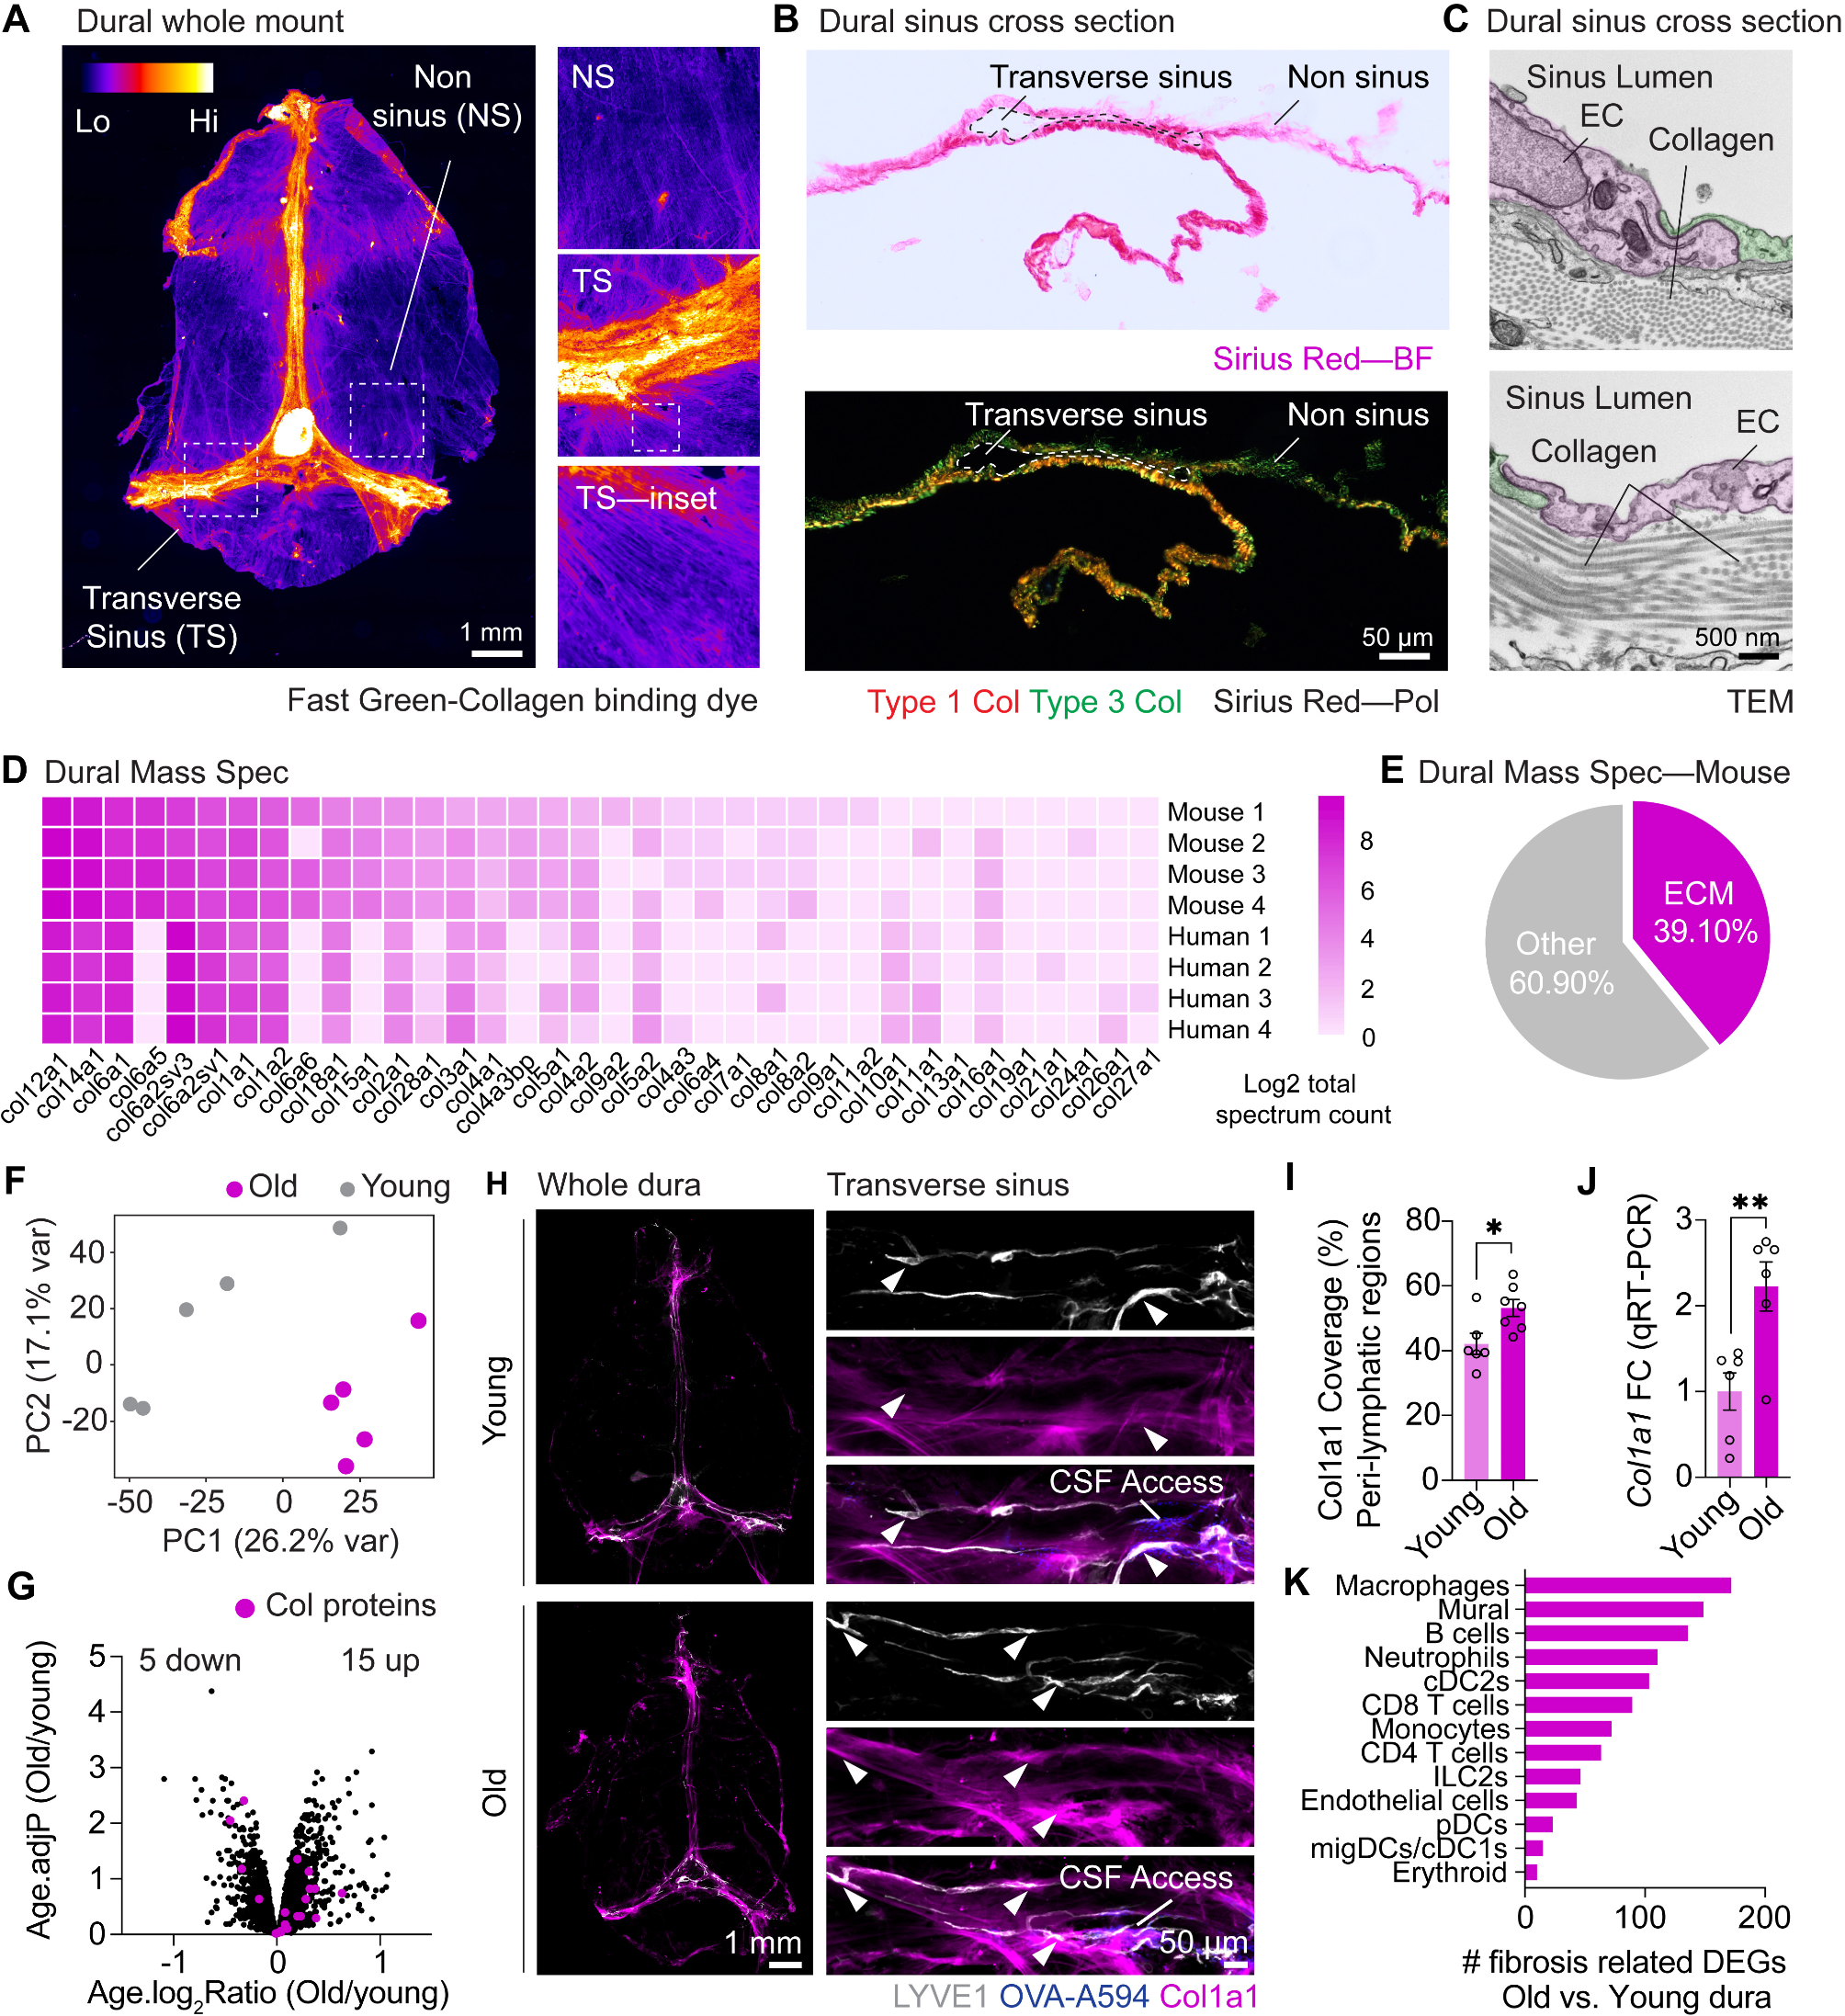


To molecularly profile the stroke-injured brain, we induced large cortical strokes in the sensorimotor cortex of C57BL/6J mice (Fig. 1A). All mice showed a severe ≈ 70% reduction in cerebral blood flow in the stroke core, and ≈ 45% reduction in the ischemic border zone (ibz) compared to the intact hemisphere at 2 h after stroke induction (Fig. 1B, C).
Four weeks after stroke, we performed a microbiopsy of (a) intact, (b) ibz, and (c) stroke core tissue. All samples were processed for single nucleus RNA sequencing (snRNAseq) using the 10X Genomics Chromium platform, generating transcriptomes from approximately 35,000 nuclei (Fig. 1D, Suppl. Figure 1).
We performed clustering and annotation of nine major cell populations of the mouse brain guided by the known marker expression patterns from molecular atlases [11, 17, 25]: Glutamatergic neurons (Glut: e.g., Slc17a7, Satb2), GABAergic neurons (GABA: e.g. Gad1, Gad2), astrocytes (Asc: Slc1a2, Slc1a3), fibroblasts (FB: Col1a, Fn1), oligodendrocytes (Olig: Mbp, Plp1), immune cells (Imm: Inpp5d, Csf1r), vascular cells (Vasc: Flt1, Cldn5), stem and progenitor cells (SPC: Sox10, Vcan), and mural cells (Per: Pdgfrb, Cspg4) (Fig. 1E). These cell types and marker expression of cell types matched previous single-cell/snRNAseq data from adult non-injured mouse cortices [12, 26, 27].
We used these cell-type categories from the intact adult mouse brain to characterize changes specific to ibz and stroke-injured brain tissue (Fig. 1F-H). All cell types were determined with a high confidence in all datasets (Suppl. Figure 2). We observe an increase in the proportion of non-neural cells in the ibz (+ 12%) and in the stroke-injured tissue (+ 66%, Fig. 1I). Notably, the ratio of both glutamatergic and GABAergic cells to the total cell population was reduced in the stroke-injured tissue (Glut: intact: 82%, ibz: 58%, stroke: 10%: GABA: intact: 12%, ibz: 14%, stroke: 8%), whereas the relative number of certain non-neural cell types increased especially e.g., fibroblasts (intact: 1%, ibz: 1%, stroke: 22%), astrocytes (intact: 4%, ibz: 12%, stroke: 14%), oligodendrocytes (intact: 2%, ibz: 7%, stroke: 9%), vascular cells (intact:1%, ibz: 3%, stroke: 6%) and immune cells (intact:1%, ibz: 2%, stroke: 7%, Fig. 1J).
Fig. 1
Cellular profiling of the stroke-injured mouse brain. (A) Scheme of experimental workflow (B) Laser Doppler imaging (LDI) illustrating relative perfusion in the mouse brain (C) Bar plot showing quantification of relative blood perfusion in the stroke core and the ischemic border zone (ibz) compared to the left hemisphere acutely after stroke (D) Illustration of brain regions for biopsy to perform snRNAseq (E) Dot plot representation of canonical cell type markers across different cell populations from the intact contralesional hemisphere, labeled by cell type: glutamatergic neurons (Glut), GABAergic neurons (GABA), astrocytes (Asc), fibroblasts (FB), oligodendrocytes (Olig), immune cells (Imm), vascular cells (Vasc), stem/progenitor cells (SPC), and mural cells (Per) (F-H) UMAP visualization of cell clusters from intact, ibz and stroke tissue. (I) Bar plot showing distribution of cell type by neural and non-neural cells and individual cell types (J) across the reference, intact, ibz and stroke samples. The data was generated with a cohort of n = 9 mice
A distinct cell cluster termed injury-associated (IC) cells revealed by SnRNAseq and immunohistochemistryNext, we aimed to confirm the abundance of major cell populations in immunohistochemical stainings of intact and stroke brain tissue. We selected markers specific to mature neurons (NeuN+) and synapses (GAT+, vGlut1+, Synaptophysin+), astrocytes (GFAP+), macrophages (CD68+), microglia (Iba-1+), endothelial cells (CD31+) and pericytes (CD13+) and stained stroked and intact coronal brain Sect. 28 days after injury (Fig. 2A, Suppl. Figure 3). We found that relative NeuN+ expression was significantly reduced in stroke-injured and ibz tissue, whereas GFAP+-expression increased in the ibz compared to the intact side (Fig. 2B). CD68+, highly expressed in macrophages [28], and IBA1+, expressed in microglia/monocytes [23], was found to be elevated in the stroke core and the ibz after injury, compared to marker expression in intact tissue (Fig. 2B). Interestingly, we also found increase in CD13+ signals in the stroke core that were not associated with CD31+ vasculature, potentially indicating recently described CD13+ infiltrating monocytes which have been described to aggravate acute stroke injure but promote chronic post-stroke recovery (Fig. 2B) [29]. Although the relative number of vascular cells, compared to other cell types, increased in the stroke snRNAseq dataset, the overall coverage of CD31+ vasculature in stroke tissue is lower in the injured hemisphere compared to the intact hemisphere, consistent with previous stroke studies [30,31,32,33] (Suppl. Figure 3). Furthermore, we found expression of platelet-derived growth factor receptor beta (PDGFR- β) to be upregulated in the stroke core and the ibz compared to intact tissue, as described before (Fig. 2C, D) [34]. After CNS injury, microglia create a pro-inflammatory environment by releasing TNF; and this has been shown to enhance the expression of integrins [35, 36]. We found that integrin subunit alpha V (ITGAV) was strongly expressed within the ibz, but barely in the intact cortex (Fig. 2E, F).
Analysis of neural subtypes using snRNAseq revealed a decrease in most glutamatergic and GABAergic subclusters in stroke-injured tissue (Fig. 2G). For instance, the ratio of GABAergic parvalbumin (PV)-expressing, vasoactive intestinal polypeptide (Vip)-expressing, and somatostatin (Sst)-expressing neurons, as well as glutamatergic layer 2/3 and layer 6 intratelencephalic (IT) neurons was reduced by > 80% relative to the intact tissue. These findings align with previous functional studies showing that the loss of specific interneurons, such as PV and SST-expressing neurons, can worsen stroke outcomes and rescuing these populations may serve as a therapeutic target [37,38,39,40].
Additionally, within the stroke core tissue, we identified a distinct cluster of cells, absent in the intact tissue, which we have termed ‘injury-associated cells’ (IC) (Fig. 1I, J). IC cells are positive for astrocytic markers such as Apoe and Slc1a2 but also express genes related to ECM modeling such as Col1a2 and Col3a1. ICs transcriptionally segregated from other clusters by expression of genes involved in formation of scar tissue e.g., Dcn, Lum, Col3a1, and Col1a1, but also promotion of remodeling and tissue repair e.g., Mmp14, Vim, Igfbp5, and Sparc. Correlation analysis between all cell types revealed that the IC cell cluster shows most gene expression similarities (r = 0.85) to astrocytes and fibroblasts (Fig. 2I, Suppl. Figure 4). Next, we selected one of the top IC markers and stained intact and stroked coronal brain sections (Fig. 2J, K). We found that insulin like growth factor binding protein 5 (Igfbp5) was strongly expressed within the infarction core, but barely in the intact hemisphere (Fig. 2J, K). To further characterize the IC cell cluster, we co-stained IGFBP5-positive cells with GFAP (reactive astrocyte marker) and PDGFR-β (fibrotic fibroblast-like cell marker) [41] (Fig. 2L). We observed co-localization of PDGFR-β and IGFBP5 in both the infarction core (31% of all IGFBP5+ cells) and the ibz (5% of all IGFBP5+ cells), suggesting that these injury cells possess a fibrotic fibroblast-like identity (Fig. 2M). Additionally, 13.5% of IGFBP5+ cells in the border zone co-expressed GFAP, indicating that a subset of injury-associated cells may possess a more reactive astrocyte-like identity. Notably, ICs did also not show typical expression of canonical markers associated with fibrotic pericytes [4].
Hence, these findings suggest that the IC cluster consists of cells with fibroblast-like and glial features that become reactive in response to CNS injury, consistent with previously observed cellular shifts in response to CNS injury [42,43,44,45].
Fig. 2
A distinct cell cluster termed injury-associated (IC) cells revealed by snRNAseq and immunohistochemistry. (A) Representative histological overview of brain sections stained with (from left to right) Gat/vGlut, IBA1/GFAP, CD68/IBA1, CD31/CD13, co-stained with DAPI. (B) Quantification of NeuN+, GFAP+, IBA1+, CD68+, CD31 + and CD13 + expression relative to intact tissue (dotted line). (C) Representative histological overview of brain sections stained with PDGFRb and co-stained with DAPI. (D) Quantification of PDGFRb + expression relative to intact tissue (dotted line). (E) Representative histological overview of brain sections stained with ITGAV and co-stained with DAPI. (F) Quantification of ITGAV + expression relative to intact tissue (dotted line). (G) Bar graph showing relative amount of major GABA and glutamatergic neuronal subtypes. (H) Dot plot showing expression of canonical cell type marker of injury-associated cells (IC), FB, and Asc. (I) Heatmap showing correlation of gene expression profiles between each cell type from stroke tissue. (J) Representative histological overview of brain sections stained with IGFBP5 (left) and quantification of IGFBP5 expression relative to intact tissue (right). (K) Feature plot showing the expression patterns of Apoe, Adam12, Cola1a2, and Vim in cells from stroke tissue. (L) Representative histological overview of brain sections stained with (from left to right) IGFBP5/GFAP and IGFBP/PDGFRB, co-stained with DAPI. (M) Cell counts (GFAP + and PDGFRb + positive cells, relative to all counted IGFBP5-positive cells) in the ibz and the stroke area. The data was generated with a cohort of n = 9 mice
Transcriptomic shift and pathway enrichment in brain cells following strokeNext, we examined how long-term cerebral ischemia affects gene expression and pathway enrichment in individual brain cells (Fig. 3A). We found that most cell types exhibited differentially expressed genes (DEG) after stroke. As expected, most DEG were observed between nuclei from stroke-injured brains compared to intact tissue. Most DEGs were observed in FB, Glut and GABA nuclei (Fig. 3A). Interestingly, most DEGs overlapped between stroke/intact and ibz/intact tissue for neural (Glut and GABA) nuclei (Fig. 3B), whereas non-neural cells exhibited a more distinct, regional-specific DEG signature (Fig. 3C).
Gene set-enrichment analysis (GSEA) revealed that upregulated pathways in GABA and Glut neural cells predominantly involved pro-regenerative responses including synaptic plasticity, neurotransmitter transport, synapse organization, and axon guidance (all p < 0.001), while downregulated pathways in all neural cells included aerobic respiration and oxidative phosphorylation (Fig. 3D, E; all p < 0.001). This shift in cellular metabolism from energy-efficient aerobic respiration to alternative metabolic processes may potentially reflect an adaptive response to the altered microenvironment post-stroke [46].
Immune cells mainly showed an upregulation in inflammation-associated pathways such as leukocyte activation and positive regulation of immune response (all p < 0.001). Notably, immune cells were the only cell types that did not exhibit altered aerobic metabolism (Fig. 3F). Astrocytes and fibroblasts revealed enrichment in pathways linked to remodeling such as extracellular matrix (ECM) organization and cell adhesion and migration processes (all p < 0.001) (Fig. 3G, H). Additionally, ECs showed enrichment in angiogenesis and remodeling pathways, alongside a downregulated in aerobic metabolism (Fig. 3I; all p < 0.001). Oligodendrocytes show significant enrichment in pathways related to axon ensheathment, extracellular matrix organization, and Wnt signaling regulation, suggesting an adaptive role in myelin remodeling and structural support post-stroke (all p < 0.001) (Fig. 3J). Pericytes revealed a significant enrichment in pathways related to cell adhesion and axon guidance and reduction in ATP biosynthesis and oxidative phosphorylation, indicating a metabolic adaptation to reduced (all p < 0.001) (Fig. 3K).
Together, these data suggest major transcriptional changes of all major brain cells at 28 days after stroke involving pro-regenerative and remodeling pathways, while also indicating a persistently inflammatory and hypoxic environment.
Fig. 3
Transcriptomic responses of individual cell types to stroke in distinct mouse brain regions. (A) Heatmap showing number of significantly up- and downregulated genes per cell types in stroke vs. intact (left), ibz vs. intact (middle) and ibz vs. stroke (right) tissue. (B) Venn diagram showing the overlap and unique differentially expressed genes from neural cells between stroke and ibz tissue (C) Bar plot showing the common and differential expressed genes in non-neural cells (right). (D-I) Gene set enrichment analysis (GSEA) of biological pathways that are enriched in stroke vs. intact and ibz vs. intact tissue for (D) GABA, (E) Glut, and GSEA from stroke vs. intact tissue in (F) Imm, (G) Asc, (H) FB, and (I) Vasc (J) Olig, and (K) Per. Each panel displays the normalized enrichment score (NES) for pathways that are overrepresented (positive NES) or underrepresented (negative NES) in the post-stroke environment compared to intact tissue
Mapping of intercellular molecular communication after strokeTo quantitatively infer and identify relevant communication networks after stroke, we used CellChat [47, 48] to analyze signaling patterns involved in ligand-receptor interactions between individual cell types (Fig. 4A). Our analysis suggests that the total number and strength of predicted interactions are increased in stroke tissue (Fig. 4B, C; number of interactions: stroke / intact: +104%, stroke / ibz: +71%: interaction strength: stroke / intact: +95%; ibz / intact + 104%).
In stroke-injured tissue, we observed an upregulation of interactions among individual cell types (Fig. 4C), with the majority of communication occurring between information sending Glut, GABA, Asc, IC and FB and information receiving Glut, GABA and Asc (Fig. 4D). By contrast, cells derived from the ibz and intact tissue exhibited a lower number of predicted interactions especially among non-neural cell populations such as Imm, Vasc, Per, IC and Olig compared to corresponding cell types from stroke-injured tissue (Fig. 4D, E). In stroke-affected tissue, Glut and Asc, particularly as senders, display significantly increased interactions, with IC also showing heightened communication compared to intact tissue. Conversely, in the ibz, these interactions are less pronounced, with non-neural cells like Imm and Vasc cells engaging in fewer communications overall. The data suggests a substantial upregulation of neural cell interactions post-stroke, with a notable contribution from IC cells in stroke conditions (Fig. 4E).
To better understand the involved signaling pathways in stroke compared to intact tissue, we grouped and clustered signaling pathways in four groups separated by functional similarity (Fig. 4F). Most divergent pathways were linked with important biological functions such as neuronal guidance and plasticity (SEMA3, SEMA7, UNC5, SLIT, EPHA), vascular repair and ECM remodeling (COLLAGEN, LAMININ, CDH, CADM, ANGPT, FGF, MMP9).
Most of these pathways demonstrated a considerably higher information flow in stroke-injured tissue (Fig. 4G, H, Suppl. Figure 5, 6). For instance, stroke tissue showed enhanced communication via the COLLAGEN, PTPR, PTN, NEGR, LAMININ, CNTN and CADM pathways, involving multiple cell types that either did not participate or exhibited only minimal signaling interactions in intact tissue (Fig. 4I, Suppl. Figure 7). Interactions of individual cell types in these pathways reveal that ICs preferentially signal to non-neural cells through networks related to COLLAGEN and LAMININ networks involving e.g., Col1a2, Col1a1, Lama2. These signals are predicted to be received by astrocytes (e.g., Itgav-Itgb8), fibroblasts (itga1-itgb1, Ptgdr) and vascular cells (Itga1-itgb1, Itga6-itgb1). This signaling pattern appears to be distinct from the signaling of other non-neural cells such as fibroblasts (e.g. App), astrocytes (e.g., Sema6a, Sema4d, Angpt1) and pericytes (e.g., Lama2) (Fig. 4J).
Overall, these findings show the surprisingly complex and dynamic communication among individual cell types in stroke-injured brains.
Fig. 4
Mapping of intercellular molecular signaling post-stroke. (A) Schematic of cell-cell interaction analysis (B) Bar plot showing number and strength of interactions in cells from intact, ibz and stroke tissue. (C) Network diagram contrasting total number of cell-cell interactions between individual cell types in stroke vs. intact (left) and ibz vs. intact (right). Red lines indicate increased interaction, blue lines indicate reduced interaction, relative to intact tissue. (D) Hierarchy plot of interaction between all individual cell types to target cells in stroke (left), ibz (middle) and intact (right) datasets. (E) Heatmap showing differential interactions between cell types from stroke vs. intact (upper) and ibz vs. intact tissue (lower). Red squares indicating increased signaling and blue squared indicating decreased signaling, relative to cells from intact tissue. (F) Scatter plot projecting signaling groups onto a 2D space according to their functional similarity between cells from stroke and intact tissue. (G) Bar plot showing signaling pathway distance between stroke and intact tissue (H) Stacked bar plot illustrating the proportional relative information flow in signaling pathways between intact and stroke tissue. (I) Cell-cell communication networks for selected pathways: COLLAGEN, Protein Tyrosine Phosphatase Receptor (PTPR), and Pleiotrophin (PTN) across cell types in intact (left) and stroke (right) tissue. (J) Chord diagrams showing the most upregulated signaling ligand-receptor pairings in injury-associated cells (IC), fibroblasts (FB), astrocytes (Asc), and pericytes (Per)
Comparative analysis of transcriptome responses in mouse and human strokeTo decode and highlight transcriptomic changes that may be relevant to human stroke, we compared our mouse pseudo-bulk and ortholog-transformed RNAseq data with publicly available human stroke-lesion RNAseq datasets from cortical lesions and contralesional brain tissue of patients who experienced a nonfatal ischemic stroke up to five years before death (GSE56267) [49] (Fig. 5A).
We performed a Pearson correlation analysis of the genes shared by mouse and human datasets post-stroke, which revealed similarities in gene expression changes (r = 0.43, p < 0.001) (Fig. 5B). Interestingly, we found that IGFBP5, previously identified as upregulated in IC cells of stroke mice, was also upregulated in the human stroke dataset (Fig. 5B). We then calculated z-scores of log2-fold changes and revealed shared and differentially expressed genes between the mouse and human datasets (Fig. 5C). The overlapping upregulated gene expression featured genes associated with inflammation (e.g., CXCL5, CD44, CD36), neural plasticity (e.g., GAP43, RUNX1), ECM remodeling (e.g., ADAM12, MMP2, COL4A6) and vascular remodeling (e.g., ANGPTL4, CLDN5).
We observed that 48% of the top 2000 genes, 22% of the top 500 genes, and 4% of the top 100 genes were commonly upregulated in both mouse and human post-stroke. Moreover, of the 861 human genes exhibiting more than a 2-fold upregulation following stroke, 717 (83%) were also upregulated in the mouse stroke dataset (Fig. 5D).
We then conducted an over-representation analysis (ORA) of biological processes among the top 2000 upregulated genes that were (a) common: upregulated in mouse and human, (b) mouse-specific, and (c) human-specific. The common ORA predominately featured inflammation-related pathways including regulation of cytokines and immune cells activation, along with angiogenesis, ECM regulation and wound healing responses (Fig. 5E; all p < 0.001).
Mouse-specific ORAs similarly highlighted pathways of inflammation, wound healing, and gliogenesis (Fig. 5F; all p < 0.001). In contrast, human-specific ORAs were primarily associated with pathways involved in cell division and structural organization (Fig. 5G; all p < 0.001), potentially highlighting species-specific differences in the cellular repair mechanisms post-stroke.
In summary, our analysis underscores the substantial cross-species similarities in stroke-induced transcriptomic changes, especially in key pathways related to inflammation and tissue remodeling, highlighting conserved biological mechanisms that could inform the development of therapeutic strategies for human stroke recovery.
Fig. 5
Comparative gene expression profiles in mouse and human post-stroke. (A) Schematic of human and mouse stroke (B) Scatter plot displaying the Person correlation for gene expression changes between mouse and human post-stroke. (C) Heatmap of common upregulated genes in human and mouse stroke (upper) and differentially expressed genes in human and mouse stroke (lower) (D) Stacked barplot of common and unique upregulated genes in the top 2000, 500 and 100 gene sets from both mouse and human datasets (upper) and Venn diagram of shared and unique genes with a fold change > 2. (E-G) Overrepresentation analysis of top 2000 genes present in (E) both mouse and human datasets, (F) genes exclusively identified in mouse stroke dataset (G) and genes only present in human stroke dataset. All p-values ***,< 0.001
Comments (0)