
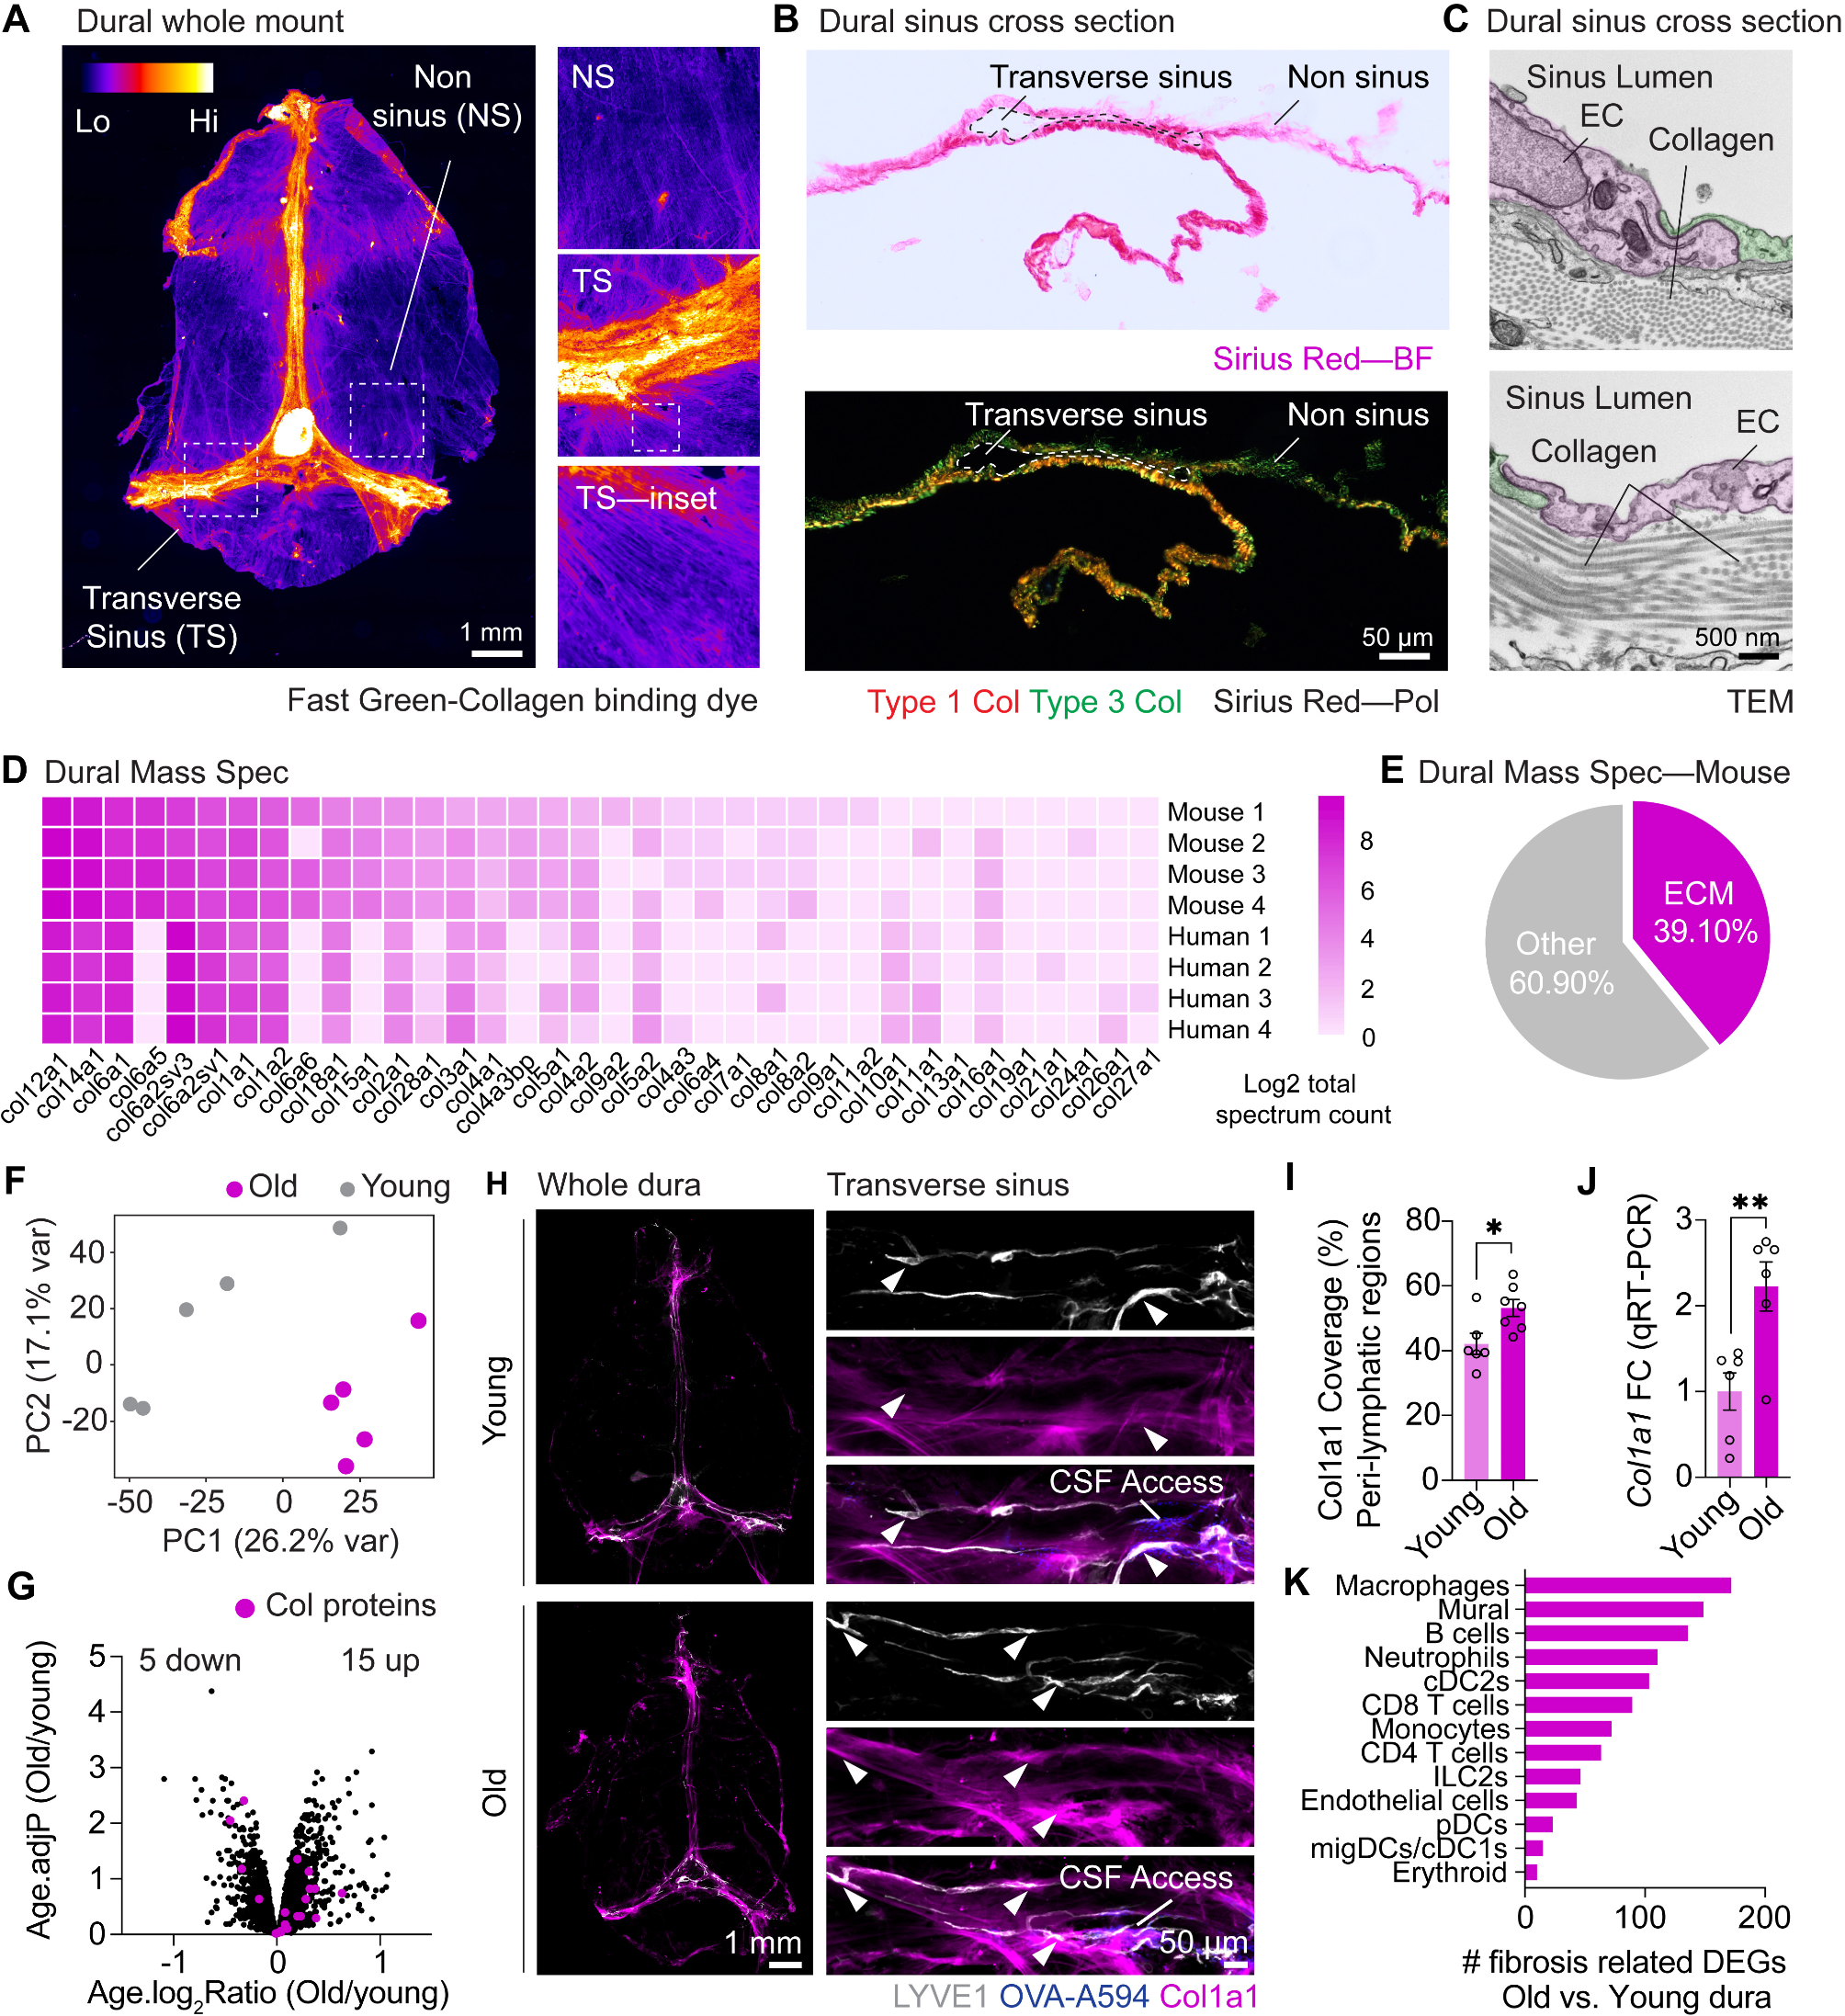
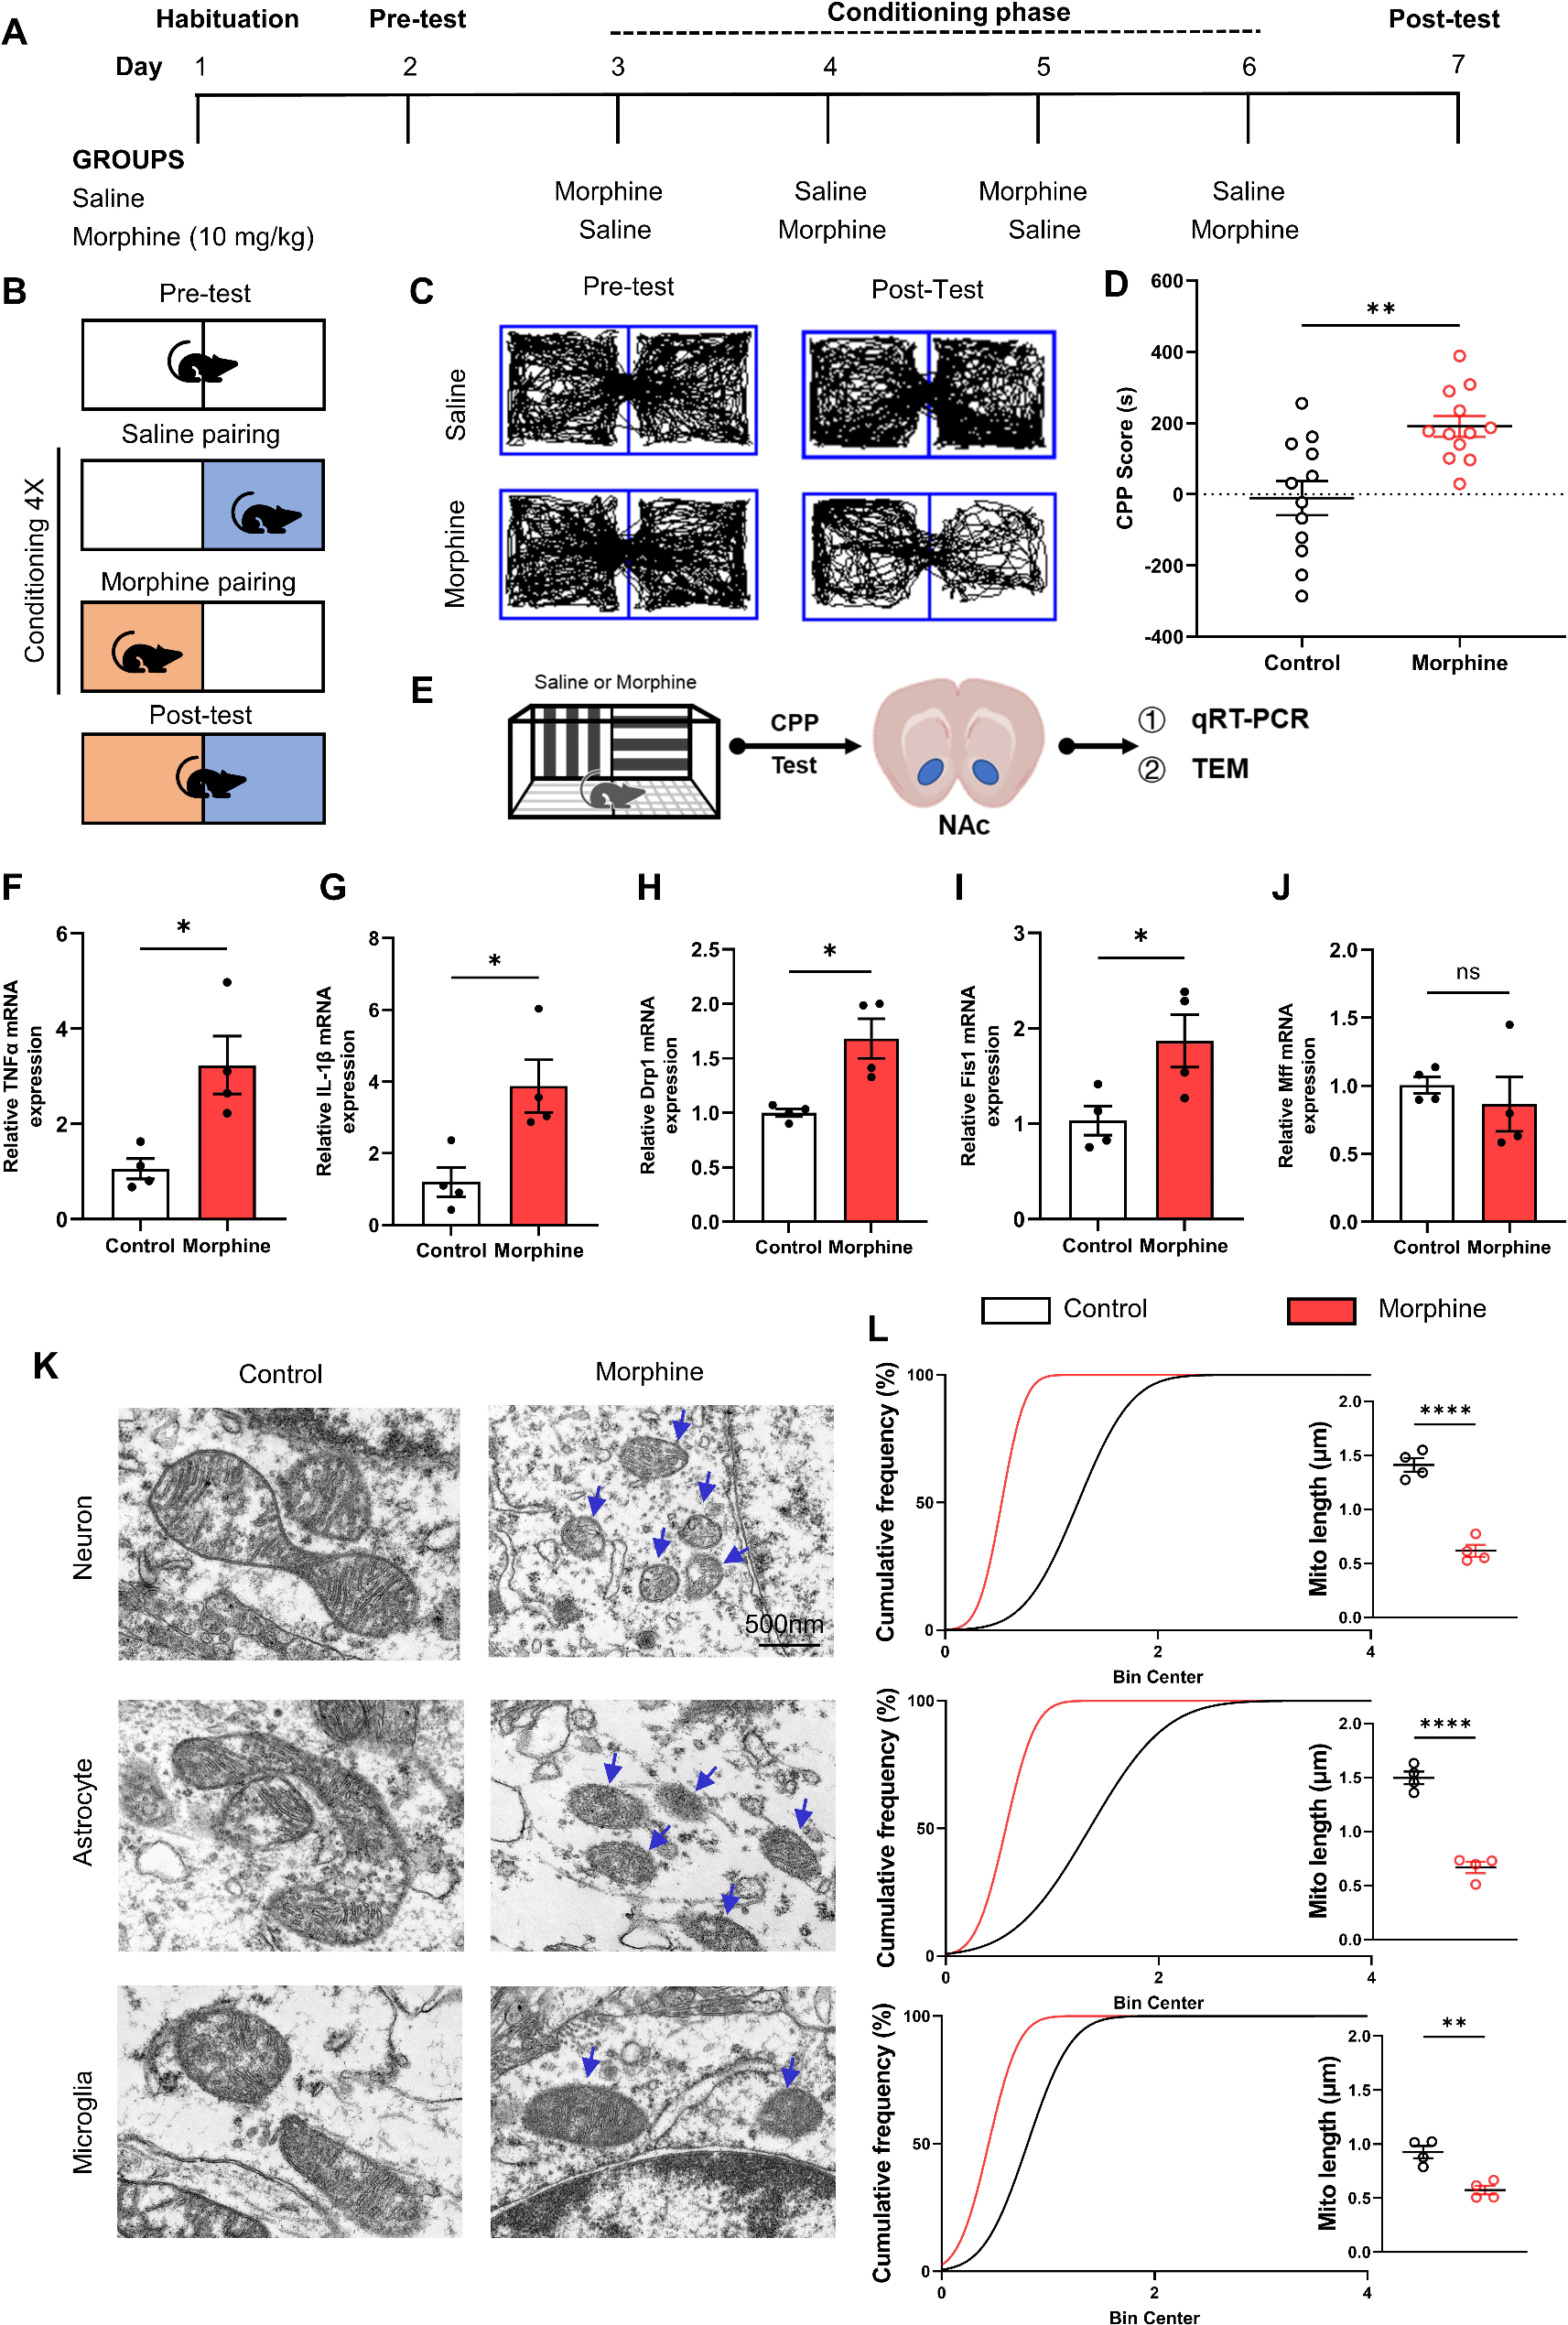
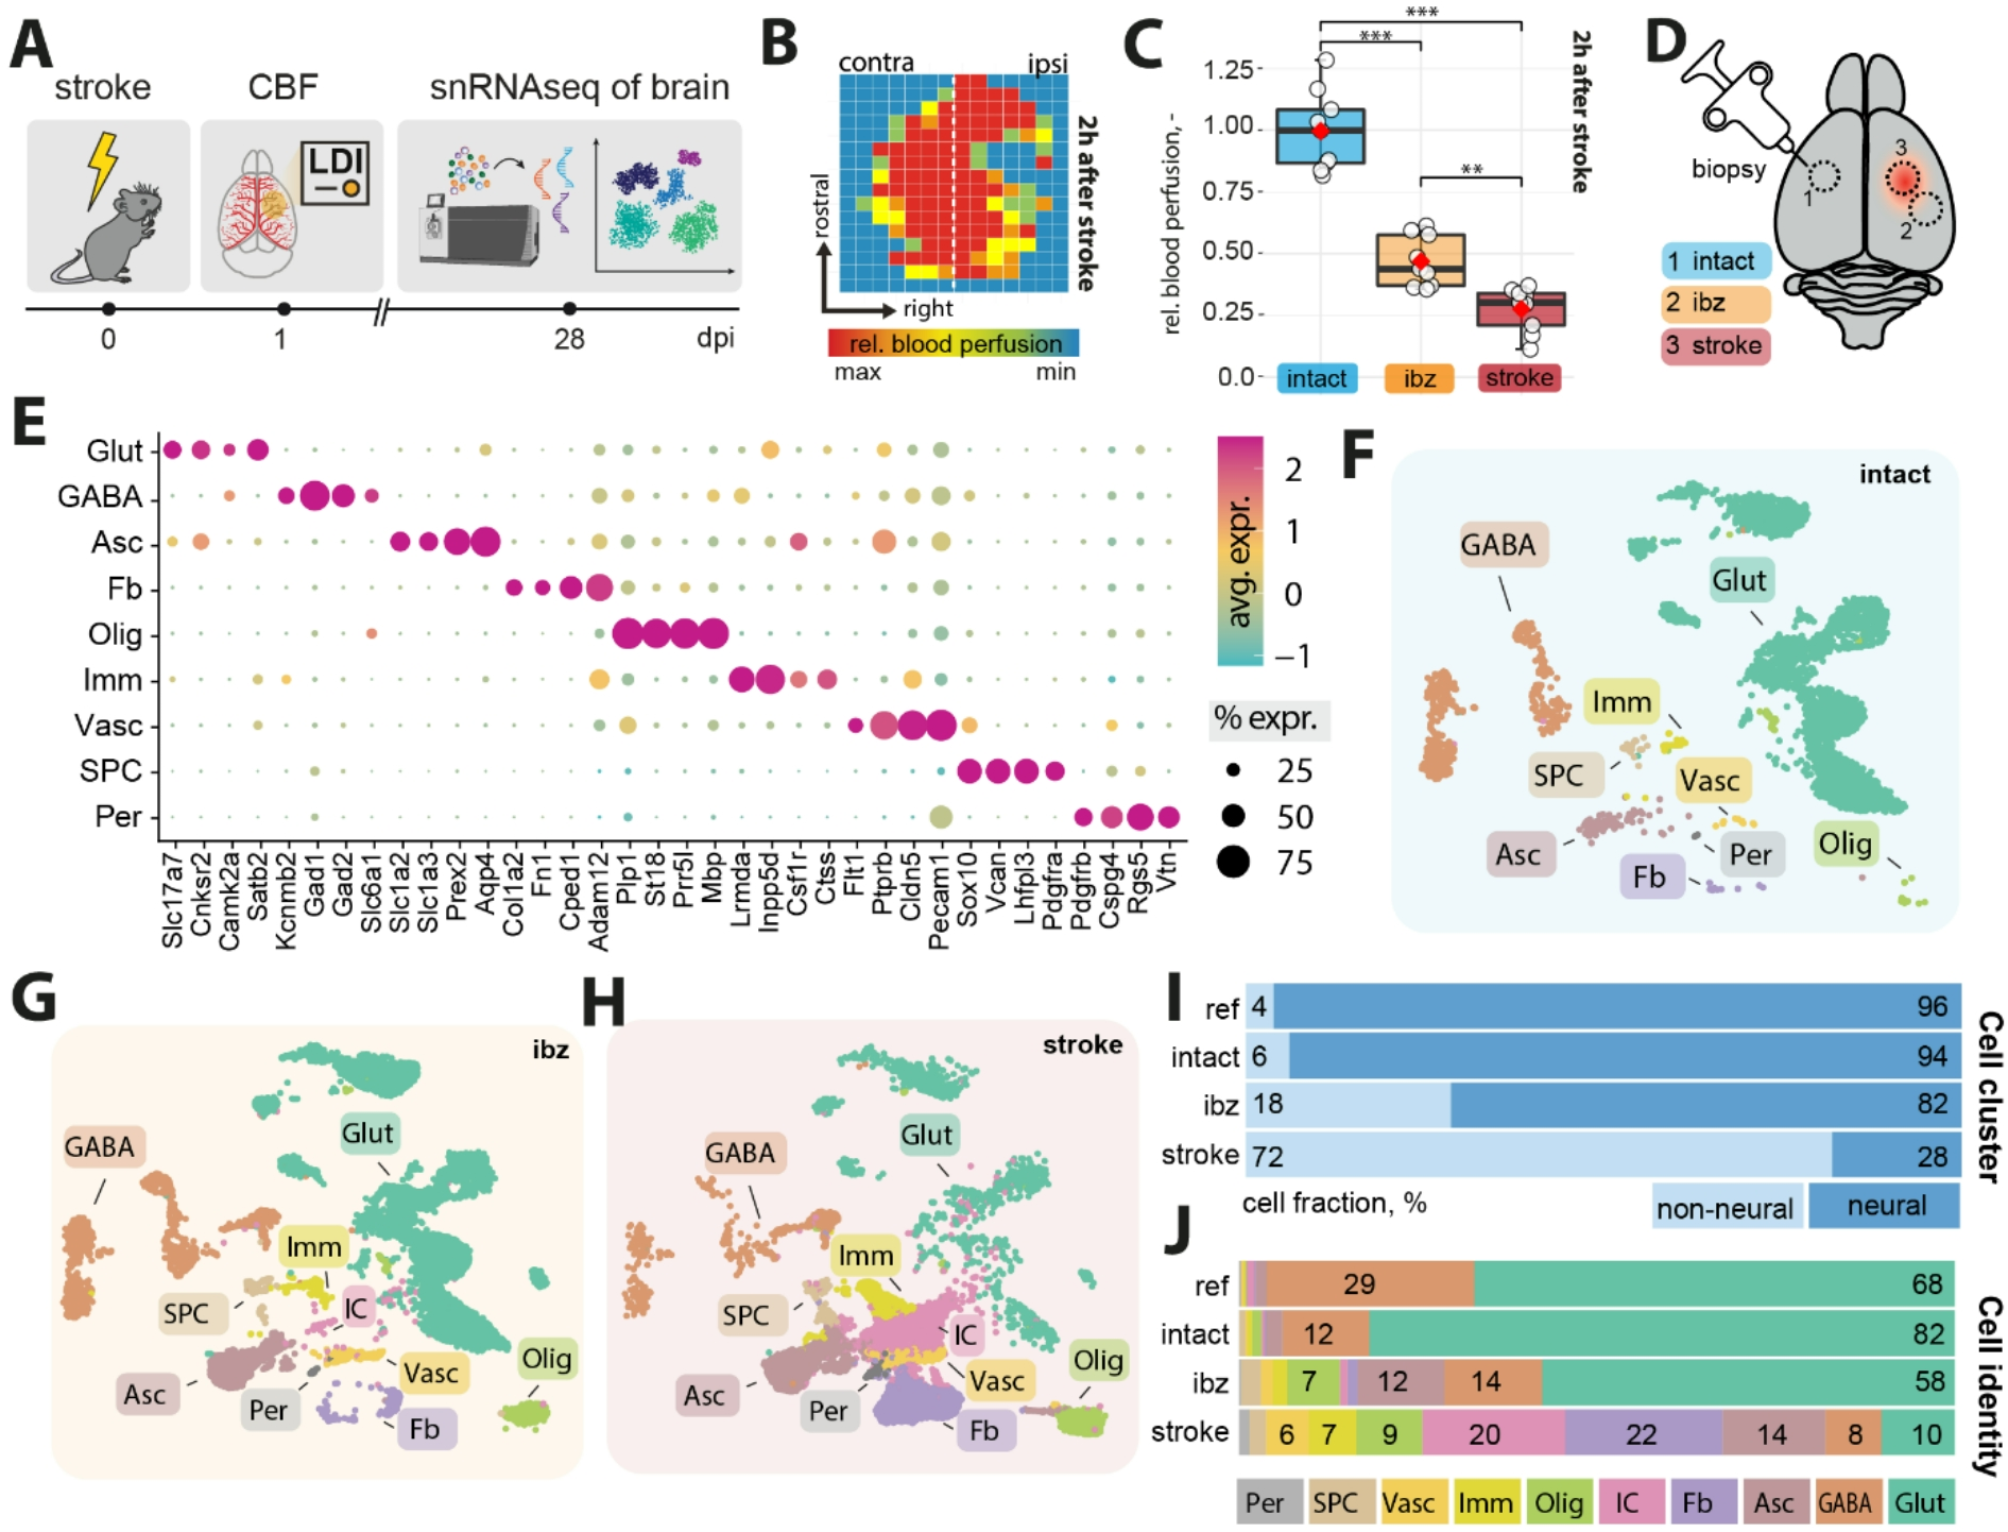
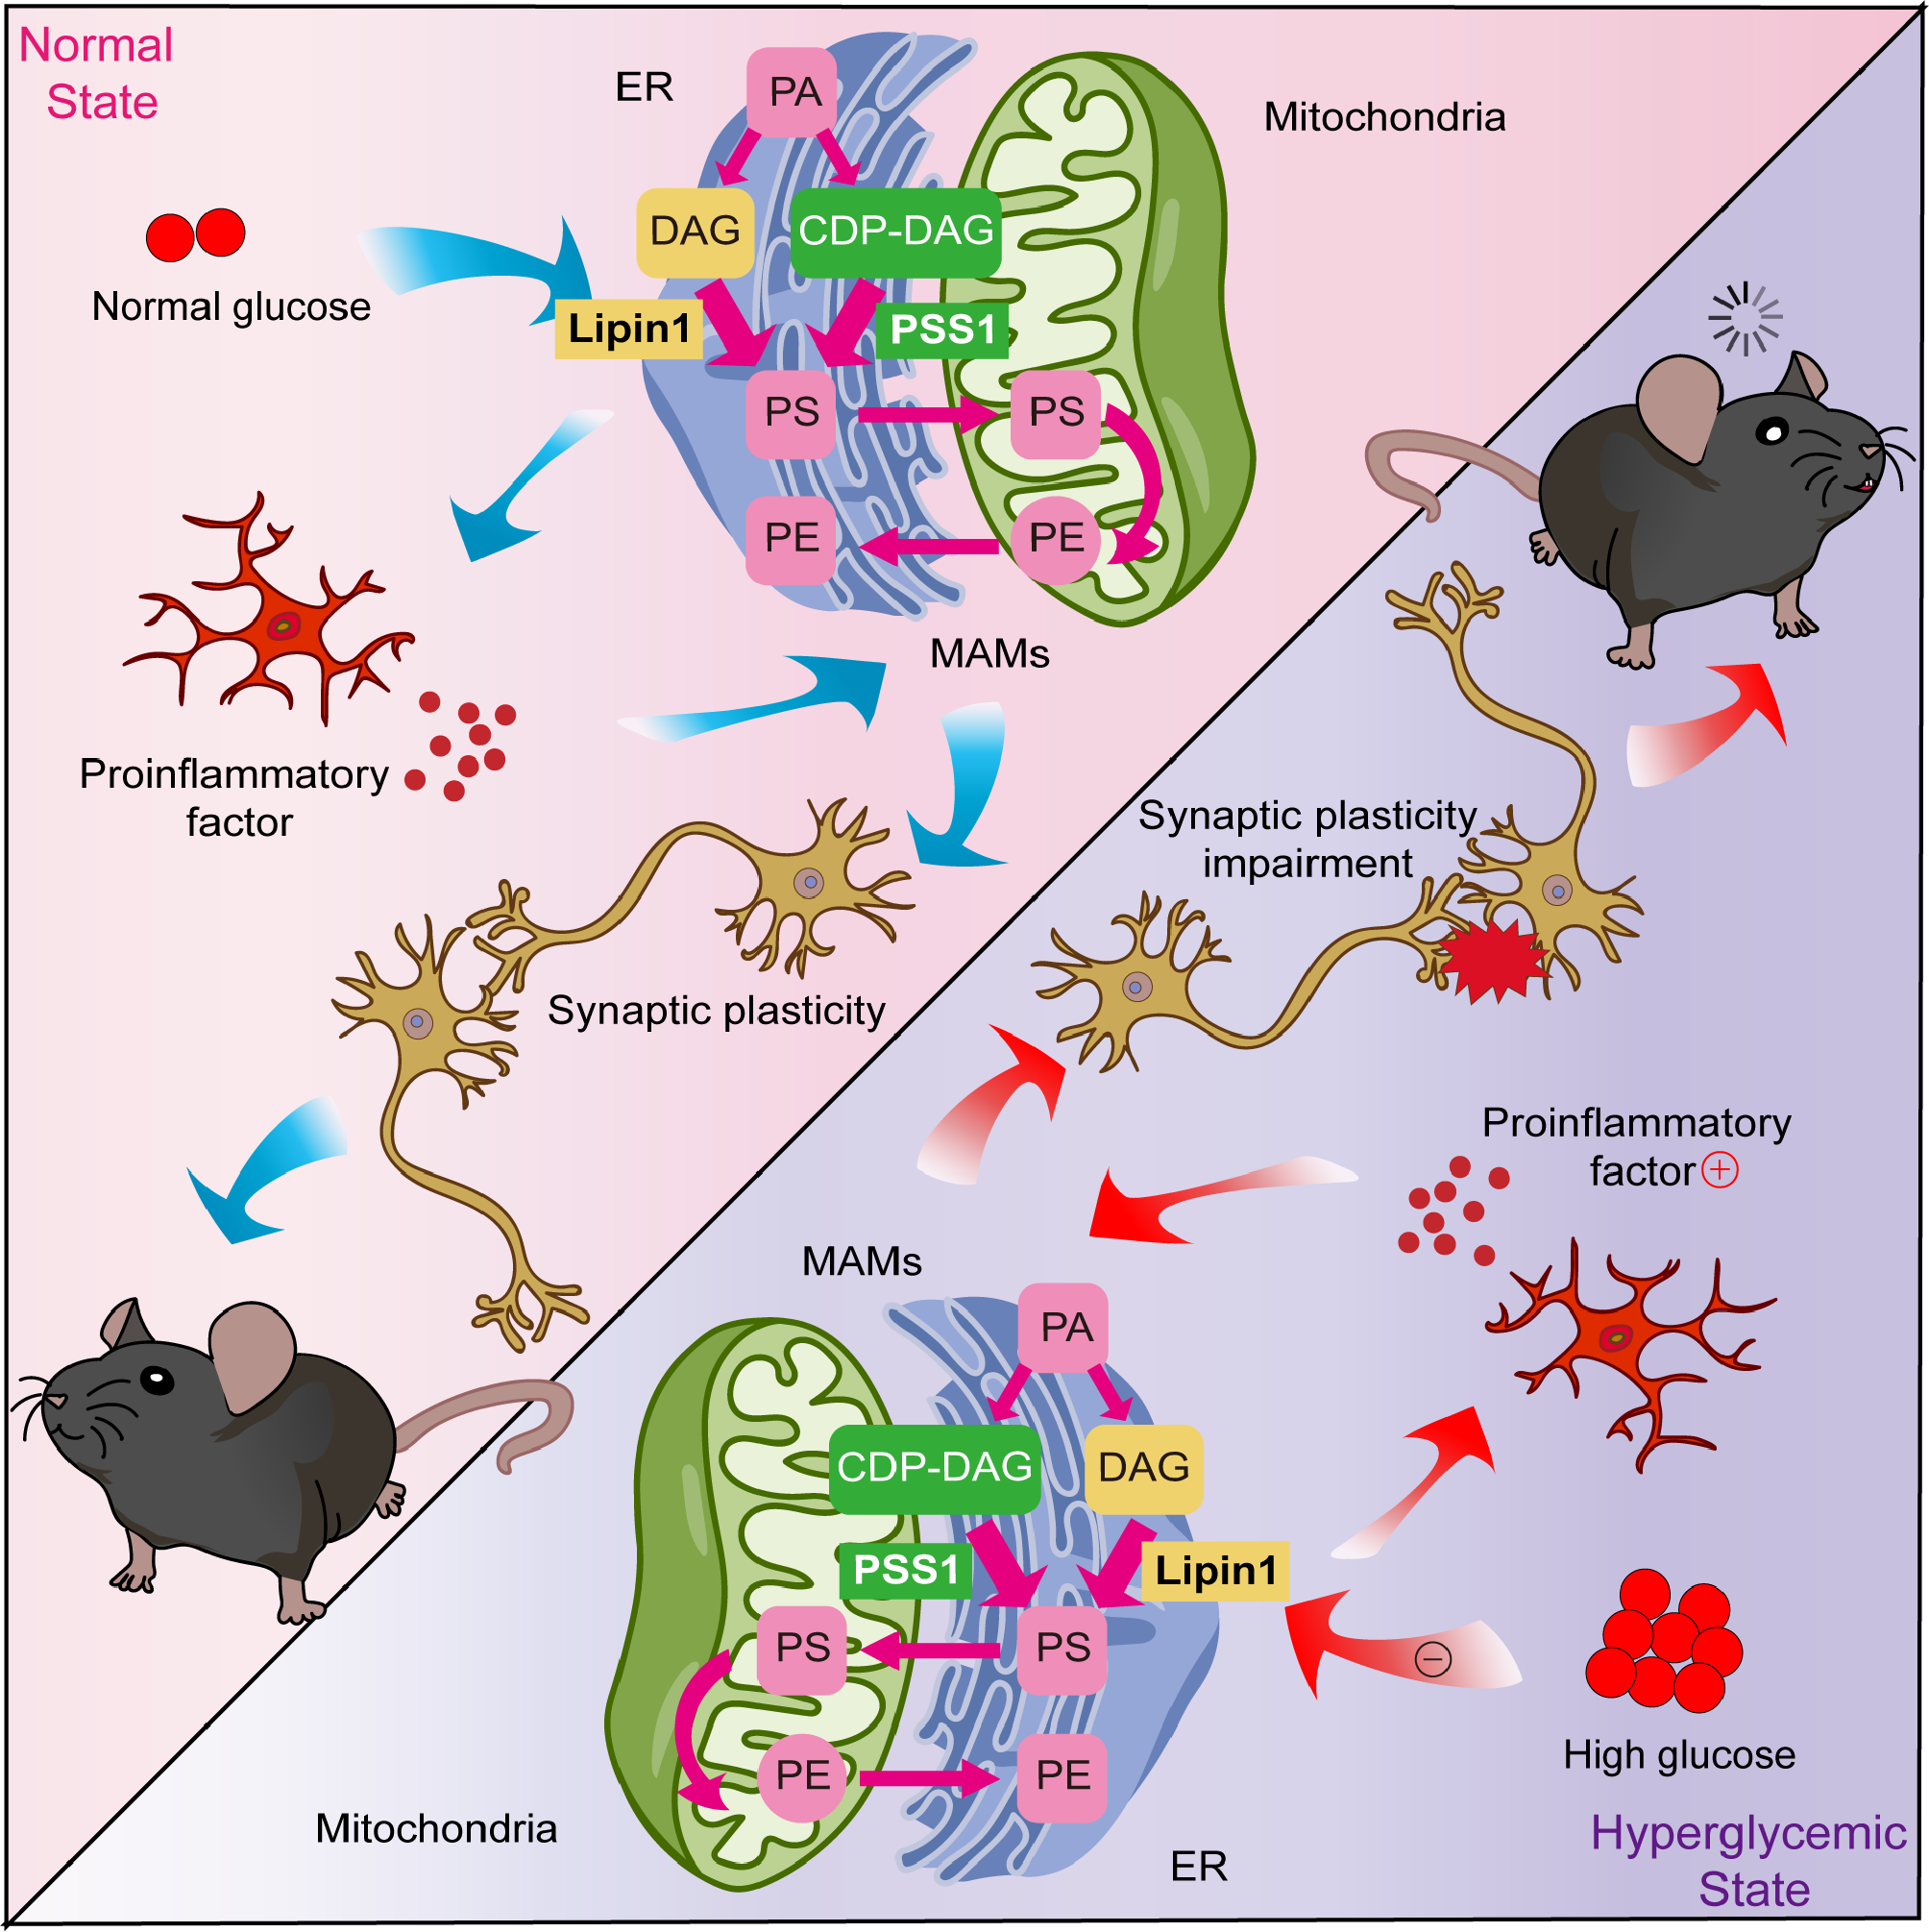
Remember me

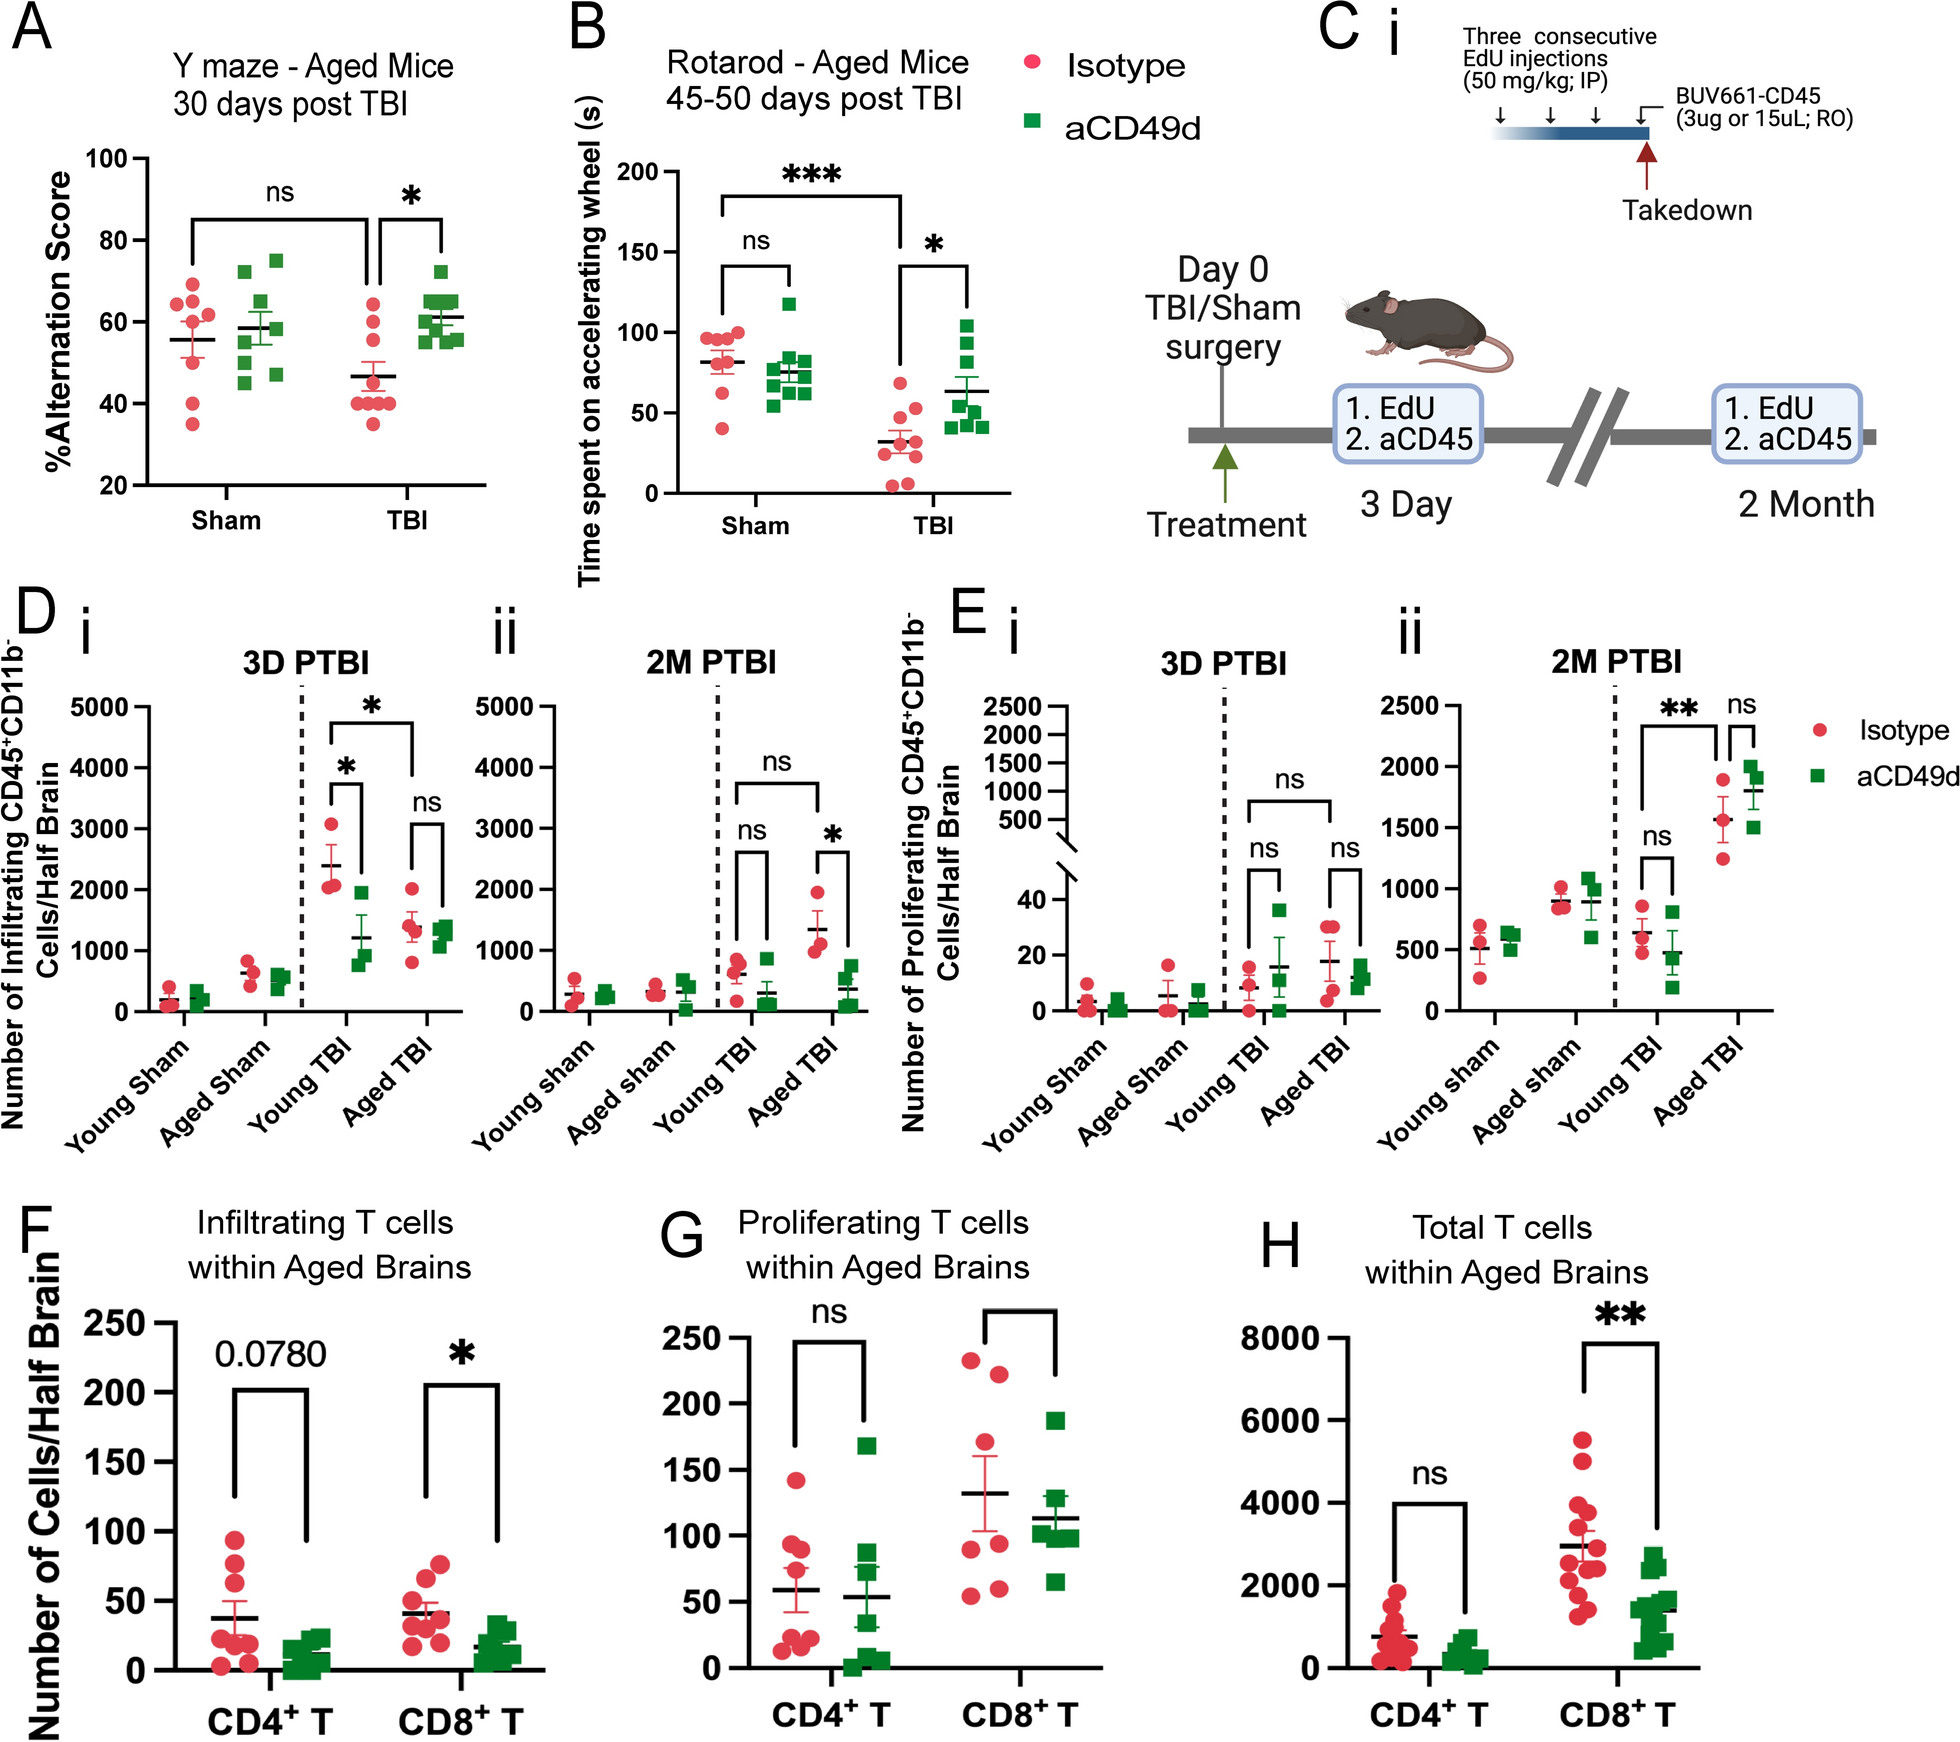

TBI was induced in mice via controlled cortical impact (CCI), as we have previously published [7, 8]. All mice underwent a 1-cm sagittal incision to expose the skull. Sham mice only received the incision whereas TBI mice further received a 5-mm craniectomy to expose the brain at coordinates, − 2 mm anteroposterior axis and + 2 mm mediolateral of bregma. Following craniotomy, TBI mice received a severe injury at 2-mm depth delivered by a 3-mm impacting tip striking the exposed cortex at 2.5 m/s. At a clinically relevant time of 2 h post TBI or sham surgery, mice received 300 ug of aCD49d Ab or its isotype control via intraperitoneal injection. We previously showed a significant accumulation of CD8+ T cells in aged mouse brains 2 months post TBI [7]. To investigate how long-term prevention of lymphocyte invasion to the injured brain affects aged mice and their TBI outcomes, we repeated dosing every two weeks for up to 2 months. As a result, aCD49d Ab treatment significantly improved the survival of aged mice post-TBI (p = 0.0050). Out of 19 aged TBI isotype-treated mice, 8 mortalities were found. Out of 17 aged TBI aCD49d-treated mice, 2 mortalities were found [8]. There were no mortalities in aged sham mice as well as their younger counterparts (n = 13 for both treatment groups in aged sham mice, n = 12–13 for all young mouse groups, [8]). Brains were harvested at 2 months post TBI. Using previously published gating [7, 8], in the aged mouse brains 2 months post TBI, aCD49d Ab treatment led to an attenuation of lymphocyte accumulation (Supp Fig. SAi and ii) and specifically reduced CD8+ T cells (Supp Fig. S1Aiv) but not CD4+ T cells (Supp Fig. S1Aiii) in the brain parenchyma compared to isotype treatment. Meanwhile, the CD8+ T cell reduction was not noted within the brains of young mice (Supp Fig. S1Aiv, 8). Furthermore, to characterize the effect of aCD49d Ab treatment on motor coordination and spatial working memory, deficits that are common in human TBI patients, mice underwent Y-maze and rotarod tests. Analysis of spatial working memory is assessed by recording the spontaneous alternations between the two arms of a Y-shaped maze. Over the course of the test, a naïve mouse tends to enter the less recently visited arm. In the current study, aged aCD49d Ab treated TBI mice had a higher percent alternation score than isotype treated TBI mice (Fig. 1A). In fact, the aged aCD49d Ab treated mice demonstrated similar performance to aged sham injured mice indicating preservation of working memory after injury. In the rotarod test that examines motor function, aged aCD49d Ab treated TBI mice spent more time on the accelerating wheels, indicative of improved motor coordination as compared to isotype treated mice (Fig. 1B). Consistent with our previously published data, no effect of aCD49d Ab was seen in young mice post TBI (Supp Fig. S2, 8).
Fig. 1
aCD49d Ab treatment reduced the infiltration and total number of CD8+ T cells in the injured brains of aged mice. A Results of Y maze indicated by %alteration score. B Results of rotarod indicated by time spent on accelerating wheels (s). C i. A scheme of the EdU and BUV661-CD56 injections. IP, intraperitoneal injection. RO, retro-orbital injection. ii. Mice received EdU and BUV661-CD45 to label proliferating and infiltrating cells in the brains at 3 days and 2 months post-TBI. D Quantifications of infiltrating CD45+ cells in mouse brains at i. 3 days post-TBI and ii. 2 months post-TBI. E Quantifications of proliferating lymphocytes in mouse brains at i. 3 days post-TBI and ii. 2 months post-TBI. Quantifications of F infiltrating, G proliferating, H total T cells within aged brains. Data are from one independent experiment in D, E and two independent experiments in A, B and F–H. All data are shown as the mean ± SEM. 2-way ANOVA with Tukey’s multiple comparisons test in A, B and D, E, n = 8–10/group for A and B, n = 3–4/group for D and E,.Student’s t-test in F–H, n = 7–13/group. *p < 0.05, **p < 0.01, ***p < 0.001. Number of Cells/Half Brain indicated whose samples split into two halves for staining with two flow cytometry panels
Given that aCD49d Ab exerts its neutralization effect primarily in the periphery and does not cross the blood brain barrier (BBB), it is important to measure CD49d level in the periphery and whether CD49d levels change in response to normal aging. To assess CD49d expression in the periphery among different immune cell types at a steady state, we sampled 25 μL of blood via submandibular collection from B6 naïve mice of different ages. Remarkably, both CD4 + and CD8 + T cells exhibit age-dependent upregulation of CD49d expression (Supp Fig. S3C with gating in Supp Fig. S3A and B), indicating an increased potential of T cell extravasation and migration with aging.
aCD49d Ab treatment decreased lymphocyte infiltration and reduced the number of CD8+ T cells in the injured brains of aged miceNext, to explain how CD8+ T cells accumulate within aged mouse brains post TBI, we aimed to distinguish between chronic recruitment versus local proliferation of CD8+ T cells within the aged brain post TBI. To do so, we administered 5-ethynyl-2’-deoxyuridine (EdU), a well-established thymidine analogue assaying DNA synthesis, intraperitoneally for three consecutive days prior to euthanasia. This allows for the detection of strong EdU signals within proliferating cells in the brain. Two hours prior to euthanasia, BUV611 conjugated antiCD45 antibodies were injected retro-orbitally. This labeled infiltrating cells into the brain (Fig. 1Ci; gating is shown in Supp Fig.S1C). Intracardiac perfusion was performed to clear the vasculature. Brains were harvested which were used to compare infiltrating, proliferating, and total T cells at 3 days (acute) and 2 months (chronic) post-TBI (gating strategy shown in Supp Fig. S1B and C). Firstly, we measured the number of infiltrating and proliferating CD45+CD11b− cells that primarily label lymphocytes. At 3 days post-TBI, young mice had significantly more infiltrating CD45+CD11b− cells than aged mice (Fig. 1D). However, at 2 months post-TBI, aged mice had more infiltrating CD45+CD11b− cells than young mice (Fig. 1D). As expected, aCD49d Ab limited the infiltration of CD45+CD11b− cells (Fig. 1D), especially in aged mice 2 months post-TBI. Focusing on local proliferating cells, we observed only few proliferating CD45+CD11b− cells at 3 days post-TBI (Fig. 1E). Contrastingly, we noted increasing proliferating CD45+CD11b− cells, more prominent in aged than young brains 2 months post-TBI (Fig. 1E). Next, we measured different lymphocytes in infiltrating and proliferating CD45+CD11b− cells. Further phenotypic analysis demonstrated that B cells and natural killer (NK) cells made up a high proportion of infiltrating and proliferating CD45+CD11b− cells but both cell types were not subject to aCD49d Ab effect. Whereas phenotypic analysis of T cells revealed that aCD49d Ab treatment significantly reduced infiltrating CD8+ T cells (Fig. 1F) but had no effect on local proliferating T cells (Fig. 1G) in aged brains 2 months post TBI. Given that CD8+ T cells did not actively infiltrate into aged mouse brains at 3 days post-TBI nor did they proliferate within the brains (Supp Fig. S1Di–iii), previously observed CD8+ T cell accumulation long-term post-TBI was primarily due to chronic infiltration of CD8 + T cells in aged mouse brains (Fig. 1H).
aCD49d Ab treatment suppressed peripheral and local inflammatory immune responses in acute TBICytokines and chemokines mediate systemic and local inflammatory response immediately after TBI and induce chemotaxis of various immune cells. Therefore, the next experiment aimed to determine cytokine and chemokine levels within both the blood and the brain via a Luminex multiple cytokine assay. A majority of sham mice, regardless of treatment, had no above-threshold detection of injury-related cytokines and chemokines. Therefore, their data were shown as zero in Fig. 2. Consequently, plasma levels of the pro-inflammatory cytokines interlukin-6 (IL-6), IL-17A, and IL-22 as well as tumor necrosis factor alpha (TNF-α) were elevated in aged TBI mice 3 days post-injury as compared to young mice (Fig. 2Ai–iii and v). However, aCD49d Ab treatment markedly reduced their levels in aged TBI mice (Fig. 2Ai–iii and v). Similar suppression after aCD49d Ab treatment was also noted in CXC chemokine ligand 2 (CXCL2), which is produced almost exclusively by neutrophils, in aged TBI mice at 3 days post-injury as compared to isotype treated mice (Fig. 2Aiv). Furthermore, IL-12p70 (IL-12), which is produced by activated antigen-presenting cells (APC) and enhance Th1 and cytotoxic CD8+ T cells, along with IL-1β were elevated at 7 days post-TBI in isotype treated mice and were decreased with aCD49d Ab treatment (Supp Fig. S4A and B). Interestingly, the peripheral cytokine response mirrored that in the brain as observed in IL-6, IL22, IL-17A, and CXCL2 (Fig. 2B i–iv). There were no significant changes, or expression was below the level of detection, in the remaining cytokines and chemokines analyzed in any group.
Fig. 2
Luminex multiplex assay for cytokine/chemokine analysis in aged versus young mice at 3 days post injury. A Levels of cytokines in the plasma including i. CXCL2, ii. IL-22, iii. IL-6, iv. IL-17A, and v. TNF-α. B Levels of cytokines in the ipsilateral brain tissue homogenates including i. CXCL1, ii. CXCL2, iii. IL-6, iv. IL-22, and v. IL-17A. Data are shown as the mean ± SEM, 2-way ANOVA with Tukey’s multiple comparisons test. n = 3–4/group, *p < 0.05, **p < 0.01, *** p < 0.001. Data are from one independent experiment
aCD49d Ab treatment suppressed immune cell chemotaxis but induced GM-CSF in aged brains with chronic TBIAt 2 months post TBI, several chemoattractants continued to increase within aged mouse brains compared to young mouse brains. aCD49d Ab treatment suppressed the level of CXCL1 and CCL11 which are involved in the selective recruitment of neutrophils and eosinophils, respectively (Fig. 3Ai and iii). Likewise, CCL7, a potent chemoattractant that recruits multiple leukocyte populations, showed similar suppression with aCD49d Ab treatment (Fig. 3Aii). To our surprise, granulocyte–macrophage colony-stimulating factor (GM-CSF) in the aged mouse brains was comparable to the level in young mouse brains 2 months post TBI. However, GM-CSF levels were found to be increased with aCD49d Ab treatment along with increases in CCL2 and TNF-α (Fig. 3Aiv–vi).
Fig. 3
Cytokine/chemokine analysis in aged and young mice at 2 months post injury. A Luminex multiplex assay measuring the cytokines/chemokines in the ipsilateral brain tissue homogenates including i. CXCL1, ii. CCL7, iii. CCL11, iv. CCL2, v. GM-CSF, and vi. TNF-α. B Cytokine response in brain-derived i. CD4 + and ii. CD8 + T cells isolated from TBI mice post ex vivo stimulation. C Frequency of Th1, Th2, and Th17 as measured by corresponding transcription factors(TF) T-bet + , GATA-3 + , and RORγt + CD4 + T cells. n = 3–8/group, *p < 0.05, **p < 0.01. All data are from one independent experiment. Data are shown as the mean ± SEM, 2-way ANOVA with Tukey’s multiple comparisons test was used for A and the Student’s t test was used for B and C. Number of Cells/Half Brain and Freq of CD4 + T cells/Half Brain indicated whose samples split into two halves for staining with two flow cytometry panels
We previously published that the plasma from aCD49d Ab treated, aged mice at 2 months post TBI had an augmented Th2 response indicated by the Th2 related cytokines IL-4 and IL-13 [8]. To measure cytokine expression capacity of T cells within the brains isolated from aged TBI mice, we stimulated brain derived immune cells with PMA/ionomycin and incubated with golgi-plug containing brefeldin A ex vivo (Fig. 3B, gating shown in Supp Fig. 5B). Consequently, CD4 + T cells expressing IL-13 were significantly increased in the aCD49d Ab-treated brain cells compared to the isotype-treated brain cells isolated from aged TBI mice (Fig. 3Bi). In terms of brain-derived CD8+ T cells, post ex vivo stimulation, we found that most CD8+ T cells express IFNγ, especially the CD8+ T cells in aged TBI mouse brains. aCD49d Ab appeared to have a nonsignificant reduction in IFNγ expression and a moderate nonsignificant increase in IL13 expression in aged mice 2 months post TBI (Fig. 3Bii). CD4 + T cells express transcription factors T-bet, GATA-3, and RORγt representing Th1, Th2, and Th17, respectively. In a separate experiment, we directly measured these transcription factors in CD4 + T cells within mouse brains via flow cytometry (gating shown in Supp Fig. S5A). As a result, aged mouse brains had decreased frequency of T-bet+and GATA-3+ yet elevated frequency of RORγt+ CD4 + T cells as compared to young mouse brains (Fig. 3C). aCD49d Ab did not affect the frequency of these CD4 + T cell subtypes with the exception of a further decrease in the frequency of T-bet+ in CD4 + T cells (Fig. 3C).
aCD49d Ab treatment leads to fewer clonally expanded CD8+ T cells in aged brains with chronic TBITo investigate the genes, signatures, and pathways involved with aCD49d Ab treatment, we applied single-cell RNA sequencing (scRNA-seq) to brain tissue collected from both young and aged TBI mice treated with aCD49d ab or isotype control (YTBI_Istoype, ATBI_Isotype, YTBI_aCD49d, ATBI_aCD49d). For each group, we pooled two biologic replicates to reduce biologic variance. We excluded sham mouse brains as they had a limited number of infiltrating immune cells. The scRNA-Seq data identified eight distinct cell populations embedded in a Uniform Manifold Approximation and Projection (UMAP) plot (Fig. 4Ai).
Fig. 4
Clonally expanded CD8+ T cells patrolled aged mouse brains post-TBI and aCD49d Ab treatment induced transcriptional changes largely in CD8+ T Cells. A single-cell TCR analysis overlaid on UMAP projections showing distribution of T cell clonality. C: clonally expanded. NC: nonclonally expanded. B UMAP showing distribution of T cell subtypes based on T cell atlases 4. C Dot plot showing the markers to identify different T cell subtypes. D Bar graph demonstrating number of clonality across T cell subtypes. E Bar graph demonstrating proportion of i. all T-cell, ii. CD8 effector memory T-cell, and iii. CD8 naïve like T-cell clonality across samples. F The proportion of clones belong to each clone size category. ATBI: aged TBI mouse brains. YTBI: young TBI mouse brains
As we previously identified, aCD49d Ab treatment exerts its effect mainly through targeting CD8+ T cells. Herein, we integrated single-cell TCRseq with single-cell RNAseq to assess the clonality of T cells and their transcriptomes post-TBI. T cell clusters from the scRNAseq data (Fig. 4Ai) comprised of clonal (C) and nonclonal (NC) T cells (Fig. 4Aii). We utilized the atlases in Andreatta et al. [14] to identify nine T cell subclusters: 1) CD8+ naïve-like (NL) cells with enriched genes including Cd8a, Il7r, and Tcf7, 2) CD8+ effector memory (EM) cells high in Cd8a and granzymes Gzmk, Gzmb but low in Tox, Pdcd1, 3) CD8+ early active cells (EA; an intermediate CD8+ profile between NL and EM, 4) CD8+ terminally exhausted (Tex) cells with high expression of granzymes and inhibitory receptors (Pdcd1, Ctla4, Lag3) and Tox, 5) CD8+ precursor-exhausted (Tpex) cells enriched in inhibitory receptors but low in granzymes, 6) CD4+ NL cells enriched in Cd4, Il7r,Ccr7, and Tcf7, 7) CD4+ follicular-helper (Tfh) high in Cd4 and Tox, 8) Th1 (Cd4 and Fasl), and 9) Treg cells (Cd4 and Foxp3) (Fig. 4B and C). Overall, T cell cluster was made of CD8+ NL (31.6%) and CD8+ EM cells (31.9%) with only few CD8+ Tex and Tpex cells (1.6% and 1.9%) (Fig. 4D). As expected, most clonally expanded T cells were CD8+ EM cells (72.4%), followed by CD8+ NL cells (48.3%) and CD8+ EA cells (44.0%) (Fig. 4D). In fact, the atlases-annotated CD8+ NL cells and CD8+ EA cells resembled each other transcriptomically, with CD8 + NL cells expressing slightly fewer effector markers, potentially explaining the clonal expansion of CD8 + NL cells (Fig. 4C). Comparing by groups, T-cells from Aged TBI-Isotype treated mice had a higher proportion of clonal T cells than did the Aged TBI-aCD49d ab treated group (72.5% versus 62.3%; Fig. 4Ei). This was consistent in CD8+ EM (93.8% versus 82.9%; Fig. 4Eii) and CD8+ NL cells (70.0% versus 59.1%; Fig. 4Eiii). On the contrary, no such difference was seen in aCD49d treated young mouse brains (Fig. 4Ei–iii). To delineate the relative abundance of TCR clones in their individual repertoire, we applied scRepertoire R package [15] to quantify the proportion of clones by their size. As a result, 14.0% of TCR clonotypes in the Aged TBI-Isotype treated samples belonged to hyperexpanded clones (clones taking up more than 1/10 of clonal space) which were not found in the Aged TBI-aCD49d treated samples (Fig. 4F). This indicates that aCD49d Ab treatment might attenuate excessive clonal expansion.
aCD49d Ab treatment reduces CD8+ T cells exhibiting higher effector status in aged mouse brains with chronic TBITo further interrogate the CD8+ T cells, we subseted CD8+ T cells (Cd8a > 1.5) in scRNAseq followed by unsupervised clustering (Supp Fig. S6A). Most CD8+ T cells originated from aged TBI mouse brains (i.e., ATBI_isotype and ATBI_aCD49d) with treatment-dependent cluster 6 uniquely expressed in ATBI_aCD49d and cluster 0 in ATBI_isotype (Supp Fig. S6A). Upon comparing the expression of genes associated with effector, exhaustion, and memory along with clonality (Supp Fig. S6B and C), we found that aged mouse brains had a substantial number of dysfunctionally activated CD8+ T cells, herein defined as those that highly co-express genes associated with exhaustion (Pdcd1, Entpd1, Ctla4, Havcr2) and effector genes (Gzmk, Gzmb, Prf1, Tnf, Ifng). We also found two clusters of treatment-dependent functionally activated CD8+ T cells that are high in effector genes only, and two clusters of age-dependent stem-like memory T cells (Tcf7, Slamf6, Lef1, Sell) (Fig. 5A). Nonclonal T cells high in Ccr7 were defined as naïve-like T cells (Supp Fig. S6B, Fig. 5A). Isg15 marked a cluster of IFN dominated CD8+ T cells. Lastly, we found a small cluster with CD8+ T cells in S phase only (Fig. 5A). Thereafter, aCD49d Ab decreased functionally activated CD8+ T cells proportionally compared to isotype treatment (6.6% versus 29.8%; Fig. 5Ai and ii). Dysfunctionally activated and functionally activated CD8+ T cells are transcriptionally distinct as indicated by significant DE genes associated with exhaustion (Ctla4, Pdcd1), migration (Ccl4, S100a11), and tissue-residency (Cxcr6) (Fig. 5B). Contrastingly, functionally activated CD8+ T cells differentially upregulated effector gene Ly6c2 (Fig. 5B). Flow cytometry further validated that aCD49d Ab treatment significantly reduced activation as demonstrated by PD-1 production in CD8+ T cell as compared to isotype treatment (Supp Fig. S7Ai and ii). Meanwhile, aCD49d Ab treatment showed a nonsignificant reduction in CD8+ T cell activation marked by CD69 expression (Supp Fig. S7Bi and ii). Furthermore, CD49dhigh CD8+ T cells expressed significantly increased expression of granzyme B than did CD49dlow CD8+ T cells within TBI mouse brains (Fig. 5Ci and ii; gating is shown in Supp Fig. S8). Similarly, CD49dhigh CD8+ T cells expressed significantly increased expression of Ly6C than did CD49dlow CD8+ T cells within TBI mouse brains (Fig. 5Ci and iii). aCD49d Ab treatment significantly %CD49dhigh CD8+ T cells and %Granzyme B+ CD8+ T cells in aged mice after 2 months post TBI (Fig. 5Di and ii). aCD49d Ab treatment also led a nonsignificant reduction of %Ly6C+ CD8+ T cells in aged mice after 2 months post TBI (Fig. 5D iii).
Fig. 5
aCD49d Ab treatment reduces CD8 + T cells that exhibit higher effector status in aged mouse brains after TBI. A i. UMAP showing distribution of CD8 + T cell subtypes based on various T cell differentiation states. ii. Bar graph demonstrating proportion of different T cell differentiation states across samples. B Volcano plot depicting DEGs in functional vs dysfunctional activated CD8 + T cells within the brains of aged, injured mice two months post TBI. ATBI: aged TBI mouse brains. YTBI: young TBI mouse brains. C i. Histogram showing cutoff for CD49d high vs CD49d low in CD8 + T cells. ii. Comparison of % granzyme B high in CD49d high vs CD49d low CD8 + T cells. iii. Comparison of % Ly6C high in CD49d high vs CD49d low CD8 + T cells. D i. % CD49d high in CD8 + T cells across TBI samples. ii. % granzyme B high in CD8 + T cells across TBI samples. iii. % Ly6C high in CD8 + T cells across TBI samples. Data are from one independent experiment and shown as the mean ± SEM. 2-tailed paired student’s t test, n = 12 for C. 2-way ANOVA with Tukey’s multiple comparisons test for D, n = 3–5/group, *p < 0.05, **p < 0.01, ***p < 0.001
aCD49d Ab repopulated MHCII high macrophages within aged brains with chronic TBIGiven the unexpected observation of elevated GM-CSF in aged TBI mice after aCD49d treatment (Fig. 3Av), we compared the number of macrophages, monocytes, and microglia between experimental groups (known responders subject to be affected by GM-CSF). Using previously published gating [7, 8], we found that while monocytes and microglia numbers remained relatively stable regardless of treatment (Supp Fig. S9B, C), brain macrophage numbers in aged TBI mice doubled after aCD49d Ab treatment as compared to isotype control (Supp Fig. S9A). To date, our understanding of brain macrophages is limited, particularly in the context of TBI. Brain macrophages in our samples could be subdivided based on their MHCII status. This is particularly relevant given recent reports indicating that MHCII status is connected with the ontogeny of brain macrophages and the importance of these cells in connection to brain homeostasis and disease [10,11,12]. Therefore, in a separate experiment, we scrutinized the quantity of brain macrophages in the context of age, injury, and treatment status. Subsequently, we observed an age-associated change in the quantity of macrophages based on MHCII status at basal levels: aged sham mice had attenuated MHCIIhigh macrophages (Fig. 6Ai) yet significantly increased MHCIIlow macrophages (Fig. 6Aii) as compared to their younger counterparts. 2 months post TBI, aged mouse brains had significantly fewer MHCIIhigh but not MHCIIlow macrophages as compared to young mouse brains (Fig. 6Ai and ii). Repeated aCD49d Ab treatment appeared to upregulate MHCIIhigh macrophages in the aged TBI mouse brains, corresponding to elevated GM-CSF in aged TBI mice with treatment (Fig. 6Ai). To our surprise, aCD49d Ab treatment significantly reduced MHCIIlow macrophages in the aged sham mouse brains. No other changes were noted after aCD49d Ab treatment in other sham groups. Indeed, recruited monocyte-derived macrophages are capable of differentiating into tissue-specific macrophages and become long-lived CNS boarder-associated macrophages (BAMs; 10). Conversely, some BAMs can self-maintain, thereby retaining their yolk sac origin [10]. To further decipher their identify, CD45+CD64+ macrophages from aged TBI mouse brains were gated on key surface markers for BAM including CLEC12A, MHCII, P2RX7, MMR, FOLR2, NRP1, CD63 (gating strategy shown in Supp Fig. S10), as described previously [10]. As a result, we identified 6 BAM subtypes: MHCIIlow dural BAM (D-BAM), MHCIIlow subdural BAM (SD-BAM), MHCIIlow choroid plexus epiplexus BAM (CPepi-BAM), MHCIIlow choroid plexus BAM (CP-BAM), MHCIIhigh D-BAM, MHCIIhigh CP-BAM. These BAMs reside in different brain compartments as depicted in Fig. 6Bi where MHCIIlow and MHCIIhigh D-BAMs are found in the dura mater, MHCIIlow and MHCIIhigh CP-BAMs in the choroid plexus stroma, CPepi-BAMs in the apical CP epithelium, and SD-BAms in the subdural. With aging, we noted a reduction in MHCIIhigh D-BAMs (Fig. 6Aiii) and increases in MHCIIlow D-BAMs, CPepi-BAMs, and CP-BAMs (Fig. 6Aiv), consistent with the age-associated changes in MHCIIhigh and MHClow macrophages seen in Fig. 6Ai and ii. In relation to aCD49d treatment, we observed a nonsignificant increase in MHCIIhigh CP-BAM and MHCIIlow CPepi-BAM in aged mice post TBI as compared to isotype treatment (Fig. 6Aii–iv).
Fig. 6
A Quantifications of i. MHChigh and ii. MHClow brain macrophages in both young and aged mouse brains and iii–iv their tissue specificity in sham mice. D-BAM, dural BAM; SD, subdural BAM; CP, choroid plexus BAM. B i. locations of BAMs in different compartments of the brains. Ii–iii. Quantifications of CP BAMs across different sample groups. Data are from one independent experiment and shown as the mean ± SEM, 2-way ANOVA with Tukey’s multiple comparisons test for i and ii, Student’s t-test for iii and iv. n = 2–6/group, *p < 0.05, **p < 0.01. C UMAP plot showing i. CD45 + immune cells isolated from 4 samples (young isotype TBI, young aCD49d TBI, aged isotype TBI, aged aCD49d TBI) for single-cell RNA seq experiment and clustered into 8 cell types by specific markers. ncMO, nonclassical monocytes; Mo, monocytes; NK, natural killer cells; NP, neutrophils; MΦ, macrophages; B, B cells; MG, microglia; T, T cells. ii. UMAP plot showing MHChigh and MHClow macrophage cluster and iii. identified subsets within the macrophage cluster. MDM, monocyte-derived macrophages; BAM, CNS boarder-associated macrophages. D Dot plot showing markers used to identify different macrophage subsets and Itga4 (CD49d) and compare their expression with Mo and MG. E SCORPIUS trajectory inference on the macrophage cluster
aCD49d Ab treatment induced transcriptome changes in macrophages in aged but not young brains with chronic TBIFocusing on the macrophage based on MHCII status, we separated macrophages into MHCIIhigh and MHCIIlow clusters (Fig. 6Cii). Given that macrophages in the mouse brains exhibited distinct transcriptional states depending on their ontogeny and tissue environment, we further divided macrophages into four subclusters (Fig. 6Ciii and D). The monocyte-derived macrophage (MDM) subcluster was characterized by their monocyte origins and recruitment (Ccr2, Fxyd5, Lgals3, Vim), whereas the BAM subcluster universally expresses Pf4. Based on recently reported gene markers differentially expressed in MHCIIlow versus MHCIIhigh BAMs (Mrc1, CD163, Gas6 versus H2-Aa, Klra2), we identified a MHCIIhigh BAM subcluster and two MHCIIlow BAM subclusters which differed by the expression of signature genes specific for meningeal MHCIIlow BAMs (Folr2), SD-BAMs (P2rx7), and CP-BAMs (Lilra5) [10]. Interestingly, the MHCIIhigh BAM subcluster showed enriched expression of Ccrl2, Ccl3, Ccl4, and ll1b, indicating an increased migration ability and inflammation (Fig. 6D).
Significantly upregulated DE genes (adjusted P < 0.01, log2(FC) > 0.25, present in at least 50% of the cells) in the MDMs within the aCD49d Ab-treated versus isotype-treated aged TBI groups were associated with macrophage activation/polarization including the T cell–interacting activating receptor on myeloid cells 1 (Tram1), late endosomal/lysosomal adaptor MAPK and MTOR activator 1 (Lamtor1), the receptor for activated protein C kinase 1 (Rack1), and eukaryotic elongation factor 1A1 (eEF1A1). These genes are associated with cytokine production (Supp Fig. S11Ai and iii). Top DE genes in the MHCIIlow BAM_2 cluster in aCD49d Ab-treated versus isotype-treated aged TBI groups included Cd86, and BAM signature genes Pla2g7, Ninj1, and Clec4n encoding platelet-activating factor acetylhydrolase, ninjurin 1, and C-type lectin domain family 4, respectively, with enriched pathways including negative regulation of activated T cell proliferation (Supp Fig. S11Aii and iii). We did not identify any significant DE genes in the MHCIIlow BAM_1 cluster between aCD49d Ab-treated and isotype-treated aged TBI groups, and significant DE genes in the MHCIIhigh BAM between aCD49d Ab-treated versus isotype-treated aged TBI groups overlapped with those in the MDM cluster (data not shown). On the other hand, comparing aCD49d Ab treated versus isotype-treated young TBI groups within the four clusters, all DE genes were without significance. When performing trajectory inference, these cells were ordered along a line for inferring developmental chronologies from MDM to either BAM groups (Fig. 6E) with the most predictive genes clustering into modules and depicted in a heatmap (Supp Fig. S12).
Comments (0)