
Remember me

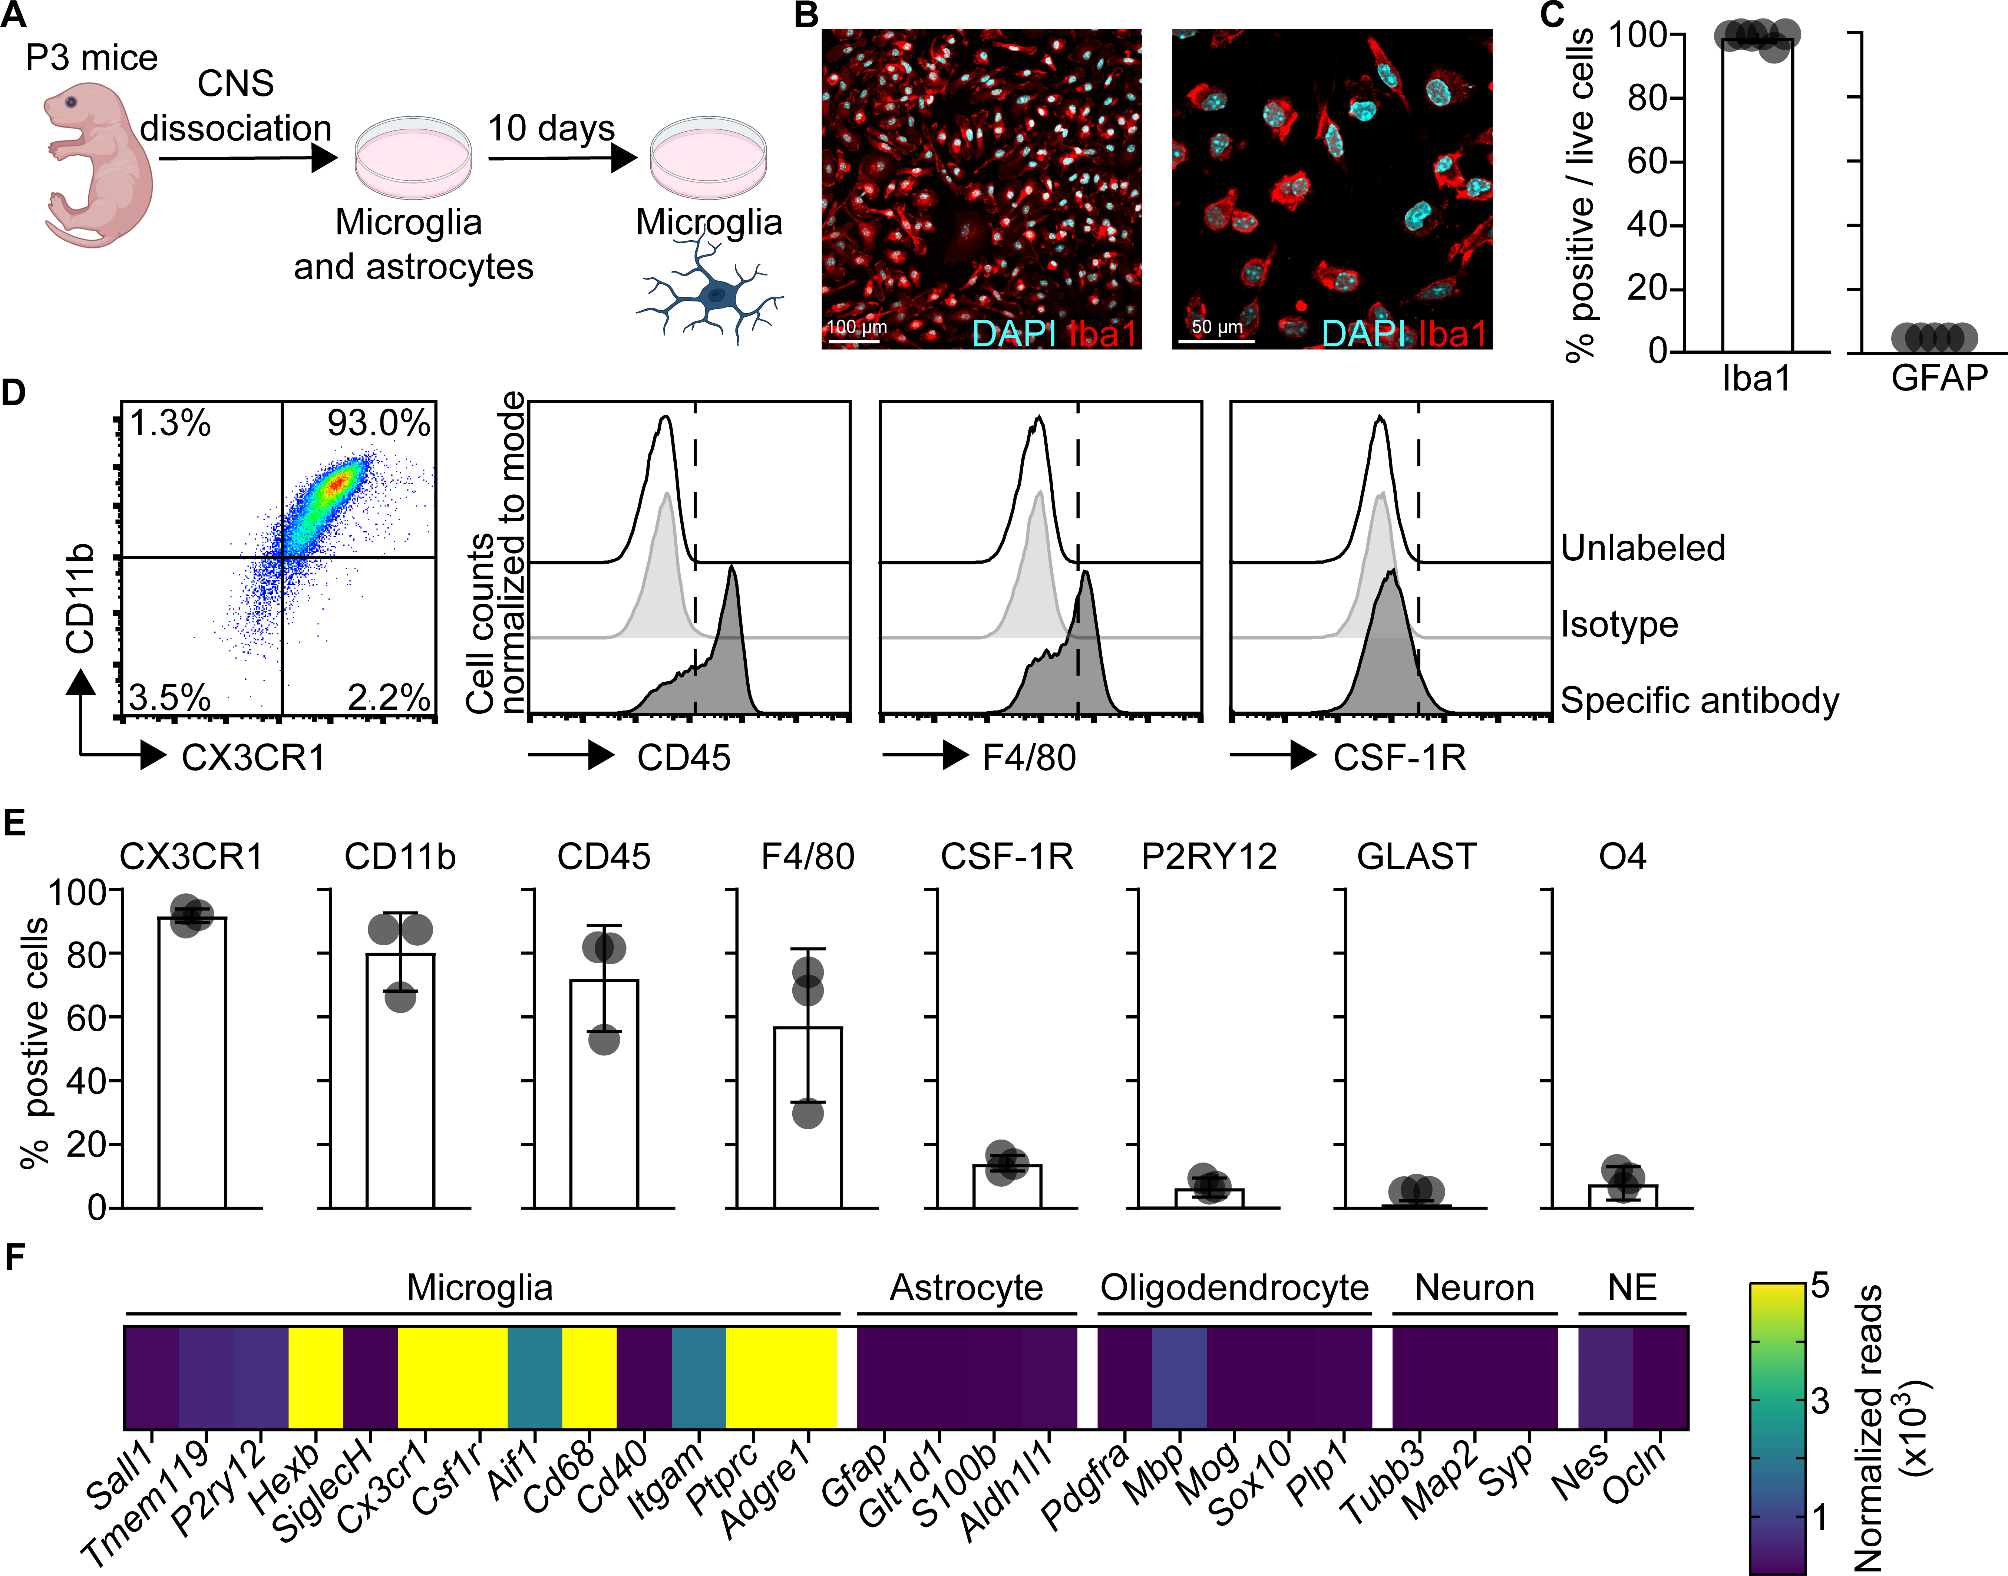

To study the influence of neurotropic virus infection on microglia, we retrieved microglia from murine primary glial cell cultures. In brief, we isolated brain cortices from P3 mouse pups, cultivated the mixed glial cells in vitro for 10 days, and then harvested microglia (Fig. 1A). The purity and identity of microglia cultures were further assessed by immunofluorescence microscopy, flow cytometry, and RNA sequencing (RNA-seq). Immunolabeling and fluorescence microscopy of cultured microglia revealed that basically all live cells were Iba1+ and GFAP− and showed the characteristic morphology of myeloid cells (Fig. 1B-C, Fig. S1A). Astrocytes were used as a positive control for the detection of GFAP expression (Fig. S1B). Flow cytometric analysis with stringent hierarchical gating of cells, singlets, and live cells (Fig. S1C) revealed abundant expression of CX3CR1, CD11b, and CD45 and approximately 50% of cultured microglia expressed F4/80 (Fig. 1D-E). In contrast, low and undetectable expression levels of CSF-1R and P2RY12 were found, respectively (Fig. 1D-E). Moreover, the astrocytic marker GLAST as well as the oligodendrocyte precursor marker O4 were absent (Fig. 1E). To substantiate the flow cytometric data, we performed transcriptomic analysis of mock-treated microglia cultures. Quantification of normalized reads revealed high expression of several myeloid marker genes including Cd68 and Itgam (CD11b) as well as the classical myeloid cell markers Cx3cr1, Aif1 (Iba1), Adgre1 (F4/80), and Csf1r (Fig. 1F). Microglia markers that are abundantly expressed in adult mice such as Sall1, Tmem119, SiglecH, and P2ry12 were detected at relatively low levels, which is in accordance with other studies using microglia cultures [35]. The purity of microglia cultures was further underscored by absence of the astrocytic marker genes Gfap, S100b, and Aldh1l1, the oligodendrocytic marker genes Pdgfra, Mbp, and Plp1, and the neuronal marker genes Tubb3, Map2, and Syp (Fig. 1F). Furthermore, genes characterizing cells emerging from the neuroectodermal (NE) lineage such as Nes and Ocln were absent as well. Collectively, our data demonstrated that the microglia cultures used in this study mainly consist of microglia and that they are a robust and amendable model to investigate antiviral responses of microglia.
Fig. 1
Primary murine microglial cultures express several microglia core genes and display a high degree of purity. A Schematic depiction of the generation of murine mixed glial cultures and isolation of microglia. B Immunofluorescent confocal microscopy of isolated microglia immunolabelled with Iba1 (red) and counterstained with DAPI (cyan). Objective 20x (left) or 60x (right). C Quantification of Iba1+ cells amongst live cells and GFAP+ cells (N = 3 independent microglia preparations, n = 5–6 photographs quantified). D Spectral flow cytometric analysis of immunolabeled in vitro microglia. Data of live cells of one representative preparation is shown. E Quantification of positive cells for the depicted surface markers characteristic for microglia (CX3CR1, CD11b, CD45, F4/80, CSF-1R, and P2RY12) or astrocytes (GLAST) or oligodendrocyte progenitors (O4) (n = 3 independent microglia preparations). F Bulk RNA-seq analysis of microglia cultures reveals expression of several microglia-specific genes and absence of gene expression characteristic for other CNS resident cell types (astrocytes, oligodendrocytes, and neurons). Isolated microglia were plated, harvested, and total RNA was isolated to perform RNA-seq analysis. Normalized transcript counts are depicted as mean of technical triplicates (n = 3 technical replicates)
After in vitro exposure to virus, microglia show a pronounced transcriptional shift towards inflammation and the induction of immunomodulatory genesTo better understand microglial responses to viral infection, microglia cultures were mock-treated (Fig. 1F) or they were exposed to VSV Indiana at MOI of 0.5 for 2, 4, 6, and 8 h and RNA-seq was performed. Principal component analysis (PCA) showed a clear clustering of samples from the different experimental groups, indicating substantial transcriptional changes of microglia during the course of virus infection (Fig. 2A). Among the VSV-infected samples, the 2 and 4 h samples largely segregated from each other and the other samples, whereas the separation was less dominant for the 6 and 8 h samples. This time course analysis revealed transcriptional dynamics that corresponded with early and late microglia anti-viral responses. To further investigate these changes, we performed pairwise comparison between VSV-exposed samples and the mock controls. By applying the selection criterion of log2 fold change > |2|, padj < 0.05, we identified 99, 504, 1107, and 1294 genes that were differentially expressed after 2, 4, 6, and 8 h of VSV exposure, respectively (Fig. 2B). Of these genes, 78 were commonly shared across all the time points, whereas 8, 71, 288, and 461 genes were uniquely expressed after 2, 4, 6, and 8 h of infection, respectively.
Using unbiased k-means clustering of differentially regulated genes, we identified four distinct clusters (Fig. 2C). Cluster I comprised many antiviral mediators (Ifnb, Isg15, Tnf, Zbp1, and Il1b), the RNA sensor Ddx58 (RIG-I) as well as genes that are involved in antigen presentation (Tap1 and Icosl), which were enriched from 4 hpi onwards and therefore can be annotated as early antiviral response genes. Cluster II comprised genes encoding for central antiviral factor Nfkb1, ISGs such as Oas1a, cytokines and chemokines (Il15 and Ccl4), phagocytosis receptor Fcgr1, innate immune sensors (Tlr3), factors involved in discriminating self and non-self RNA (Adar), antigen presentation and co-stimulation (H2-K1, Cd40, and Cd74) as well as immunoregulatory molecules (Ptpn2 and Nr1d1) (Fig. 2C). Since enrichment of genes in cluster II started at 6 hpi and was further enhanced at 8 hpi, cluster II can be annotated as late immune response genes. Cluster III and IV comprised genes that were de-enriched after VSV infection. Cluster III consisted of genes that are involved in the immune response (Tlr1 and Ccr5), the extracellular ATP/ADP sensor P2ry1, and factors driving cell division (Dusp7 and Setd1a), which were de-enriched from 6 hpi on. Cluster IV additionally comprised genes that are associated with immune activation (Tlr5 and Ccr3), cell cycle (Mcm4 and Prc1), remodeling of extracellular matrix (Mmp11), and metabolism (Fut7), which are genes that were de-enriched at the later time point of 8 hpi.
To substantiate the functional phenotype associated with the identified cluster-specific genes, we performed pathway analysis (p-value cut-off < 0.05) using gene ontology (GO) [34]. Cluster I exclusively expressed genes associated with defense responses against virus infection and cellular responses to IFN-β, while cluster II comprised genes involved in activation and regulation of immune responses (Fig. 2D). Notably, cluster III and IV contained genes that are implicated in methylation, RNA processing, nuclear division as well as chromosome segregation. The early response mounted around 4 hpi (cluster I) mostly focused on transcriptional activation of innate immune activating pathways, including IFN responses and preparation for antigen presentation. While most induced genes from cluster I were sustained until 8 hpi, activating as well as immunomodulatory pathways were upregulated with moderately delayed kinetics, i.e., at 6 hpi (cluster II), pointing towards regulation of the cellular response. The early downregulated gene sets (cluster III) include histone modifications, which might lead to regulation of the transcription. While immune activation dominated the transcriptional landscape of VSV-infected microglia, cell division genes ceased at the later time points, i.e., at 6 and 8 hpi (cluster IV). In conclusion, in vitro VSV-exposed microglia mount an immediate innate response characterized by a time-dependent expression of activating and immunomodulatory components as well as the reduction of their cell cycle activities.
Fig. 2
Cultured microglia respond rapidly to VSV exposure by upregulation of pro-inflammatory genes. WT in vitro microglia were isolated, plated, and either infected with VSV at an MOI of 0.5 or mock-treated (Ø). At indicated time points, microglia were harvested, and total RNA was isolated for bulk RNA-seq analysis. A Principal component analysis (PCA) of mock-treated controls (Ø) and VSV-infected microglia at indicated time points. B Venn diagram of differentially expressed genes (DEGs, log2 fold-change > │2│, padj < 0.05) between either VSV-infected at ‘2 hpi’, ‘4 hpi’, ‘6 hpi’ or ‘8 hpi’ vs. the mock-treated control. C Heatmap of k-means clustering of DEGs (log2 fold-change > │2│, padj < 0.05). Each column represents transcripts from a technical replicate. D Pathway analysis of 4 clusters visualized in the heatmap. Cluster I and II comprise genes that are upregulated after VSV infection; cluster III and IV comprise genes that are downregulated after VSV infection. n = 3 technical replicates
During in vitro VSV infection of microglia, MAVS signaling is critically needed for mounting immune responsesThe identification of GO terms that correspond to defense responses to virus infection in cluster I (Fig. 2D) prompted us to address whether VSV exposure would trigger the microglia sensome. To this end, we sorted and filtered genes based on the aforementioned GO term. This approach resulted in the identification of the ISGs Ddx58 (RIG-I), Tlr3, and Isg15 that were strongly increased in microglia after VSV exposure (Fig. 3A). Indeed, RIG-I is an important RNA sensor in the cytosol that confers signals via the adapter molecule MAVS to induce IFN responses in infected cells [36]. To assess the functional relevance of the RIG-I signaling axis on microglia during viral infection, we prepared microglia cultures from brain cortices of Mavs-deficient P3 mouse pups (hereafter denoted as “Mavs−/− microglia”) and performed RNA-seq analysis. We first addressed transcriptional dynamics of Mavs−/− microglia in response to VSV infection. In contrast to WT, cluster-specific genes corresponding to early responses were induced from 6 hpi onwards, while genes involved in chromosome segregation and innate immune responses (Tbk1, Ccl4, Il16, and Irak2) were abrogated at 8 hpi (Fig. S2A-B), indicating the induction of dysregulated responses in Mavs−/− microglia. To further explore transcriptional similarities and differences in WT and Mavs−/− microglia, we integrated WT and Mavs−/− microglia samples and performed a combinatorial analysis of the retrieved data. Following quality control, PCA revealed divergent expression profiles of WT and Mavs−/− cells during the course of VSV infection (Fig. 3B). Infected WT microglia exhibited a stronger shift in gene expression, as highlighted by PC1 accounting for 62% variance, whereas PC2 that corresponded to Mavs-deficient microglia showed 27% variance. Closer examination of the clustering of single samples showed low variation between the biological replicates, which indicated that comparison of gene signatures at different time points was possible. Interestingly, samples from mock-treated cells clustered closely together, irrespective of their genotype, suggesting that Mavs-deficiency did not significantly affect the homeostatic signature of microglia cultures (Fig. 3B). Both WT and Mavs−/− microglia exposed to VSV for 2 h clustered in close proximity to their respective mock-treated controls. Notably, there was a major transcriptional change in WT microglia at 4 hpi when compared with the respective mock-treated control. However, this phenotype was less pronounced in Mavs−/− microglia at 4 hpi indicating a delayed response. The 6 and 8 hpi samples of WT microglia clustered together along PC1, as similarly detected for Mavs−/− microglia at 6 and 8 hpi, which clustered along PC2, indicating that the major transcriptional modifications have occurred by 6 h after VSV exposure. Differential gene expression analysis revealed increased numbers of differentially expressed genes (DEGs) during the VSV infection time course and confirmed the weaker induction of gene expression of Mavs−/− microglia at 4 hpi (Fig. S2C). Notably, Mavs−/− microglia showed a stronger downregulation of genes at 8 hpi than WT microglia. Taken together, these data revealed that VSV-exposed Mavs−/− microglia mounted weaker transcriptional responses and delayed transcriptional shifts than VSV-exposed WT controls.
Fig. 3
Upon VSV exposure, MAVS is crucial for efficient activation of in vitro microglia. Microglia were isolated, plated, and were either infected with VSV at an MOI of 0.5 or mock-treated (Ø). Cells were harvested and total RNA was isolated to perform bulk RNA-seq analysis. A Normalized gene counts of Ddx58 (RIG-I), Tlr3, and Isg15 of VSV-infected or mock-treated (Ø) WT microglia. Each group contains triplicates. Each box represents interquartile range while whiskers indicate maximum and minimum values. B PCA of VSV-infected and mock-treated (Ø) WT and Mavs−/− microglia at indicated time points. C Biological processes (BP) pathway analysis of Mavs−/− vs. WT microglia exposed to VSV for 2 h, 4 h, 6 h, or 8 h in vitro reveals downregulation of pathways related to immune responses in Mavs−/− microglia. Red, upright triangles (△) represent upregulated pathways in Mavs−/− microglia while blue, down-pointing triangles (▽) represent downregulated pathways in Mavs−/− microglia in comparison to WT microglia. Triangle size represents the gene set size of the annotated pathways. D Heatmap of k-means clustering of DEGs (log2 fold-change > │2│, padj < 0.05) of Mavs−/− vs. WT microglia at 8 h post VSV infection in vitro. Each column represents transcripts from a technical replicate. n = 3 technical replicates
To investigate MAVS-dependent effects on microglia responses after virus exposure, we next performed differential gene expression analysis of VSV-infected microglia at 2, 4, 6, and 8 h of Mavs−/− versus WT microglia and categorized the functional relevance of identified genes by using gene set enrichment analysis (GSEA). This analysis revealed significant de-enrichment of GO terms implicated in innate and adaptive immune responses. Notably, at 2 hpi pathways corresponding to cytokine production, response to external stimuli, and defense response were strongly downregulated in Mavs−/− microglia (Fig. 3C). At 4 and 6 hpi, Mavs−/− microglia exhibited de-enrichment of GO terms involved in cytokine stimuli, innate immune response, and response to virus. Remarkably, GO terms associated with cytokine production, T-cell activation, and cellular response to IFN-β were downregulated in Mavs−/− microglia at 8 hpi (Fig. 3C), further underscoring the importance of MAVS in shaping both innate and adaptive immune responses of the inflamed CNS. The delayed induction and strong downregulation of GO terms associated with cellular response to IFN-β and T-cell activation in Mavs-deficient microglia prompted us to examine the nature of genes regulated at 8 h. To address this, we performed pairwise comparison of Mavs−/− versus WT microglia. By applying the same criterion of significance as above, a total of 826 DEGs were detected, which separated into 2 clusters. Cluster I corresponded to 151 genes that were enriched in Mavs−/− microglia, including genes related to cell cycle such as Dusp7 and Mdm1, genes involved in remodeling of the extracellular matrix (Mmp11), and genes involved in metabolic processes such as Fut7 (Fig. 3D). Cluster II comprised 675 genes that were de-enriched in Mavs−/− microglia and that encoding for IFNs (Ifna1 and Ifnb1), IFN signaling (Stat1), antiviral mediators (Isg15, Oas1a, and Zpb1), chemokines and cytokines (Cxcl10, Ccl4, Il6, Tnf, and Il15), PRRs (Nod1, Tlr3, Ddx58, Ifih1 [MDA5]) as well as antigen processing and presentation complexes (Fcgr1, Tap1, and Cd40).
MAVS is crucial to restrict viral replication in microglia culturesThe dysregulation of GO terms corresponding to cytokine responses in Mavs−/− microglia prompted us to probe for specific cytokine signatures influencing the phenotype. To this end, we selected all regulated cytokines and evaluated their expression levels. Comparative analysis revealed lower fold-induction of genes encoding for pro-inflammatory cytokines such as Il6, Il12b, Il1b, Il19, Tnf, Il1a, and Il27 in Mavs−/− microglia than in WT samples (Fig. 4A). This suggests that dysfunctional or delayed responses were induced in Mavs−/− microglia upon VSV exposure when compared with WT microglia. Additionally, probing for the anti-inflammatory cytokines revealed higher induction of Il10 in WT microglia than in Mavs−/− microglia upon VSV infection. On the other hand, Mavs−/− microglia showed more pronounced expression of Tgfb2 than WT microglia. Moreover, genes involved in antigen presentation (e.g., Fcgr1, Tap1, and Cd40) gradually increased over the course of infection in WT microglia, whereas in Mavs−/− microglia they remained unchanged (Fig. 4B, Fig. S2D). Considering the defective cytokine responses and impaired activation of VSV-exposed Mavs−/− microglia, we next analyzed the expression of viral genes. To this end, fastq files of VSV-infected samples were mapped onto the VSV genome. Indeed, numbers of VSV mRNAs were considerably enhanced in Mavs−/− microglia when compared with WT microglia during the course of VSV infection except for the 6 hpi timepoint (Fig. 4C). To further verify defects in viral restriction in Mavs−/− microglia, we infected microglia with VSV in vitro and evaluated viral titers in the cell-free supernatant by plaque assay. Indeed, the supernatants of Mavs−/− microglia contained higher viral loads than their WT counterparts (Fig. 4D). Infection with VSV-eGFP revealed that a significantly higher percentage of Mavs−/− microglia supported virus gene expression than WT microglia (Fig. 4E-F). Collectively, these data indicated that while WT microglia were largely resistant to VSV infection, Mavs−/− microglia showed a significantly enhanced susceptibility to virus infection. Thus, in microglia cultures MAVS is crucially involved in the restriction of VSV propagation.
Fig. 4
MAVS is needed to restrict VSV infection in microglia cultures. A Fold change (FC) of pro-inflammatory cytokine normalized gene counts upon VSV infection in WT or Mavs−/− microglia compared to mock-treated controls (Ø). Mean values of 3 technical replicates are depicted. B Normalized gene counts of Fcgr1 in VSV-infected and mock-treated (Ø) WT and Mavs-deficient microglia. Each group contains technical triplicates. Each box represents interquartile range, while whiskers indicate maximum and minimum values. C Viral transcript counts for VSV gp5 during the course of VSV infection in transcripts per million (tpm). Mean values and SD of 3 technical replicates are depicted. D Titers of infectious viral particles determined from cell-free supernatants of VSV-infected WT and Mavs−/− microglia (MOI 0.5). N = 2 independent experiments for each genotype, n = 2–3 technical replicates of each experiment. Mean with SD are depicted with individual values. E Spectral flow cytometric analysis of VSV-eGFP-infected WT and Mavs−/− microglia cultures at 8 hpi (MOI 0.5). Histogram of live, single cells of one representative preparation per genotype is shown. F Quantification of VSV-eGFP-positive cells among live, single cells of VSV-eGFP-infected WT and Mavs−/− microglia. N = 2 independent experiments for each genotype, n = 2–3 technical replicates of each experiment. Mean with SD are depicted with individual values. Statistical analyses were performed using multiple unpaired t test and asterisks indicate significant differences (**p < 0.01)
Upon intranasal VSV instillation of mice, MAVS signaling is essential for virus control in the CNSSince pathway analysis of microglia cultures revealed a functional role of MAVS in mounting antiviral defense responses and responses to IFN-β (Fig. 3C-D) and in restricting virus replication in microglia cultures (Fig. 4C-F), we next sought to investigate the role of MAVS in controlling virus dissemination within the infected CNS under in vivo conditions. Upon i.n. VSV instillation, WT mice maintained stable body weight and showed low clinical scores (Fig. 5A-B). In contrast, VSV-infected Mavs-deficient mice lost weight, developed high clinical scores, and reached a critical status that required termination of the experiment by day 6 after infection (Fig. 5A-B). To address whether excessive virus propagation was responsible for the detrimental outcome of VSV infection in Mavs−/− mice, we administered VSV-eGFP i.n. and monitored virus dissemination in the brain by fluorescence microscopy (Fig. 5C). Remarkably, in WT mice virus spread was restricted to the nasal cavity (NC) and to the glomerular layer of the olfactory bulb (OB) at 3 dpi, while at 6 dpi the virus was largely cleared from the entire OB. In contrast, in Mavs-deficient mice we observed slightly more eGFP signal in the OB at 3 dpi than in WT animals, while at 6 dpi we detected higher levels of viral neuroinvasion within the OB reaching the granular cell layer. Virus loads in different brain regions were further examined by plaque assays (Fig. 5D). 6 days following i.n. VSV infection, viral titers in the NC were similar in WT and Mavs−/− mice, indicating a comparably effective virus control within the NC. Within the CNS, Mavs-deficient mice showed significantly enhanced viral loads in almost all brain regions. In the OB and the cerebrum (CR), WT mice exhibited significantly lower viral loads than Mavs-deficient mice, whereas in the brain stem (BS) only one out of four WT mice showed elevated virus titers, while all Mavs−/− mice contained high viral loads (Fig. 5D). Interestingly, in the distal brain regions, i.e., the cerebellum (CRBL) and the spinal cord (SC), no infectious particles were detected in WT mice, whereas in Mavs−/− mice high amounts of infectious virus particles were present (Fig. 5D). Virus spread throughout the CNS in Mavs−/− mice indicates failed control of the virus infection in the NC and brain regions that are closer to the site of instillation. Infectious virus was undetectable in the lung and the liver of WT mice and could be detected only in one out of four Mavs−/− mice, which was not significant. In summary, this data shows that MAVS signaling is crucial for viral restriction and containment of the infection in the NC and proximal regions of the CNS.
Fig. 5
After intranasal VSV installation of mice, MAVS is essential for virus control and protection. A, B WT (C57BL/6) mice and Mavs-deficient mice (Mavs−/−) were instilled with 1000 PFU VSV intranasally and (A) body weight and (B) clinical score were monitored (n = 8–9). C Whole head sections of WT or Mavs−/− mice i.n. infected with VSV-eGFP (1000 PFU) for 3 or 6 days. 16–20 μm thick sections were counterstained with DAPI (AxioScan, objective 10X, stitched image). Zoom shows the intersection of the nasal cavity (NC) to the olfactory bulb (OB). Arrows indicate invasion of VSV-eGFP in the glomerular layer (➤) and the granular cell layer (➞) of the OB (n = 3). D Titers of infectious viral particles determined from homogenized brain tissues from VSV-infected mice (WT and Mavs−/−, 1000 PFU) show higher infiltration of VSV in more distal regions than the OB in Mavs-deficient mice. NC, nasal cavity, OB, olfactory bulb; CR, cerebrum; CRBL, cerebellum; BS, brainstem; SC, spinal cord (n = 4). (A, B) Log-rank (Mantel Cox) test, (D) Unpaired t-test. *p < 0.05, ***p < 0.001, ****p < 0.0001, ns = not significant
Highly activated non-microglial myeloid cells infiltrate the OB of Mavs-deficient mice upon i.n. VSV infectionWe next analyzed myeloid cell responses in the OB of WT and Mavs−/− mice. To differentiate between infiltrating myeloid cells and CNS-resident microglia, we used P2RY12 as a reliable and specific marker of microglia [35, 37,38,39,40,41]. While P2RY12 may be diminished under inflammatory conditions [38], its expression is still sufficient for differentiation of infiltrating myeloid cells and microglia, even under inflammatory conditions after virus infection [21, 42]. P2RY12 is selectively expressed in activated platelets [43] and in microglia in the brain [35, 44]. Importantly, macrophages and monocytes express low to undetectable levels of P2RY12 [45, 46]. To further define bone-marrow-derived infiltrating myeloid cells, we analyzed Mac-2 as a well-characterized marker that often is used in transcriptomic and protein analyses [47]. We first confirmed absence of Mac-2 in the vast majority of P2RY12+ cells at day 6 post i.n. VSV infection confirming the adequacy of P2RY12 labeling for discrimination of microglia and infiltrating myeloid cells (Fig. S3A). Secondly, we observed no significant decline in P2ry12 expression levels in the OB bulk RNA in WT and Mavs−/− mice during the course of infection, as determined at day 2, 4, and 6 post i.n. VSV infection, indicating overall rather stable P2ry12 expression (Fig. S3B). OBs from uninfected WT and Mavs−/− mice contained similar numbers of Iba1+ myeloid cells, which increased at day 6 post i.n. VSV infection, with a stronger increase in Mavs−/− than in WT mice (Fig. 6A-B, Fig. S3C). We next aimed to determine whether this increase was mediated by the proliferation of resident microglia within the CNS or by enhanced infiltration with myeloid cells. In uninfected mice, myeloid cells were primarily microglia as indicated by their Iba1+ and P2RY12+ status (Fig. 6C and Fig. S3C). Their abundance increased similarly in WT and in Mavs−/− animals at day 6 post infection. While in the OB of uninfected mice Iba1+ P2RY12− cells were absent, these cells were detected in the OB of WT and Mavs−/− mice on 6 dpi, whereas overall numbers of these cells were significantly higher in Mavs−/− mice (Fig. 6A and D). All significant changes occurred at day 6 post VSV infection, while at 4 dpi numbers were not significantly different in infected mice and controls, further highlighting the peak of myeloid cell infiltration at 6 dpi in the glomerular layer of the OB. Thus, while Iba1+ P2RY12+ microglia numbers increased similarly in WT and Mavs-deficient mice by day 6 post VSV infection, infiltration with Iba1+ P2RY12− myeloid cells into the infected OB was exacerbated in the absence of Mavs.
To investigate the activation status of myeloid cells in the OB, we assessed Mac-3 expression. Under homeostatic conditions, the activation marker Mac-3 was not detectable in the OB, neither of WT nor Mavs−/− mice (Fig. S3B and Fig. 6E). In contrast, at 6 days post VSV infection, Mac-3 expression was induced on Iba1+ myeloid cells in the OB of WT and Mavs−/− mice, while the Mac-3 induction detected in Mavs−/− mice was stronger than in WT controls (Fig. 6A and E). Interestingly, while no statistical difference of Iba1+ P2RY12+ cells expressing Mac-3 in the OB of WT and Mavs-deficient mice was detected upon VSV infection, Iba1+ P2RY12− myeloid cells showing Mac-3 expression were strongly enhanced in Mavs-deficient mice (Fig. 6A and F-G). Thus, absence of MAVS signaling leads to increased infiltration of the OB with Iba1+ P2RY12− non-microglia myeloid cells that show an enhanced inflammatory phenotype.
Following up on the defective cytokine responses in Mavs-deficient microglia cultures, we profiled pro-inflammatory cytokines in the NC as well as in several CNS regions on day 6 after infection. In the NC, several cytokines including IL-1α, IFN-γ, and MCP-1 were detected in WT and Mavs−/− mice, which were higher in Mavs-deficient animals (Fig. 6H). Similarly, in the OB of Mavs-deficient mice IFN-γ, MCP-1, IL-6, and IFN-β were detected at higher levels than in WT mice. In the BS and the CRBL, none of the analyzed cytokines was detected in WT mice, whereas Mavs-deficient mice had high levels of IFN-γ, MCP-1, and IL-6 in these brain regions. Inspired by the in vitro transcriptomic data, we next profiled Fcgr1 transcript levels in the OB of WT and Mavs-deficient animals upon i.n. VSV infection. In line with the in vitro data, Fcgr1 levels increased between 4 and 6 dpi in WT animals, while in Mavs-deficient mice this increase was less pronounced (Fig. 6I). Thus, the CNS of VSV-infected Mavs-deficient mice is excessively inflamed as indicated by the presence of highly activated infiltrating non-microglial myeloid cells and profound levels of pro-inflammatory cytokines, while expression of important mediators of the immune response such as Fcgr1 are not potently induced.
Fig. 6
Exacerbated and ineffective inflammatory responses are induced in the brain of VSV-infected Mavs−/− mice. WT or Mavs−/− mice were i.n. infected with VSV (1000 PFU) for 4 or 6 days prior to organ collection. A-G 7 μm thick brain sections from VSV-infected WT or Mavs−/− mice were immunolabeled for Iba1, P2RY12, and Mac-3, and counterstained with DAPI. Confocal immunofluorescence microscopy was performed. A Representative images of the OB show more pronounced increase of Iba1+ P2RY12− Mac-3+ cells in Mavs−/− mice 6 days after VSV infection (Olympus Fluoview 3000, objective 20x, stitched image). B-D Quantification of (B) Iba1+, (C) Iba1+ P2RY12+, and (D) Iba1+ P2RY12− cells in the glomerular layer of the OB at 6 dpi. E-G Quantification of (E) Iba1+ Mac-3+, (F) Iba1+ P2RY12+ Mac-3+, and (G) Iba1+ P2RY12− Mac-3+ cells per mm2 of the glomerular layer of the OB at 6 dpi (N = 1–2, n = 4–7, mean values and SD depicted). H Quantification of cytokines (ng cytokine / g tissue) in homogenates of the NC, OB, BS, and CRBL from VSV-infected WT and Mavs−/− mice at day 6 post infection (n = 4, mean values). I Fold change (FC) of Fcgr1 transcripts in the OB as determined by RT-qPCR at day 2, 4, and 6 days post i.n. VSV infection (1000 PFU) compared to uninfected controls (N = 1, n = 2–3). (B-G) Ordinary one-way ANOVA. (I) Unpaired t-test. **p < 0.01, ***p < 0.001, ****p < 0.0001, ns = not significant
Comments (0)