
Remember me


The data used for model development and validation were obtained from a clinical trial conducted at Tangdu Hospital and Xi’an Gaoxin Hospital, which was approved by the hospital’s Ethics Committee. The clinical trial registration number is ChiCTR2200061310. A total of 120 patients were enrolled in the trial, and all participants signed the informed consent form. The patient criteria are as follows, and their details are presented in Table 1.
Table 1 Basic information of the 120 patientsThe inclusion criteria for patients were as follows: (1) stroke confirmed by CT or MRI; (2) aged between 30 and 75 years; (3) stable recovery with motor dysfunction caused by stroke, 15–180 days after onset (convalescent period), with Brunnstrom upper extremity and/or lower extremity motor function grades II‒VI; (4) ability to follow the research protocol; and (5) ability to understand the study’s purpose, adhere to the protocol, and provide informed consent.
The exclusion criteria for patients were as follows: (1) patients with significant cognitive or consciousness disorders that would prevent completion of the FMA; (2) patients with other major limb injuries, such as fractures, severe arthritis, amputations, etc.; (3) patients with joint contractures; (4) patients with disabilities as defined by law (e.g., blindness, deafness, mutism, intellectual disabilities, mental disorders, and physical disabilities); and (5) patients with severe comorbidities that were deemed unsuitable for participation by the researcher.
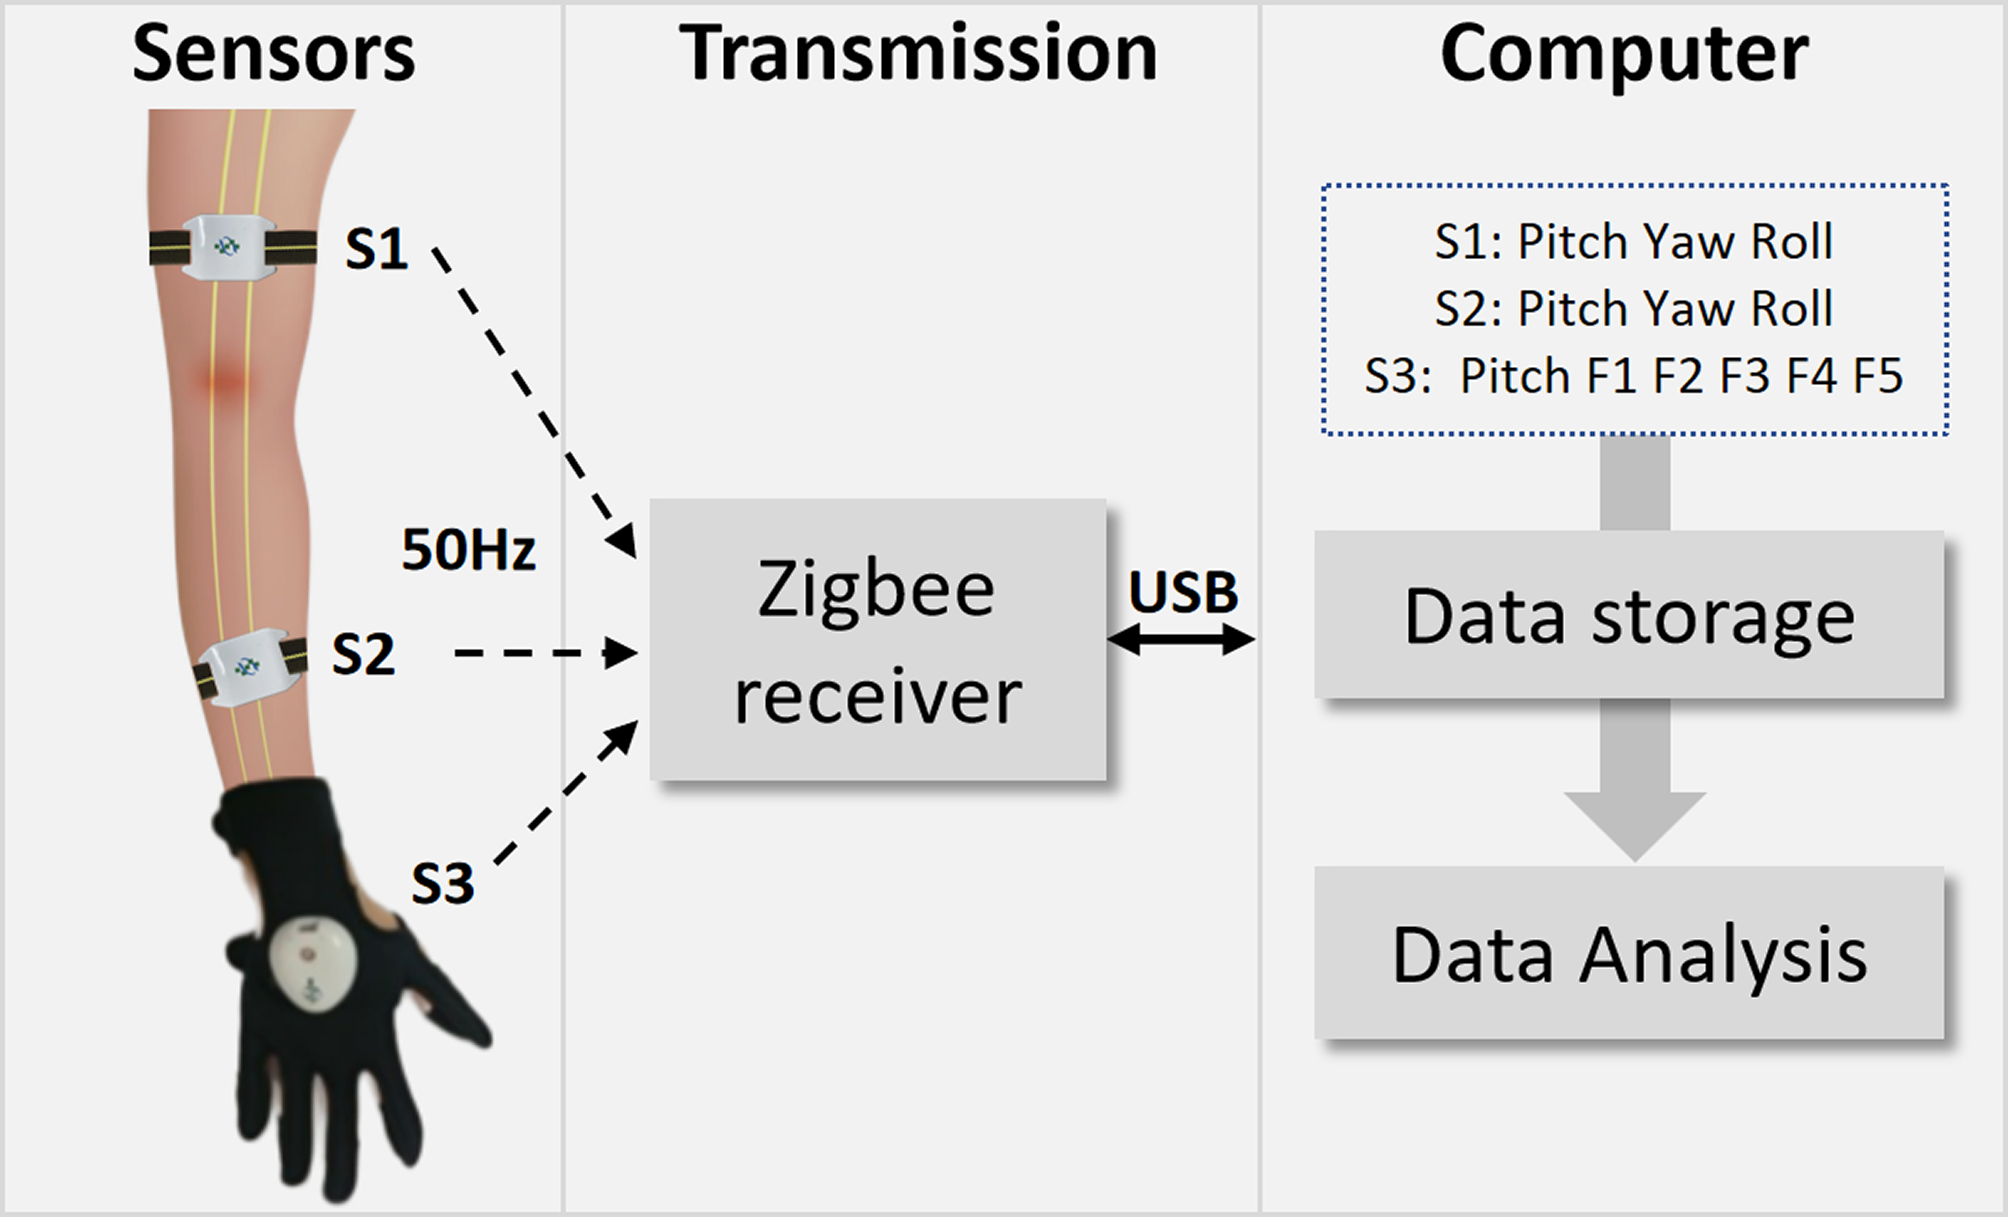
Data collection protocolData collection devicesThe collection system consists of wearable devices and a computer, as shown in Fig. 1. The wearable devices include two rehabilitation armbands and one rehabilitation glove. The armbands were equipped with IMUs. The IMUs were constructed via the MPU9250 chip (InvenSense, “America”). The IMU accelerometer featured a measurement range of ± 2 g, the IMU gyroscope offered 16-bit resolution with a range of ± 250°/s, and the IMU magnetometer had 14-bit resolution with a range of ± 4800 µT. Through chip computation, the output signals are Pitch, Yaw, and Roll, which represent the sensor orientation as follows: Yaw indicates rotation about the vertical axis, Pitch indicates rotation about the horizontal transverse axis, and Roll indicates rotation about the longitudinal axis. Therefore, they can reflect the rotational state of the body in three-dimensional space and are commonly used to describe the range of motion and angles of joints and arms. The glove was equipped with piezoresistive bending sensors and IMUs positioned at the back of the five fingers and the dorsum of the hand, respectively. The piezoresistive sensors monitor finger flexion, and the IMUs track wrist movements. The piezoresistive sensors exhibit a resistance of 25 kΩ at 180° in a stationary state and 125 kΩ at 90° at full bending. The output signals for the glove are the flexion signals of five fingers (F1–F5) and the pitch of the hand. The sampling rate of the aforementioned sensors is 50 Hz.
The rehabilitation armbands are worn on the upper arm (S1) and forearm (S2) on the hemiplegic side. The rehabilitation glove is worn directly on the hemiplegic hand (S3). The ZigBee protocol was chosen for wireless transmission, which meets the requirements of high fault tolerance and low cost. The ZigBee receiver can receive signals from the sensors in real time and store them on a personal computer, which handles data storage and performs signal analysis.
Fig. 1
The data collection devices for the experiment
Actions for data collectionThe upper extremity Fugl-Meyer assessment (UE-FMA) subscale includes 33 actions for assessment (items 1 to 33), with scores of 0, 1, or 2, where 0 indicates the inability to perform the action, 1 indicates partial completion, and 2 indicates smooth execution. Since all patients included in our study were at Brunnstrom Stage II-VI (Patients in the stage I are unable to complete the clinical trial due to physical reasons), they exhibited reflex abilities and thus scored full marks for reflex-related actions during data collection. Therefore, we excluded three reflex-related actions (Original items 1, 2, and 18). The original item 26 is a grip strength test that requires a force sensor for data collection; therefore, this item was excluded. Items 31 to 33 assess different aspects of the same action. Thus, we retained item 31 and removed items 32 and 33. In total, after excluding the six items mentioned above, we retained 27 items with 27 different actions, for which motion data were collected during the execution of these 27 assessment tasks. A description of these 27 actions is provided in Table 2.
Table 2 The description of the 27 actionsData Collection ProcedureOnce the patient was ready, the physical therapist guided the patient to wear the wearable devices and powered them on. Each action was performed 3–5 times. The therapist then instructed the patient to perform the 27 actions sequentially. The physical therapist used a timer to record the start and end times for each stable action performed by the patient, ensuring a timing error of no more than 0.5 s. During this process, the physical therapist scored each action on the basis of the standardized assessment criteria. Moreover, the wearable devices captured the patient’s motion signals in real time, transmitted them to a wireless receiver via the ZigBee protocol, and saved them on a computer.
The enrolled subjects participated in two data collection sessions, the first at baseline and the second at discharge, which occurred 3 weeks after the baseline assessment. All 120 patients participated in the first data collection session, resulting in 120 samples. For the second data collection session, 3 weeks later, a few patients were missing, resulting in 102 samples, resulting in 222 total collected samples. Each sample consists of data from 27 actions. The data for each action can be represented as X∈R12×N, where 12 represents the number of signals and N represents the signal length.
Signal processingPreprocessing consists of the following steps, as shown in Fig. 2. The first step is the segmentation of valid signals, which aims to identify and isolate the relevant signal segments. During the data collection, the therapist used a timer to record the time points of the patient’s stable actions. The valid signals are then segmented by matching the recorded starting point and end point with the sampling points collected by the wearable device.
The second step is filtering and sampling. A digital Butterworth bandstop filter was applied to eliminate power frequency interference, with a cutoff frequency of 50 Hz and a stopband gain of -40 dB. A moving average filter was used to remove random noise, with a filter width set to 10. Owing to the varying speeds of movements across patients, the length of valid signals also varies. Linear sampling was applied to resample the segmented data, and the signal length was fixed to 300 to meet the requirements of subsequent deep learning algorithms. The choice of a fixed length of 300 was based on two factors: first, the deep learning algorithm (RNN) requires inputs of uniform length, and second, the average signal length was approximately 300. Then, the resampled signals undergo zero-mean normalization, where the mean of the data is subtracted, centering the data around zero.
The third step addresses handling missing signals. Data collection was performed entirely by the therapist, with no involvement of engineering personnel. Occasionally, the therapist made operational errors, leading to the absence of certain signals for some patients (approximately 2% missing, with at most one missing action for one patient). The procedure for handling missing signals is as follows: for the i-th sample where the j-th movement signal is missing and its movement score label is s (where s = 0,1,2), one-tenth of the samples with the same label s and no missing signals are randomly selected. The mean of the missing signal is then computed from the selected samples, and the original missing value is replaced by this mean.
Fig. 2
The pipeline of data preprocessing
Upper extremity assessment algorithmFig. 3
The pipeline of building the upper extremity rehabilitation evaluation models
The process of constructing the UE rehabilitation assessment algorithm on the basis of motion signals is shown in Fig. 3. First, 27 GRU networks were developed, one for individual actions, to generate individual scores. These scores were then summed to calculate the total upper score. Subsequently, arm-related scores were extracted and used with a tree-based model for arm Brunnstrom stage prediction and hand-related scores were utilized for hand Brunnstrom stage prediction.
Scoring models for the UE-FMA subscaleEach item in the UE-FMA subscale represents specific motor functions, with motion signals differing in components. We utilized the GRU network, a variant of the traditional RNN, to build individual scoring models for each item. The GRU network comprises multiple GRU units, which offer a simpler architecture than conventional LSTM units do while effectively capturing long-term dependencies in sequential data. The input to the network is a preprocessed signal sample X∈R12×300=, where each timestamp xi represents a feature vector. The hidden state at the final timestamp is passed through a fully connected layer and a Softmax layer to produce the output—the item score. We constructed 27 GRU networks, one for each item, resulting in 27 outputs. The sum of these outputs provides the total score for the UE-FMA subscale.
The GRU network employs a bidirectional approach, processing signals in both forward and backward directions to comprehensively capture temporal dependencies. Owing to the uneven distribution of stages among the 120 patients, a large proportion of scores were clustered around 0 and 1, resulting in data imbalance. To address this issue, we implemented a data balancing strategy during model training. Specifically, we used upsampling of the minority classes in the training set to achieve a more balanced data distribution across all categories. In this process, we replicated samples from the underrepresented classes to increase their frequency, ensuring that each class contributed more equally to the training process. Additionally, we applied a random sampling technique where the samples in the minority classes were randomly selected with replacement until the class distribution approached that of the majority class. To avoid overfitting, we also monitored the performance on the validation set and adjusted the upsampling strategy as necessary. By doing so, we aimed to improve the model’s ability to generalize and reduce the bias toward the majority classes.
Prediction models for the arm and hand brunnstrom stageIntrinsic correlations exist between various motor function scales [36]. Considering the intrinsic correlations between the FMA and Brunnstrom stage, we used the scores from the 27 items in the UE-FMA to predict the Brunnstrom stage of the arm and hand.
22 arm-related items and 8 hand-related items were identified out of the 27 actions. For arm Brunnstrom stage prediction models, we used the scores of these 22 items and their total score, totaling 23 features, to build the prediction model. For hand Brunnstrom stage prediction models, we used the scores of the 8 items and their total score, totaling 9 features, to build the prediction model. Considering the large number of features, we applied principal component analysis (PCA) for dimensionality reduction. The final feature dimensions were reduced to six.
The random forest (RF) and extremely randomized tree (ERT) algorithms were employed to build the prediction models. Both algorithms use multiple decision trees to form the model and combine their outputs for final predictions. They can be used for classification and regression tasks and perform well on nonlinear problems. The RF performs sampling with replacement and feature selection randomization, selecting the best split point at each node, resulting in lower bias but higher computational cost. In contrast, ERT do not sample the data, but use the entire dataset and randomly select split points. They exhibit slightly higher bias but lower variance, faster training speed, and better resistance to overfitting. The model uses the above features as inputs and outputs the Brunnstrom stage.
Model establishment and validationThe data were split into training and testing datasets at a 3:1 ratio. The GRU networks were built and trained via PyTorch 2.1.2. The RF and ERT models were built via Scikit-learn. The model hyperparameters are shown in Table 3.
Table 3 The hyperparameters when building the modelsThe accuracy, recall, precision, and F1 score were employed to evaluate the performance of the individual movement scoring model; the coefficient of determination (R2) and root mean square error (RMSE) were used to evaluate the performance of the scoring models for the UE-FMA subscale; and the accuracy, recall, precision, F1 score, and Spearman correlation were used to evaluate the performance of the prediction model for the arm & hand Brunnstrom stage.
Accuracy (Ac) refers to the proportion of correctly predicted samples to the total number of samples. Recall (Re) refers to the proportion of samples correctly predicted as positive cases to the total number of actual positive cases. Precision (Pr) refers to the proportion of samples correctly predicted as positive cases to the total number of predicted positive cases. The F1 score is the harmonic mean of precision and recall and is used to provide a balanced evaluation of the performance of classification models. The coefficient of determination (R²) indicates the degree of fit of the model to the observed data. The root mean square error (RMSE) represents the average deviation between the observed values and the values predicted by the model. Spearman correlation is a nonparametric measure of the strength and direction of association between two ranked variables. Pearson correlation requires data to be continuous, linear, and normally distributed, whereas Spearman correlation is based on ranks and is suitable for nonnormally distributed data, particularly when the relationship is nonlinear or when the data are ordinal. Since the Brunnstrom stage is noncontinuous, have ranking features, and is typically ordinal, Spearman correlation is more appropriate for measuring the strength and direction of the relationship between the predicted and true Brunnstrom stage values.
Comments (0)