
Remember me


Potential participants were recruited from an outpatient stroke rehabilitation clinic at Samsung Medical Center in Seoul, Republic of Korea, between March 2022 and August 2022. Participants who signed the informed consent form for the study were screened by a rehabilitation medicine specialist to ensure their eligibility according to the study’s inclusion criteria. The final analysis included 24 participants (18 men; mean age, 57.3 ± 14.2 years) out of the original 28 who had initially given their consent (Supplementary Fig. 1). This exclusion occurred because two participants failed to meet the inclusion criteria, one withdrew consent before the experiment, and another discontinued the intervention. Among the participants who completed the study, a significant difference in stroke type was observed between the groups. However, no significant differences were observed in other characteristics, such as age, sex, time since stroke onset, lesion side, or initial FMA-UE scores (Table 1).
Table 1 Demographic characteristics of the participantsThe study recruited participants aged between 19 and 80 years who had experienced a stroke at least three months before their enrollment. To be eligible, participants were required to have a unilateral lesion, excluding those in the M1 and the aIPS, which are the areas of stimulation. Furthermore, they were required to demonstrate moderate to severe impairment in upper extremity function, as determined by a Fugl–Meyer assessment for upper extremity (FMA-UE) score of less than 58 [21]. Exclusion criteria for the study were as follows: participants with significant neurological conditions other than stroke; individuals with major psychiatric disorders, such as schizophrenia or bipolar disorder; and those with cognitive impairments that could impede participation in the study were excluded. Participants who had received botulinum toxin injections or nerve block procedures within 6 months before consenting, or who had undergone surgical treatment for the peripheral nerves, muscles, or tendons of the upper limb, were also excluded. Furthermore, individuals deemed unsuitable for tDCS due to having implanted electronic medical devices (e.g., pacemakers), metal objects in the skull, skin lesions at the attachment site, or being pregnant or breastfeeding were excluded [22]. This study was conducted by the Declaration of Helsinki and was approved by the Institutional Review Board (IRB) of Samsung Medical Center, Seoul, Republic of Korea (IRB No. 2021-07-176), and was registered at ClinicalTrials.gov (NCT05275114).
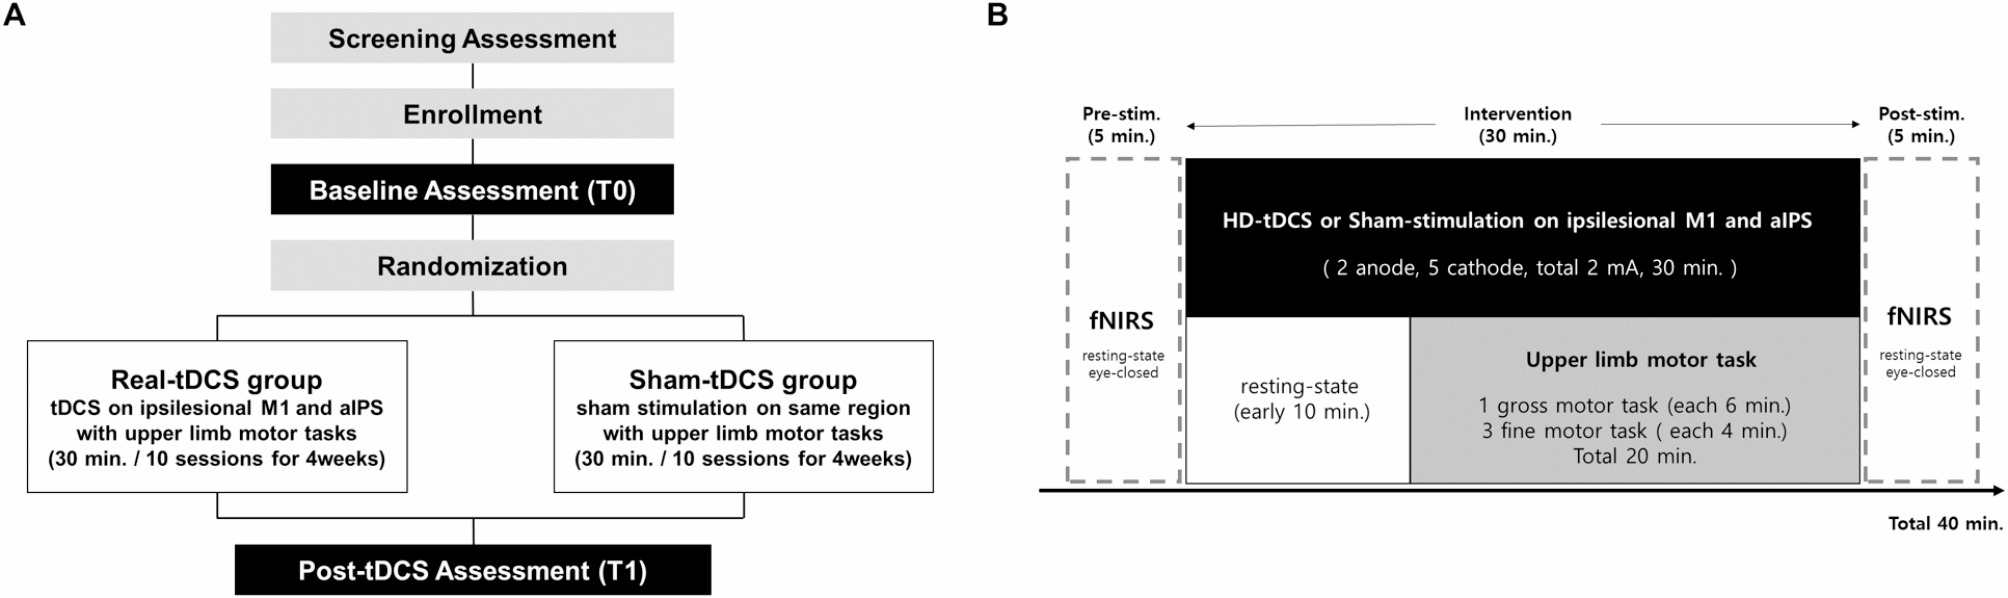
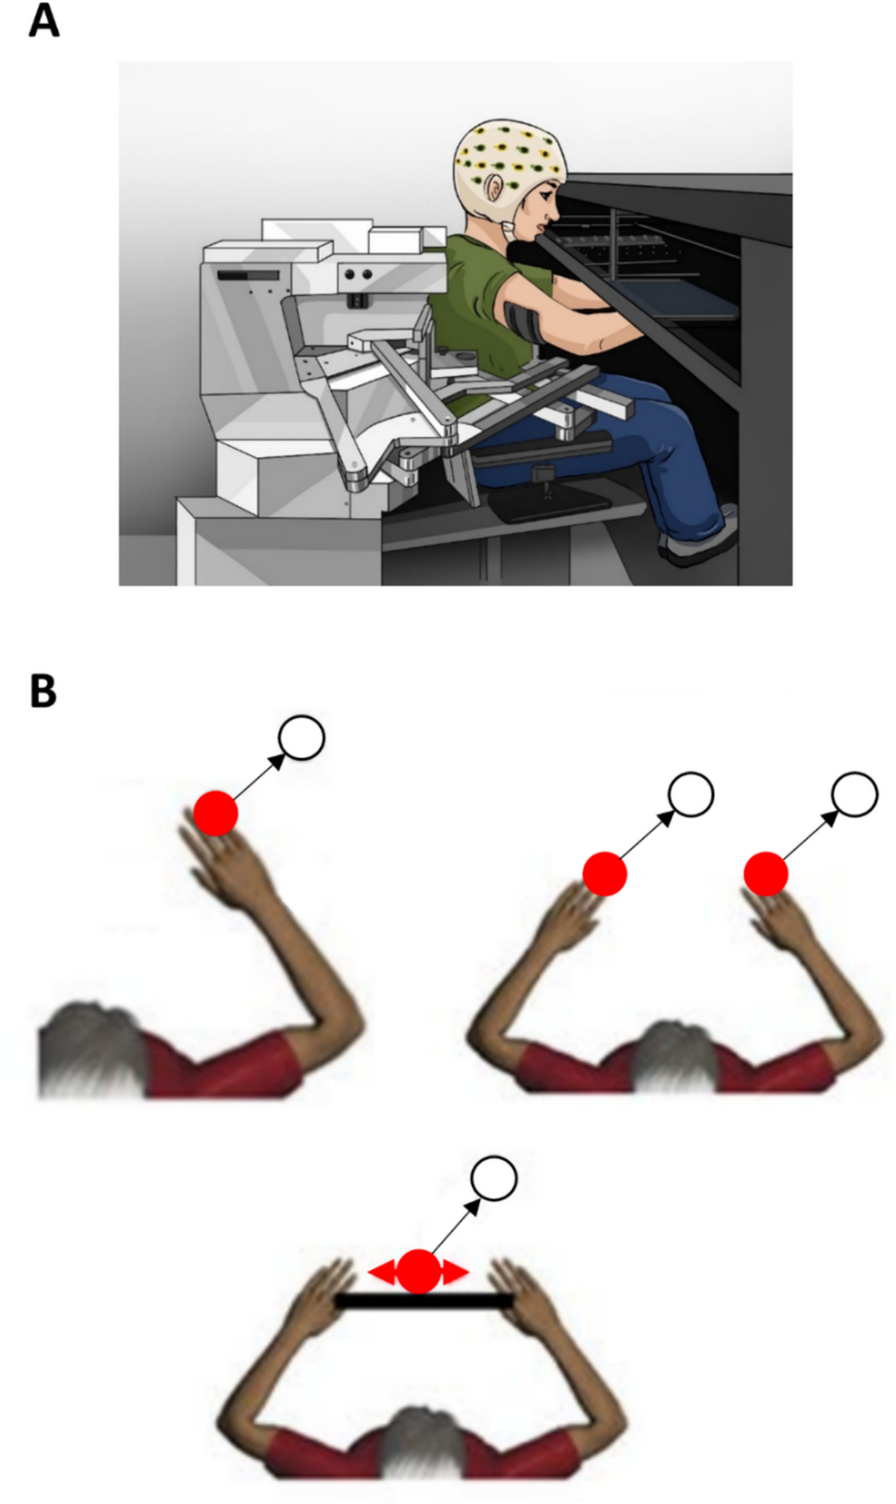
Study designThis study was designed as a single-center, double-blind, randomized, sham-controlled trial. Enrolled participants were randomly assigned to either the real-tDCS group or the sham-tDCS group using a predetermined randomization table, maintaining a 1:1 allocation ratio (Fig. 1A). Each participant engaged in upper limb motor exercises while receiving multi-channel tDCS aimed at activating the ipsilesional M1 and aIPS areas, as per the assigned tDCS condition. The intervention was administered once daily for 30 min, up to three times a week, for a total of 10 sessions over four weeks. For the initial 10 min of the 30-minute intervention period, only tDCS was applied, followed by a combination of tDCS and upper limb motor exercises for the remaining 20 min (Fig. 1B). The exercises included one gross motor task (such as the figure-8 exercise, shoulder arc ROM exercise, or stacking cones) for 6 min, followed by three fine motor tasks (such as picking up small objects, using a pinch clip, writing, card turning, the Purdue pegboard task, or putty-exercise) for 4 min each, totaling 20 min. Tasks were tailored to the participant’s functional level by a licensed physical therapist. To evaluate changes in regional hemodynamic responses to multi-channel tDCS, fNIRS measurements were conducted for 5 min before and after each intervention session, with participants in an eyes-closed resting state. Upper limb functional assessments were conducted before (T0) the intervention commenced and after completing all 10 interventions (T1) to evaluate the improvement in upper limb function.
Fig. 1
(A) Study design (B) Intervention protocol. Each intervention entailed a total of 30 min of multi-channel tDCS application, starting with 10 min of resting-state stimulation followed by 20 min of upper limb motor tasks alongside continued stimulation. fNIRS measurements were conducted during an eyes-closed resting state for 5 min before and after each intervention
Integrated multi-channel tDCS and fNIRS deviceIn this study, the NT Brain 100 device (CyberMedic Co., Ltd., Republic of Korea) was utilized to administer multi-channel tDCS and measure fNIRS (Supplementary Fig. 2). The device is equipped with an electrode for delivering electrical current, along with a light-emitting diode and photodetector integrated within a compact probe measuring 24(W) × 24(D) × 39(H) mm, specifically designed for measuring cerebral hemodynamic responses. This integrated system facilitates targeted stimulation and precise measurement of brain regions, streamlining the modulation and assessment of cerebral activity and vascular changes. Figure 2A illustrates the integrated multi-channel tDCS and fNIRS system attached to a participant’s head, along with a sample tDCS-fNIRS module (Fig. 2B), including a connector for data acquisition, a tDCS electrode, and an fNIRS source/detector fiber tip. Each module was secured to the head using a custom-designed cap, positioned according to the 10–20 system for optimal placement. The cap’s modular holder contains a soaked sponge to facilitate the conduction of electrical current from the tDCS electrode at the electrode-skin interface. Additionally, the module’s fiber tip is designed to be retractable, ensuring proper contact with the skin for precise measurements.
Fig. 2
Integrated multi-channel transcranial direct current stimulation and functional near-infrared spectroscopy (fNIRS) system. (A) Participants wearing the integrated device. (B) Close-up view of an multi-channel tDCS-fNIRS module. The integrated module comprises a pair of fNIRS optodes (one source and one detector) and a tDCS electrode. The tDCS electrode, coupled with a saline-soaked, ring-shaped sponge, administers current to the scalp. A rubber guide encircles the sponge, ensuring its stable placement. (C) Layout of the multi-channel tDCS-fNIRS system on the head. The system configuration is composed of 32 integrated modules, each containing two anodes and five cathodes for multi-channel tDCS, along with 16 sources and 16 detectors forming 51 fNIRS measurement channels. (D) Simulation results demonstrate the distribution of the normal electric field component (V/m) during multi-channel tDCS application using a standard anatomical template. The simulation was performed using the Neurophet tES LAB software (Neurophet, Seoul, South Korea). Red circles represent anodes, and blue circles represent cathodes. The positive values represent the inward electric field relative to the cortical surface, while negative values represent the outward electric field. The electric field concentration is notably strong around the M1 and aIPS regions, aligning with the anode placements
Multi-channel tDCS administrationIn this study, the ipsilesional M1 and aIPS were identified as primary targets for multi-channel tDCS, aiming to enhance upper limb recovery in patients with stroke. The hand area of M1, adjacent to C1 in the left hemisphere [23], has been a focal point in previous tDCS studies due to its essential role in motor recovery [3]. Moreover, prior research has demonstrated the aIPS, situated near CP1 in the left hemisphere, is significantly associated with motor function recovery [12, 24]. Multi-channel tDCS precisely targeted the specified areas using seven ring-shaped electrodes, each with a diameter of 2 cm. In participants with left-sided lesions, anodal stimulation was applied at C1 and CP1, each receiving 1.0 mA. The arrangement also included cathodal electrodes placed around these anodal points with varying intensities: C1 and CP1 each receiving 1.0 mA for anodal stimulation; and for cathodal stimulation, Cz at − 0.95 mA, FC3 at − 0.25 mA, CPz at − 0.40 mA, CP5 at − 0.05 mA, and P3 at − 0.35 mA (Fig. 2C, D). For right-sided lesions, electrode placement was symmetrically adjusted to ensure an equal distribution of the total current from the anodal electrodes among the cathodes. The surface area of each electrode was 2.55 cm², resulting in a current density of 0.392 mA/cm² at 1 mA, a level deemed safe by previous studies [25]. To enhance participant comfort and safety, the stimulation included a 30-s ramping up and down period at the beginning and end.
For the sham-tDCS group, the procedure mimicked actual stimulation with 30 s ramping up and down periods. However, after the ramp-up and ramp-down phases, the device was turned off, ensuring that no active current was delivered for the duration of the session. This method simulated the sensation of stimulation without delivering active current, a common technique in tDCS research to ensure blinding and control for placebo effects [26].
fNIRS measurementThe fNIRS measurement setup in this study comprised 32 modules placed over the frontal, motor, and parietal areas of the brain (Fig. 2C). Continuous-wave fNIRS monitoring was employed, using light-emitting diodes alternating between 780 nm and 850 nm wavelengths at an output power of less than 2 mW. Light intensity changes were detected using a silicon photomultiplier. In each module, the source and detector fibers were positioned 5 mm apart, constituting short-separation channels designed for recording scalp and skin hemodynamic interference. Far channels were formed from source-detector pairs from neighboring modules. Among the modules, 16 served as sources and the remaining 16 as detectors for far channels, establishing 51 far channels through nearest module source-detector pairings. Data acquisition was conducted at a sampling rate of 1.58 Hz. During measurements, participants were instructed to sit comfortably in a chair with their eyes closed for 5 min before and after each intervention session.
fNIRS preprocessing and analysisHOMER software was used for fNIRS processing, which involved converting intensity changes to optical density changes and resolving relative HbO and Hb changes in the short- and far-separation channels [27]. Each channel was detrended by subtracting the mean of the data set from all points. The channel was then bandpass filtered using frequencies ranging from 0.01 to 0.1 Hz. Motion artifacts in individual channels were corrected using the hmrMotionCorrectWavelet function in HOMER (interquartile range [IQR] = 0.75) [28,29,30]. The influence of superficial hemodynamics was minimized by regressing the data collected from the short-separation channel within each module from the nearest neighboring far channel. The nearest-neighbor approach reportedly removes superficial signals more effectively due to inhomogeneous systemic interference [31]. Individual channels were rejected due to excessively high or low standard deviation (i.e. >95% or < 5% percentile of all channels’ standard deviation). Due to the high intertrial variability of tDCS, the analysis was performed by averaging the hemodynamic changes across 10 trials for each participant to reduce individual-trial noise, such as tDCS stimulation setting, circadian rhythms, psychological and physiological conditions, and the variability of the injured brain [32, 33].
Channel data were aligned among all participants to generate lesion and nonlesion channels for group analysis.
DOT images were analyzed using a sensitivity matrix calculated using AtlasViewer [34]. Anatomically guided image reconstruction was performed using the Colin27 MRI template, and modules were anchored to specific 10 − 20 positions. Linear DOT images were analyzed using spatially variant regularization [35]. For further anatomical localization, each DOT image was divided into three regions (frontal, motor, and parietal) on both lesion and nonlesion sides. By translating the 10–20 position to the Brodmann area (BA), the frontal, motor, and parietal regions were identified to encompass BA-8, BA-4, and 6, and BA-5, 39, and 40, respectively [36].
HbOAcc and HbAcc were employed to measure the resting-state net change in cerebral oxygenation by integrating the time-series data of HbO and Hb. The numerical integration of the time series was conducted using the trapz function in MATLAB (MathWorks, Natick, MA). This function approximates the area under the curve of time-series data by dividing the signal into trapezoids and summing their areas [37]. The integration of time series hemodynamics has been used to quantify sustained hemodynamics during clinical procedures and to distnguish between rest and task states [38,39,40]. Supplementary Fig. 3 illustrates an example of HbOAcc calculation for the first 60 s of patient data. According to Fig. 3A, a substantial decrease in HbO led to a net decrease in HbOAcc during this period; according to Fig. 3B, an increase in HbO led to a net increase in HbOAcc. Hence, HbOAcc and HbAcc calculations are potentially useful in assessing net changes of resting-state cerebral hemodynamic responses to tDCS.
Fig. 3
T-maps of significant changes of (A) accumulated HbO and (B) accumulated Hb changes from prestimulation to poststimulation for real-tDCS (left) and sham-tDCS (right) participant groups
Additionally, to compare pre and post-HbOAcc and HbAcc, a two-sided t-tail test was conducted for each vertex in the DOT group, encompassing all real and sham participants. The t-values were assigned to vertices to create a t-map, highlighting significant areas of hemodynamic accumulation. Seeded connectivity networks were also calculated as an additional method for assessing resting-state hemodynamic changes. As discussed earlier, six regions of interest (ROIs) were formed based on BA position. Within each ROI, the average of resting-state time-series fluctuations was calculated to derive the seed signal. Subsequently, the Pearson correlation coefficient of the seed signal and every vertex in the DOT brain was calculated to generate seeded connectivity networks.
Upper limb functional assessments and neurophysiological assessmentFunctional motor changes were assessed using the Fugl–Meyer Assessment for Upper Extremity (FMA-UE), which has a score range of 0–66. The FMA-UE is a comprehensive and quantitative tool for assessing motor function, widely acknowledged for its effectiveness in evaluating motor recovery in patients with stroke [41]. To assess gross motor function, the Box and Block Test (BBT) was employed. This test measures the ability to transport blocks from one compartment to another within 60 s [42]. Finger dexterity was assessed using a nine-hole pegboard test, which measures the time taken for a patient to insert pegs into all holes on the board [43]. Grip strength and tip-pinch strength measurements were conducted to determine the maximum force exerted by a patient’s forearm and fingertips, respectively [44]. In addition, fine motor control was further assessed using the Sequential Finger Tapping Test (SFTT), which evaluates the speed and accuracy of sequential finger movements [9]. Overall hand function was assessed through the Jebsen-Taylor Hand Function Test (JTHFT), which involves a series of tasks mimicking everyday hand activities [45]. Furthermore, Motor Evoked Potential (MEP) measurements were performed to evaluate neurophysiological responses, providing insight into corticospinal excitability and motor pathway integrity [46]. These functional tests have been validated as accurate methods for assessing motor function improvement in patients with stroke undergoing tDCS interventions [47, 48].
Statistical analysisStatistical analyses were performed using IBM SPSS Statistics for Windows, version 20.0 (IBM Corp., Armonk, NY, USA). The Shapiro–Wilk test and Levene’s test were employed to evaluate the normality of the data and the homogeneity of variances, respectively. Parametric analyses were performed for data meeting normality criteria, while nonparametric analyses were applied otherwise. Differences between groups at pre and poststimulation were assessed using the independent t-test for continuous variables and the chi-square test for categorical variables. Multiple comparison correction was performed using Benjamini and Hochberg false discovery rate control procedure (α = 0.05) [49, 50].
To analyze improvements in upper limb function attributed to multi-channel tDCS, a two-way repeated measures ANCOVA (analysis of covariance) was conducted, with stroke type included as a covariate to adjust for baseline differences between groups. The analysis focused on the group × time interaction, evaluated using repeated measures ANCOVA, to determine the effects of the intervention across different time points (before the intervention, T0, and after 10 intervention sessions, T1). Additionally, to investigate the effects of multi-channel tDCS on cerebral hemodynamic, fNIRS data (HbOAcc and HbAcc) were analyzed using two-way repeated measures ANCOVA, with stroke type was included as a covariate to adjust for baseline differences between groups. The analysis focused on the group × time interactions to evaluate the effects of the intervention over time (before the intervention, T0 and after 10 intervention sessions, T1). Pearson’s correlation coefficients were calculated to investigate the relationships between changes in motor function and HbOAcc from the fNIRS analysis.
Comments (0)