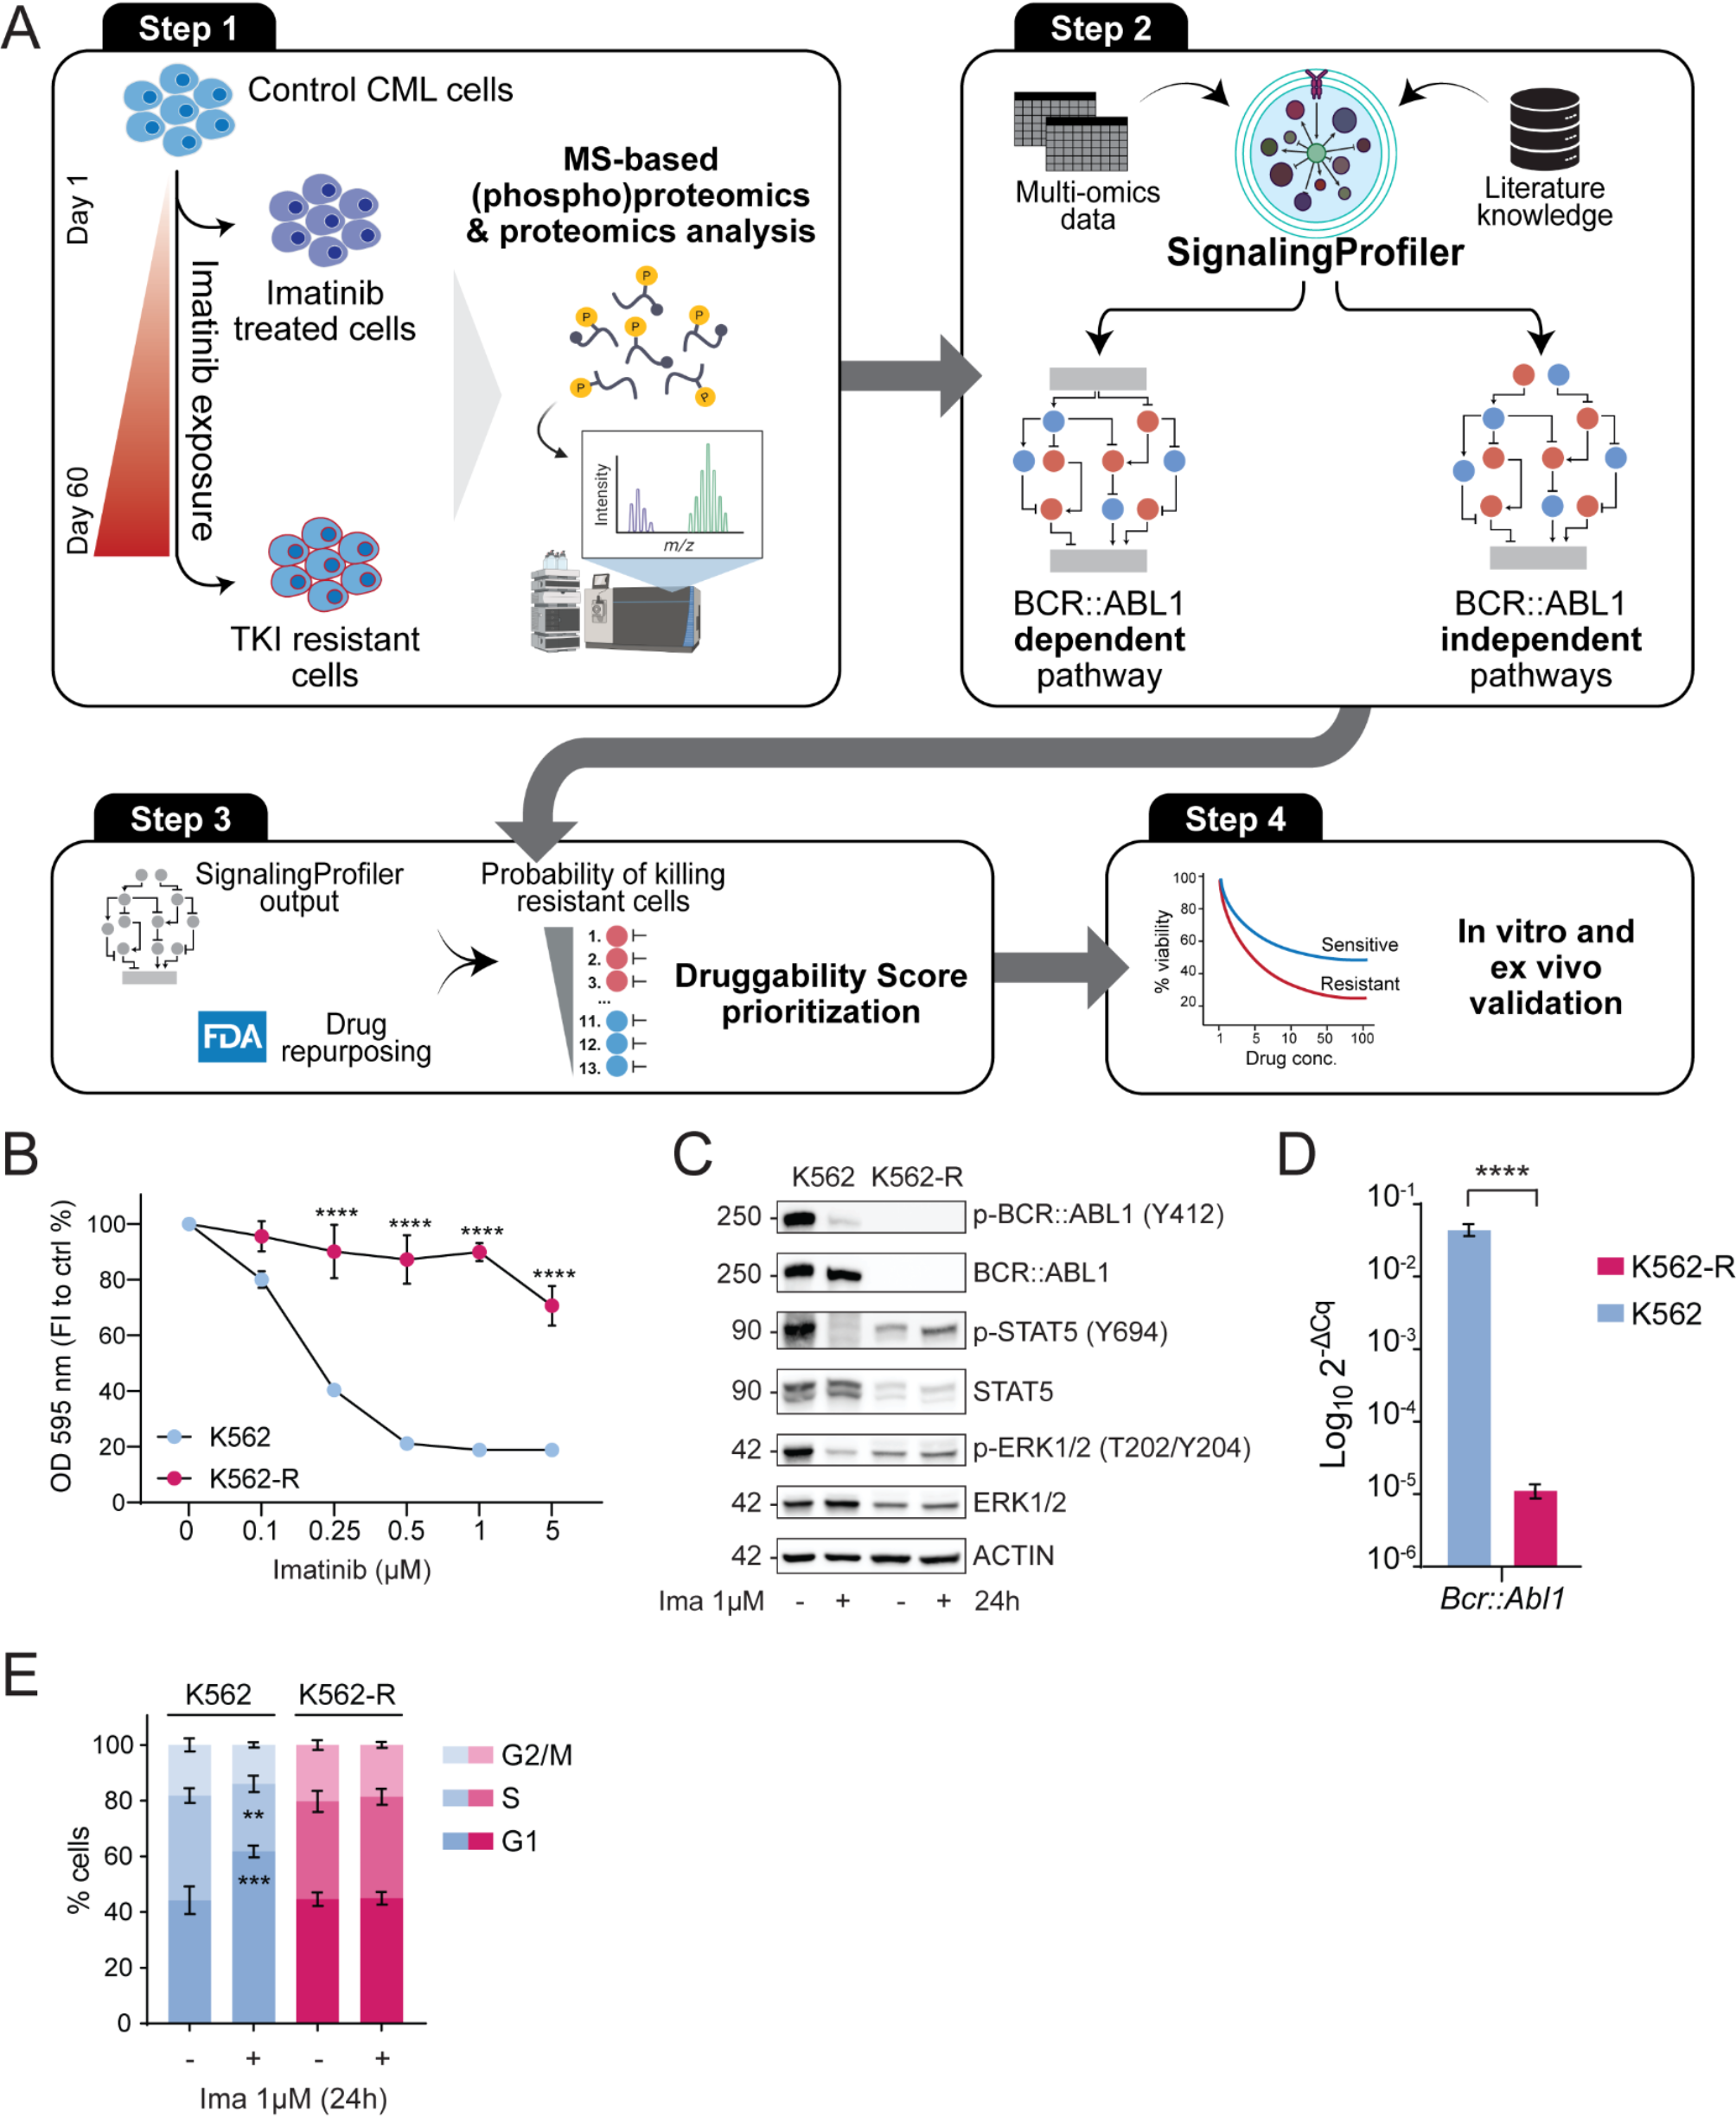
Cell culture
K562 cell line was provided by courtesy of professor D. Barilà. LAMA84 cell line was obtained from DSMZ. K562-R cells were generated by exposure of K562 cells to increasingly higher concentration of imatinib during a period of several weeks. The cells were cultured in RPMI 1640 medium (Hyclone, Thermo Scientific, Waltham, MA) supplemented with 10% heat-inactivated fetal bovine serum (ECS0090D Euroclone, Italy, MI ), 100 U/ml penicillin and 100 mg/ml streptomycin (Gibco 15140122), 1 mM sodium pyruvate (Sigma-Aldrich, St. Louis, Missouri, United States, S8636) and 10 mM 4-(2-hydroxyethyl)-1-piperazineethanesulfonic acid (HEPES) (Sigma H0887). Responders and non-responder patients derived primary blasts mRNA were provided by courtesy of professor P. Chiusolo.
Immunoblot analysis
K562 and K562-R cells were seeded at a concentration of 500.000 cells/ml and treated as indicated. After treatments cells were centrifuged and washed in ice-cold PBS 1x. Next, cells were lysed in ice-cold RIPA lysis buffer (150 mM NaCl, 50 mM Tris–HCl, pH 7.5, 1% Nonidet P-40, 1 mM EGTA, 5 mM MgCl2, and 0.1% SDS) supplemented with 1 mM PMSF, 1 mM orthovanadate, 1 mM NaF, protease inhibitor mixture 1x, inhibitor phosphatase mixture II 1x, and inhibitor phosphatase mixture III 1x and incubated for 30 min. Samples were centrifuged at 13,000g for 30 min and supernatants were collected. The total protein concentration was determined using the Bradford reagent (Biorad, 5000006). Protein extracts were denatured and heated at 95 °C for 10 min in NuPAGE LDS Sample Buffer (Thermo Fisher Scientific, NP0007) and DTT as a reducing agent (NuPAGE Sample Reducing Agent) (Thermo Fisher Scientific, NP0004). Denaturated proteins were resolved using 4–15% Bio-Rad Mini-PROTEAN TGX/CRITERION polyacrylamide gels (Bio-Rad 4561084). Proteins were transferred to Trans-Blot Turbo Mini Nitrocellulose Membranes using a Trans-Blot Turbo Transfer System (Bio-Rad, 17001918). The nitrocellulose membranes were incubated in blocking solution (5% BSA, 0.1% Tween 20 in TBS 1x) at room temperature for 1 h. Saturated membranes were incubated overnight with primary antibodies (Table C) diluted in 5% BSA or 5% skimmed milk powder, depending on manufacturer instruction. HRP-conjugated secondary antibodies (Goat Anti-Mouse IgG (H + L)-HRP Conjugate 1:3000, BIORAD 1721011) were diluted in 5% skimmed milk powder, 0.1% Tween 20 in 1× TBS and used for the detection of the primary antibodies. Chemiluminescence was detected using Clarity Western ECL Blotting Substrates (Bio-Rad) and the Chemidoc (Bio-Rad). Band densities were quantified using ImageJ and normalized to the loading control.
Cell cycle analysis
Cells were treated with imatinib for 24 h at a concentration of 500.000 cell/ml. The following day 106 cells were collected from each sample and washed with ice-cold PBS. Cells were resuspended in 1 µg/ml DAPI (Thermo Scientific, #62248) and 0.2 mg/ml RNase (Thermo Scientific, #12091021) PBS solution and incubated for 30 min before flow cytometry analysis. The fluorescence intensity was detected using CytoFLEX S (Beckman Coulter). Fluorescence intensity was measured using a CytoFLEX S instrument (Beckman Coulter). Weekly quality control checks for the cytometer were performed using CytoFLEX Daily QC Fluorospheres (Beckman Coulter B53230). Data acquisition was conducted using CytExpert software (Beckman Coulter).
MTT assay
Cell viability was measured using the Cell Proliferation Kit I (MTT) (Roche, 11465007001). Cells were treated with drugs reported on Table B for 24 at a concentration of 50.000 cells/ml or 72 h at a concentration of 10.000 cells/ml. 100 µl of cell suspension were seeded in technical triplicate in a 96 multiwell plate. After 24 h of treatment, 10 µl of MTT were added to the cells and incubated for 4 h at 37 ◦C. Solubilization Buffer was used to dissolve the formazan crystals during an overnight incubation. Finally, the plates were read at 595 nm using a microplate reader (Bio-Rad).
Real time quantitative PCR
5·106 cells were centrifuged and resuspended in 1 ml Trizol reagent (Thermo Fisher Scientific). After 5 minutes incubation at room temperature, 200 ul of ice-cold chloroform and vigorously shaken for 15 seconds. Samples were centrifuged at 12000 xg for 15 minutes and aqueous supernatant containing RNA were collected. Next samples were additioned with 500 ul isopropanol and 10 µg of glycogen and incubated overnight at -20°C. The following day samples were centrifuged at 12000 xg for 10 minutes and supernatant was descartes. Pellets were washed with 1 ml ice-cold ethanol 75% and centrifuged again at 7500 xg for 5 minutes. Ethanol was allowed to evaporate and pellets were resuspended in RNase free water. Quantification and purity of the samples was determined with NanoDrop Lite (Thermo Scientific). 1000 ng of RNA from each sample underwent retrotranscription. PrimeScript RT reagent Kit (Takara) was used following manufacturer’s instructions. Specific primers for the BCR::ABL1 gene were designed (forward: 5’-TGACCAACTCGTGTGTGAAACTC-3’; reverse: 5’-TGACCAACTCGTGTGTGAAACTC-3’). RT-qPCR was performed using the SYBR Premix Ex Taq (Takara) kit and the QuantStudio®3 Real-Time PCR instrument (Applied Biosystems). The fold changes in mRNA levels were normalized on actin gene expression. The comparative analysis of gene expression was evaluated by expressing the values as Log102−ΔCq.
Immunofluorescence analysis
To assess γH2AX modulation upon 1µM imatinib 24 h treatment, 5·106 cells were treated as indicated, washed in PBS and fixed in 4% PFA for 30 min. Next, cells were washed in PBS and permeabilized in a PBS + 0,1% Triton solution for 10 min. After the incubation time, cells were centrifuged at 6000 g for 5 min, washed in PBS and centrifuged again at 10.000 xg for 5 min. Cells were blocked in a PBS + 2% BSA + 0,01% Tween20 solution for 1 h and then centrifuged at 10.000 xg for 5 min. Cells were incubated with γH2AX primary antibody (CST 9718) for 1 h and washed three times in PBS + 0,01% Tween20. Next, cells were incubated with secondary antibody (SouthernBiotech 4050-30) for 1 h and washed three times. Cells were stained with DAPI (Thermo Scientific #62248) for 15 min, centrifuged at 6000 xg for 5 min and mounted for imaging. The experiment was performed in biological triplicate. Samples were quantified considering the percentage of γH2AX-positive cells (> 5 γH2AX foci) over the total number of cells.
Sample Preparation for proteomic and phosphoproteomic analysis
Cells were lysed in SDC lysis buffer additioned with 4% (w/v) SDC, 100 mM Tris -HCl (pH 8.5). Next, samples were boiled at 95° for 5 min and sonicated in Bioruptor for 10 cycles at high intensity 30s on/30s off. Protein concentration was determined by BCA assay. inStageTip (iST) method was used for proteome preparation [13]. Briefly, 50 µg of protein extract were diluted in 2% SDC buffer and 1% trifluoroacetic acid (TFA). SDBRPS tips were washed with (i) 100 µl acetonitrile (ACN), (ii) 100 µl of 30% methanol and 1% TFA and (iii) 150 µl of 0.2% TFA by centrifuging tips at 1000 xg for 3 min. Samples were loaded onto equilibrated columns and spin at 1000 xg for 10 min. SDBRPS tips were washed with (i) 100 µl of 1% TFA in ethyl acetate, (ii) 100 µl of 1% TFA in isopropanol and (iii) 0.2% TFA. For protein elution, we used a buffer containing 80% ACN, 5% NH4OH in MilliQ water. Samples were centrifuged at 1000 xg for 4 min and concentrated by SpeedVac at 45° for ~ 45 min. Finally, samples were resuspended in 10 µl of a buffer additioned with 2% ACN and 0.1% TFA. EasyPhos workflow was used to prepare phosphoproteomics samples as previously described [14]. Briefly, at least 750 µg of protein extract was diluted in 750 µl of ACN and 250 µl of EP enrichment buffer additioned with 36% TFA and 3mM KH2PO4. Samples were mixed at 2000 xg for 30 s to clear precipitates, then centrifuged at 20.000 xg for 15 min and finally transferred in a 2 ml deep-well plate. TiO2 beads were used. For each sample, 12:1 (beads: protein) were weighed out and resuspended in EP loading buffer additioned with 80% ACN and 6% (v/v) TFA. Activated TiO2 beads were added to each sample and incubated for 5 min at 40° C at 2000 rpm. Next, beads were centrifuged at 2000 xg for 1 min and supernatants (non-phosphosites) were discarded. The beads were resuspended in 500 µl of EP wash buffer, composed of 60% ACN and 1% TFA twice and then transferred to a clean tube/plate. Four additional washes with EP wash buffer were carried out mixing at 2000 rpm for 3 s. Following the wash steps, the beads were resuspended in 75 µl of EP transfer buffer (80% ACN, 0.5% acetic acid), transferred onto C8 stage tips (double layer), and spun to dryness at 1000 xg for 5 min. Phosphopeptides were eluted in 30 µl of EP elution buffer containing 200 µl of NH4OH and 800 µl of 40% ACN into PCR tubes. Immediately afterward, the samples were concentrated in a SpeedVac at 45 °C for 20 min. Meanwhile, SDBRPS tips (triple layer) were equilibrated using the following steps: (i) 100 µl ACN, (ii) 100 µl 30% methanol and 1% TFA, and (iii) 150 µl 0.2% TFA. After completion of the SpeedVac, SDBRPS loading buffer (1% TFA in isopropanol) was added to the samples. Subsequently, phosphopeptides were loaded onto equilibrated SDBRPS StageTips and washed sequentially with (i) 100 µl 1% TFA in ethyl acetate (EtOAc), (ii) 100 µl of 1% TFA in isopropanol, and (iii) 150 µl of 0.2% TFA. After the wash steps, phosphopeptides were eluted into clean PCR tubes using a buffer containing 60% ACN and 5% NH4OH. Following another SpeedVac step at 45 °C for 30 min, phosphopeptides were resuspended in 10 µl of a buffer containing 2% ACN and 0.1% TFA.
Mass spectrometry analysis
The peptides and phosphopeptides underwent desalting using StageTips and were subsequently separated on a reverse-phase column (50 cm, packed in-house with 1.9-mm C18-Reprosil-AQ Pur reversed-phase beads) (Dr. Maisch GmbH). For single-run proteome analysis, separation occurred over 120 min, while for phosphoproteome analysis, it extended to 140 min. Following elution, the peptides were subjected to electrospray ionization and analyzed via tandem mass spectrometry using an Orbitrap Exploris 480 instrument (Thermo Fisher Scientific). The instrument operated by alternating between a full scan and multiple high-energy collision-induced dissociation (HCD) fragmentation scans, resulting in a total cycle time of up to 1 s.
Proteome and phosphoproteome data processing
Raw files were analyzed using the Spectronaut software. MS/MS spectra were searched against the Homo sapiens UniProtKB FASTA database (September 2014), with an FDR of < 1% at the level of proteins, peptides and modifications. Enzyme specificity was set to trypsin, allowing for cleavage N-terminal to proline and between aspartic acid and proline. The search included cysteine carbamidomethylation as a fixed modification. Variable modifications were set to N-terminal protein acetylation and oxidation of methionine as well as phosphorylation of serine, threonine tyrosine residue (STY) for the phosphoprotemic samples.
Proteome and phosphoproteome bioinformatics data analysis
Bioinformatic analysis was conducted within the Perseus software environment [15], where statistical analysis of both the proteome and phosphoproteome was executed on logarithmized intensities of quantified values across experimental conditions. Normalization of phosphopeptide intensities consisted in subtracting the median intensity of each sample. To identify significantly modulated proteins and phosphopeptides between conditions, a Student t-test with a permutation-based false discovery rate (FDR) cutoff of 0.05 and S0 = 0.1 was employed. Categorical annotation, such as KEGG pathways, was added in Perseus. To address multiple hypothesis testing, a Benjamini-Hochberg FDR threshold of 0.05 was applied.
Imatinib treated K562 and K562-R vs. control network generation with SignalingProfiler 2.0
We run the SignalingProfiler 2.0 pipeline for K562 cells exposed to imatinib and K562-R cells to generate two networks linking BCR::ABL1 in inactive state (activity = -1) to 9 cancer hallmark phenotypes (Apoptosis, Proliferation, G1/S transition, DNA repair, DNA fragmentation, G1/S transition, Cell cycle block, Cell cycle exit, Autophagy).
Protein activity inference
Proteomic and phospho-proteomic data were processed to make them SignalingProfiler 2.0 compliant. Kinase activity was inferred by analyzing the modulation of their target phosphosites between sensitive (resistant) cells and control cells using the run_footprint_based_analysis with default parameters. Additionally, regulatory phosphosites’ modulation for kinases, transcription factors, and other signaling proteins was considered through the phosphoscore_computation function with default parameters. The resulting scores were combined to derive a final activity score. Protein abundance modulation in proteomic data was also considered as a proxy of activity.
For sensitive cells, K562 and LAMA84 multi-omic data were independently exploited to perform SignalingProfiler 2.0 protein activity inference step and the two results were merged. We selected 601 proteins that had the same modulation in the two cell lines. We inferred 244 and 258 kinases, 17 and 22 phosphatases, 214 and 261 transcription factors, and 1684 and 2153 other phosphorylated or modulated in abundance signaling proteins, in imatinib exposed K562 and K562-R cells, respectively.
Network generation
For both cell lines, a signaling network was constructed using SignalingProfiler 2.0 prior knowledge network (PKN) with direct interactions. The PKN was filtered to retain only interactions involving proteins quantified in the (phospho)proteomics data using the preprocess_PKN function. A naïve network connecting BCR::ABL1 to inferred signaling proteins was generated using the two_layer_naive_network with default parameters. Then, to keep in the naïve network only the interactions coherent with the proteins’ activity, we applied the SignalingProfiler 2.0 two-step multi-shot version of vanillaCARNIVAL optimization [16] with default parameters. The two networks were connected to 9 cancer hallmarks using the phenoscore_computation with default parameters. For K562 cells treated with imatinib only interactions from protein to phenotypes coherent with the phenotypic activity were retained using the optimize_pheno_network function with default parameters. We generated a network of 200 nodes and 429 edges for K562 cells treated with imatinib and 710 nodes and 1895 edges for K562-R cells. The two networks are available on NDEX (K562: https://www.ndexbio.org/viewer/networks/e6c7826f-4a6d-11ef-a7fd-005056ae23aa, K562-R: https://www.ndexbio.org/viewer/networks/a0c04e02-4a6e-11ef-a7fd-005056ae23aa).
BCR::ABL1 dependent and independent functional circuits identification
To obtain BCR::ABL1 dependent functional circuit, the pheno_to_start_circuit of SignalingProfiler (v. 2) R package was used, selecting BCR::ABL1 as a starting node and maximum path length 7. To obtain BCR::ABL1 independent functional circuit, the same function was used selecting 23 receptors with opposite regulation between K562-R and K562 cells or present only in K562-R network, ‘Proliferation’ and ‘Apoptosis’ phenotypes as end points and maximum path length 6. The BCR::ABL1 independent functional circuit accounted for 438 nodes and 987 edges. The network is available on NDEX at https://www.ndexbio.org/viewer/networks/73523fe5-4a6f-11ef-a7fd-005056ae23aa. For visualization purposes, we selected only paths with maximum path length 5, obtaining a network of 60 nodes and 111 edges. The generated optimized networks were displayed on Cytoscape using the RCy3 package (v. 2.14.2). The ‘pheno_layout.xml’ XML file provided within the SignalingProfiler 2.0 R package was used to set the network style in Cytoscape.
FDA-drug targets for hematological malignancies prioritizationDruggability score
For druggable targets prioritization we exploited the BCR::ABL1 independent functional circuit. We first removed nodes with incoherent incoming edges (CARNIVAL activity different than 100 or -100) obtaining a network of 424 and 875 edges. For each node, we computed a topology score considering: the network degree (i), the number of paths (maximum length = 10) inhibiting apoptosis (ii) and activating proliferation (iii). To not take into account indirect interactions, for each node we excluded paths with length 1, when longer paths were present. Each score was loghartimized and normalized between 0 and 1 and the average was computed (topology score). The topology score of each node was multiplied with the CARNIVAL activity score of the normalized between − 1 and 1, obtaining the Druggability Score. Proteins with a positive Druggability Score are expected to induce more cell death in K562-R cells than in control cells. In contrast, proteins with a negative Druggability Score should exhibit the opposite effect. To identify the FDA-approved drug targets for hematological malignancies we manually associated to the drugs of [16] the Primary Gene Name of the molecular target (FDA-drug targets catalogue) and 13 network nodes were extracted.
In vitro validation
For in vitro validation, we selected 8 network nodes (BCL2, JAK1, BTK, FLT3, PI3KCB and PI3KC3, DNMT1 and DNMT3A) that had a positive Druggability Score and that were present in the FDA-drug targets catalogue. As a negative control, we also considered AKT1 node that had a negative Druggability Score. MTT viability assay was performed treating K562 and K562-R for 24 h with inhibitors reported in Table B. For each cell line the half maximal inhibitory concentration (IC50) was computed using IC50 calculator web tool (AAT Bioquest) and the opposite of logarithm was computed and compared with the Druggability Score.
Analysis of drug sensitivity of primary CML bone marrow samples
For drug sensitivity testing of primary patient material, bone marrow mononuclear cells (MNCs) from 3 different patients were used. Patient samples were collected in accordance with the Declaration of Helsinki, following informed consent. MNCs were thawed from a biobank and stained for cell sorting using CD45-PE/Cy7 (Biolegend, clone 2D1), CD34-BV510 (Biolegend, clone 581), CD38-BV785 (Biolegend, clone HIT2), and CD26-FITC (Biolegend, clone BA5b). Leukemic progenitor cells (LPCs, CD38 high /CD26 dim) and leukemic stem cells (LSCs, CD38 dim /CD26 high) were sorted (Fig. S4). Samples were cultured for 24 h in the absence or presence of midostaurin 300nM at 37 °C, 5% CO 2, and subsequently analyzed using a CytoSMART™ automated cell counter (Corning), including Trypan Blue-based live/dead discrimination.
CML patients RNA-seq analysis
RNA was extracted from peripheral blasts of 3 imatinib responder and 4 non responder CML patients (Table S8). Samples were obtained upon the patients’ informed consent. Briefly, RNA was prepared from PBMCs using the RNeasy Mini Kit (QIAGEN, Germany). The pellets obtained from buffycoat were resuspended in the RLT buffer. We proceed with the addition of equal volume of 70% Ethanol (EtOH) to our already homogenized sample in RTL. It was spinned at ≥ 8000 x g for 15 s. 700 µl of Buffer RW1 were added and the solution was spinned at ≥ 8000 x g for 15 s. It was emptied carefully, and 500 µl of RPE Buffer were added and the solution was spinned ≥ 8000 x g for 2 min. The column was emptied again and placed in a new tube and centrifuged at maximum power for 1 min to dry.
Library construction protocol
NEGEDIA Digital mRNA-seq research grade sequencing service 2.0 (Next Generation Diagnostic srl)
Library strategy
NEGEDIA Digital mRNA-seq v2.0
Data processing step
Illumina Nova Seq 6000 base call (BCL) files were converted in fastaq file through bcl2fastaq (v2.20.0.422).
Data was processed using nf-core/rnaseq v3.14.0 [17] of the nf-core collection of workflows [18], utilising reproducible software environments from the Bioconda [19] and Biocontainers [20] projects. The pipeline was executed with Nextflow v23.10.1 [21].
NFkB targets analysis
The RNAseq analysis of LSCs and LPCs from 5 CML patients from the GEO database (GSE43754) was conducted within the Perseus software environment [15]. To identify significantly modulated transcripts, a one sample Student t test with a permutation-based false discovery rate (FDR) cutoff of 0.07 and S0 = 0.1 was employed. To address multiple hypothesis testing, a Benjamini-Hochberg FDR threshold of 0.05 was applied. To analyze the modulation of NFKB1 targets, we selected NFKB1 regulon in SignalingProfiler (v. 2.0) database combining SIGNOR and CollecTRI [22] information. We merged the NFKB1 regulon with significantly modulated transcripts with an absolute fold-change higher than 1. The fold-change in each patient is reported in Fig. 6C.
Statistics
All experiments were independently replicated at least three times (n = 3). Data are expressed as means ± standard error (SEM). When comparing three or more groups, statistical analyses were conducted using either one-way or two-way analysis of variance (ANOVA). For comparisons between two groups, the unpaired t-test was employed, assuming a two-tailed distribution. Statistical significance was defined as follows: *p < 0.05; **p < 0.01; ***p < 0.001. Prism 7 (GraphPad) was utilized for all statistical analyses.


Comments (0)