Ethics statement
The informed consent from all participants was obtained, and the study procedure was approved by the Ethics Committee of Shanxi Province Cancer Hospital. All animal experiment schemes were approved by the Animal Ethics Committee of Shanxi Province Cancer Hospital and implemented based on the Guide for the Care and Use of Laboratory Animals (Jones-Bolin 2012).
Clinical tissues
This study recruited 60 TNBC patients (38–66 years old; 47.9 ± 4.9 years old) hospitalized in Shanxi Province Cancer Hospital from May 2021 to May 2023. TNBC tissues and paracancerous normal tissues were collected and stored at −80℃. All patients were diagnosed with TNBC for the first time. Patients with a family history or previous history of malignancies and those who once received treatment were excluded.
Cell culture and treatment
Immortalized human mammary epithelial cell line MCF-10A and TNBC cell lines (MDA-MB-231, SUM-1315, BT-549, and MDA-MB-468) were purchased from ATCC (Manassas, Virginia, USA) and cultured in Roswell Park Memorial Institute (RPMI) 1640 medium supplemented with 10% fetal bovine serum (FBS), 100 μg/mL streptomycin, and 100 U/mL penicillin.
The cells were treated with increasing concentrations of DOX (0.125, 0.25, 0.5, 1, 2, 4, and 8 μg/mL) for 8 months to induce DOX-resistant human BC cells. The cells were treated with DOX at each concentration for 4 weeks, and the culture medium was changed every 3 days. The corresponding concentration of DOX was added when changing the culture medium. Dead cells sensitive to DOX were removed by centrifuging and changing the culture medium each time. DOX-resistant surviving cells were screened and collected, and treated with higher concentrations of DOX. Finally, the cells were cultured continuously at 8 μg/mL DOX for one month. After 8 months of DOX induction, the surviving cells were considered as DOX-resistant human BC cells (MDA-MB-231/ADR and MDA-MB-468/ADR). The cell culture medium was added with 8 μg/mL DOX intermittently for 24 h to maintain the DOX resistance. Moreover, 30 μg/mL DOX was used to treat DOX-resistant TNBC cells.
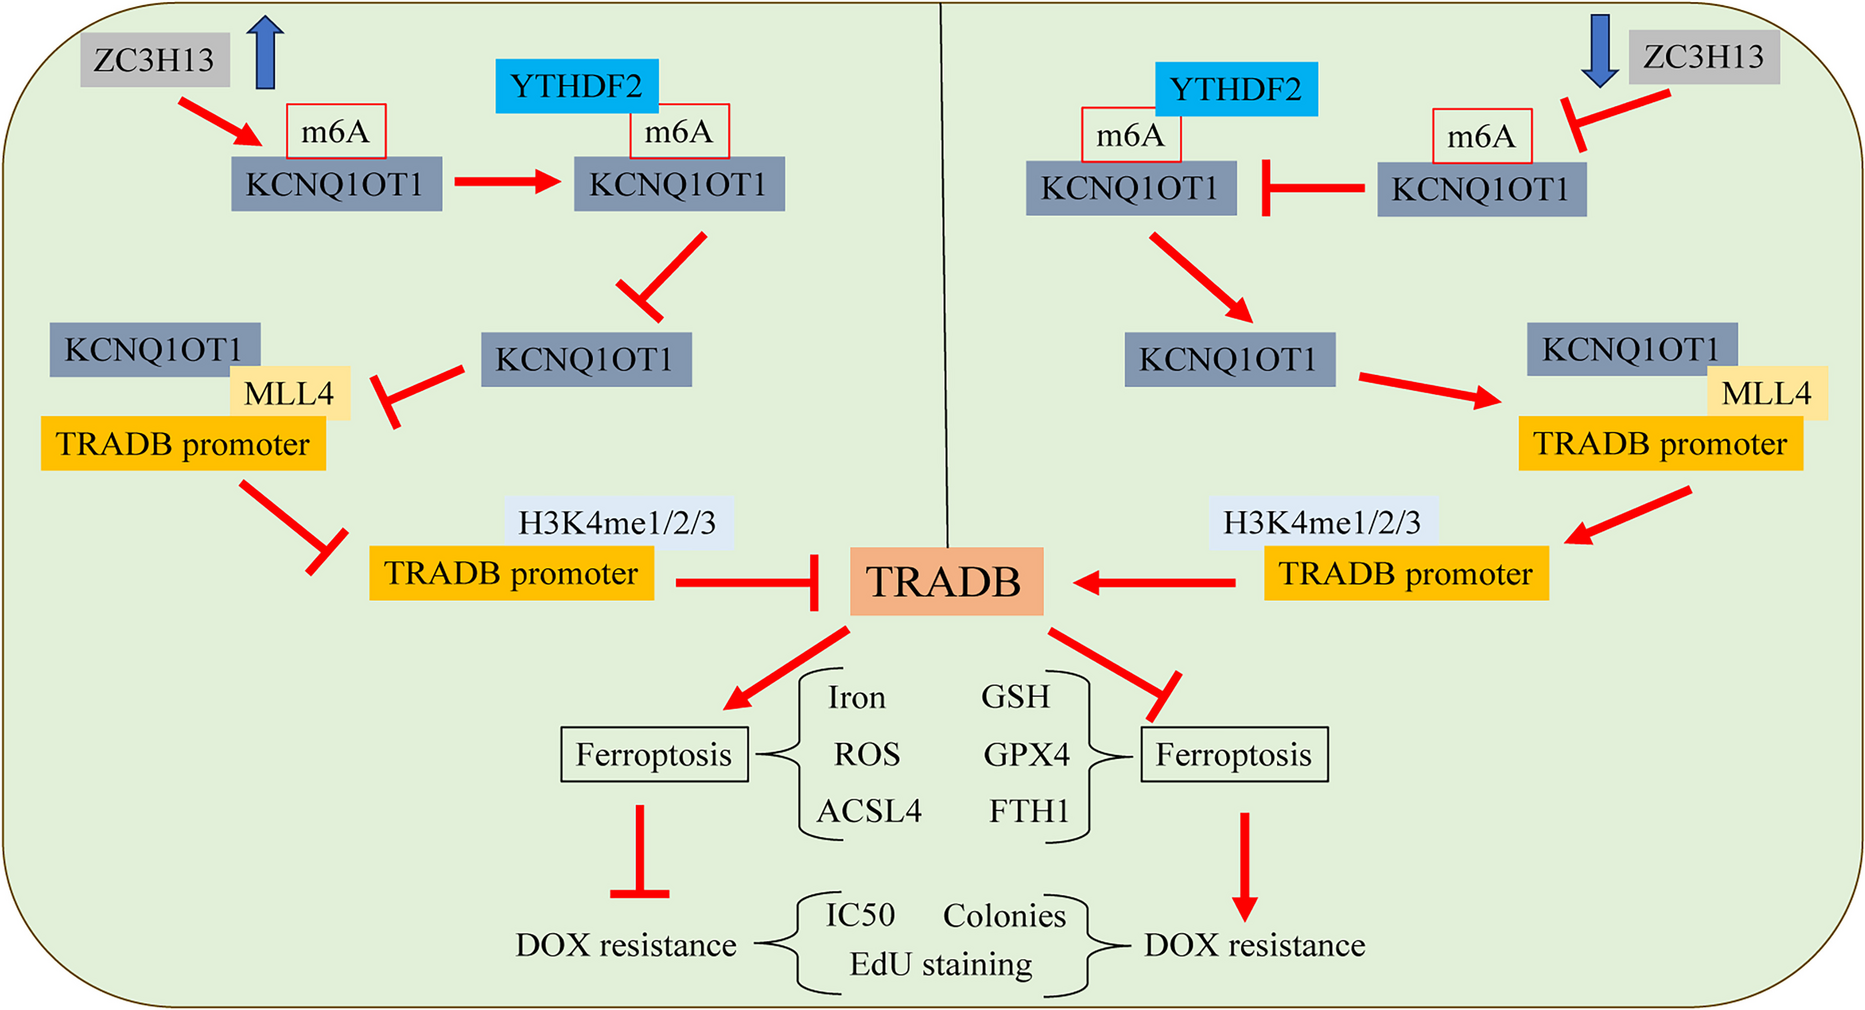
ZC3H13 or KCNQ1OT1 or TraB domain containing (TRABD) was subcloned to the pcDNA3.1 vector. siRNA targeting YTH-domain family member 2 (YTHDF2) was purchased from RiboBio (Guangzhou, China). The above sequences and plasmids were transfected into cells using Lipofectamine 2000 (Invitrogen, Carlsbad, CA, USA). The cells were treated with ferroptosis inhibitor ferrostatin-1 (Fer; 2 μM; MedChemExpress, Shanghai, China), with DMSO as a negative control.
Cell counting kit-8 (CCK-8) assay
CCK-8 assay was performed to detect the maximum half inhibitory concentration (IC50). Briefly, the cells were seeded into 96-well plates and incubated for 48 h. The transfected cells were treated with different concentrations of DOX. Then, each well was added with 100 μL mixture of CCK-8 solution (Beyotime, Jiangsu, China) and culture medium (at a ratio of 1:9) for 2 h of incubation. The absorbance at 450 nm was measured.
Clone formation assay
The cells were seeded into 6-well plates (1 × 10³ cells/well) and cultured in medium containing 10% FBS. After 2 weeks, the cells were fixed in methanol for 15 min and stained with 0.1% crystal violet. Finally, the number of colonies was recorded and counted under the microscope.
5-ethynyl-2'-deoxyuridine (EdU) staining
BeyoClick™ EdU-555 Cell Proliferation Kit (C0075S, Beyotime) was used for EdU detection. The cells were seeded into 24-well plates at a density of 5 × 10⁴ cells/well.
Detection of iron, reactive oxygen species (ROS), and glutathione (GSH)
The iron content was determined by Iron Assay Kit (colorimetric) (ab83366, Abcam, Cambridge, MA, USA). Peroxide sensitive fluorescent probe 2'−7'-dichlorodihydrofluorescein diacetate (DCFH-DA; S0033S, Beyotime) was used for detecting the intracellular ROS level. After the indicated treatments, cells in 6-well plates were washed with phosphate-buffered saline (PBS) and incubated with 10 μM DCFH-DA for 30 min under standard conditions. The DCFH-positive cells and intracellular fluorescence were observed under the fluorescence microscope (Olympus, Tokyo, Japan) and quantified by ImageJ software (National Institutes of Health, Bethesda, MD, USA). The GSH level was detected using GSH Detection Kit (s0052, Beyotime). Briefly, TNBC cells were seeded into 6-well plates and cultured for 24 h, then harvested, and re-suspended in reagents. The absorbance at 412 nm was detected with an ultraviolet spectrophotometer (ThermoFisher Scientific, Rockford, IL, USA). The iron content, ROS level, and GSH level in tissues were also determined according to the kit instructions.
Total m6A detection and methylated RNA immunoprecipitation (MeRIP)
m6A RNA methylation Quantification Kit (colorimetric) (ab185912, Abcam) was used to detect the total m6A level of cells. Briefly, the total RNA was extracted, and 200 ng RNA was incubated with 80 μL binding buffer at 37℃ for 90 min, followed by diluted capture antibody and detection antibody. After strict cleaning, the developing agent was added, and the absorbance was measured on a microplate reader at 450 nm within 15 min. Moreover, Magna MeRIP m6A Kit (Millipore, Schwalbach, German) was used for MeRIP assay. Shortly, 5 μg of total RNA was fragmented at 70℃ for 5 min and then incubated with 3 μg m6A antibody (ab208577, Abcam) or IgG antibody (ab170190, Abcam) at 4℃ for 6 h. After washing, the enriched RNA was eluted for analysis.
RNA immunoprecipitation (RIP)
Magna RIP™ RNA Binding Protein Immunoprecipitation Kit (Millipore) was used for RIP. The cells were ice lysed in lysis buffer containing protease inhibitors and ribonuclease inhibitors for 30 min and centrifuged. The cell lysates were collected and incubated with magnetic bead protein A/G coated with control IgG antibody (ab150077, Abcam), anti-mixed linked leukemia 4 (MLL4) (pa5-116,906, ThermoFisher), and anti-YTHDF2 antibody (ab220163, Abcam) at 4℃ overnight. The RNA was extracted on the next day for detecting the relative expression.
RNA pull down
Briefly, biotin (bio)-labeled LncRNA KCNQ1OT1 was incubated with cell lysates for 2 h at 4℃. The complex was bound to streptavidin-conjugated Dynabead and then subjected to Western blot analysis to verify the enriched proteins after elution and recovery.
Actinomycin D treatment
RNA stability assay was performed as described in previous literature (Xu et al. 2022b). Briefly, the cells were treated with actinomycin D (Sigma-Aldrich, Merck KGaA, Darmstadt, Germany) at a final concentration of 5 μg/mL for 0, 3, or 6 h. Then the total RNA was extracted for RT-qPCR to quantify the relative expression of KCNQ1OT1 RNA.
Subcellular localization
Cy3-labeled KCNQ1OT1 probe and 4', 6-diamino-2-phenylindole (DAPI) were from GenePharma (Shanghai, China). FISH detection was performed using the Fluorescence In Situ Hybridization Kit (ThermoFisher Scientific), and the cellular localization was analyzed according to the manufacturer's protocol. The nuclei were counter-stained with DAPI. Images were obtained by the confocal microscope (Olympus).
PARIS™ Kit (Invitrogen, Carlsbad, CA, USA) was used for subcellular isolation assay. A total of 1 × 10⁶ MDA-MB-231 and MDA-MB-468 cells in cell fractionation buffer were collected and centrifuged for separation of cell nucleus and cytoplasm. After removing the supernatant, the nuclei were obtained with cell lysis buffer. The isolated KCNQ1OT1 was quantified by RT-qPCR, with GAPDH as the cytoplasmic indicator and U6 as the nuclear indicator.
Chromatin immunoprecipitation (ChIP)
The ChIP procedure was performed using the EZ-ChIP Detection Kit (Millipore). The cells were collected and cross-linked with 1% formaldehyde at 37℃ for 10 min. Then, the culture medium was taken out, and the cells were suspended with cell lysate (100 μL/1 × 106) and lysed on ice for 15 min.
DNA was sheared by ultrasonication, and the chromatin fragments were incubated with anti-MLL4 (ab56770, Abcam), anti-H3K4m1 (ab176877, Abcam), anti-H3K4m3 (ab32356, Abcam) and anti-H3K4m2 (ab213224, Abcam) overnight, with IgG (ab150077, Abcam) as the negative control. Protein A/G-coupled magnetic beads (Pierce, Waltham, MA, USA) were added to capture the protein-DNA binding complex. After washing, 5 mmol/l NaCl was added for de-crosslinking and DNA was extracted. The concentration of TRABD promoter region in the complex was detected. TRABD promoter primer sequences were F: 5′-TTCCCTGATCCCGTGTTCTC-3′ and R: 5′-CTGTTCTGTGAGCCGTCAGT-3′.
Establishment and treatment of xenograft tumor in nude mice
Female BALB/c nude mice (18–20 g, 5–6 weeks old) were purchased from Shanghai SLAC Laboratory Animal Co., Ltd. (Shanghai, China) and reared under specific pathogen-free conditions. Lentiviral vectors containing ZC3H13 (Lv-ZC3H13) or Lv-KCNQ1OT1 or negative control (empty vector, Lv-NC) were synthesized by GenePharma. Further experiments were performed 48 h after lentivirus infection of cells. To establish a subcutaneous xenograft model, 2 × 10⁶ cells were subcutaneously injected into the right armpit of mice together with 0.2 mL PBS. Two weeks after tumor transplantation, all mice were intraperitoneally injected with DOX (5 mg/kg), once every 3 days. The longest diameter (a) and shortest longitude (b) of tumors were measured with a vernier caliper, and the tumor volume was calculated (volume = a × b2/2). After 40 days, the mice were euthanized, and the tumors were excised and weighed.
Immunohistochemistry
The paraffin-embedded xenograft tumors were cut into 4-μm sections. The samples were removed from paraffin for dewaxing and rehydration before antigen extraction. Ki-67 (ab15580, Abcam) antibody was used to detect the expression of Ki-67. After incubation with the primary antibody overnight at 4℃, the sections were incubated with the secondary antibody (ab150077, Abcam) for 30 min at room temperature. The sections were stained with diaminobenzidine and counter-stained with hematoxylin. Subsequently, immunohistochemical staining images were obtained under the microscope.
Real-time quantitative polymerase chain reaction (RT-qPCR)
The total RNA was extracted using TRIzol reagent (Invitrogen) and identified using NanoDrop spectrophotometer (ThermoFisher Scientific). Reverse Transcription Kit (Promega, WI, USA) was used for RNA reverse transcription. Quantitative real-time PCR was performed using SYBR Green Kit (Promega) on the ABI7500 instrument (ThermoFisher). The primers are shown in Table 1. The relative expression of gene was calculated using the 2−ΔΔCt method (Livak and Schmittgen 2001), with GAPDH as the internal reference.
Table 1 PCR primer sequencesWestern blot
The total protein was extracted using radio-immunoprecipitation assay buffer (Beyotime) from cells and tissues. After adding protein loading buffer, the protein was denatured in boiling water. After centrifugation, the supernatant was collected for subsequent detection. Then, the proteins were separated by sodium dodecyl sulfate polyacrylamide gel and transferred to polyvinylidene fluoride membranes. After blocking in 5% skim milk for 2 h, the membranes were treated with primary antibodies at 4℃ overnight, including ZC3H13 (1:1000, ab314638, Abcam), MLL4 (1:500, PA5-116,906, ThermoFisher), YTHDF2 (1:1000, ab220163, Abcam), TRABD (1:1000, PA5-42,217, ThermoFisher), ACSl4 (1:10,000, ab155282, Abcam), GPX4 (1:1000, ab125066, Abcam), and FTH1 (1:500, ab75972, Abcam). After washing, the membranes were incubated with horseradish peroxidase-conjugated secondary antibody (ab205718, 1:2000, Abcam) for 1 h at room temperature. Subsequently, the enhanced chemiluminescence detection system (GE Healthcare, Aurora, OH, USA) was used to develop the bands. GAPDH (1:2500, ab9485, Abcam) was used for protein normalization. The gray scale values were measured using image J software (National Institutes of Health, Bethesda, MD, USA).
Statistical analysis
Data analysis and map plotting were performed using the SPSS 21.0 (IBM Corp., Armonk, NY, USA) and GraphPad Prism 8.0 (GraphPad Software Inc., San Diego, CA, USA). The data were examined for normal distribution and homogeneity of variance. The t test was adopted for comparisons between two groups, and one-way or two-way analysis of variance (ANOVA) was employed for the comparisons among multiple groups, following Tukey's multiple comparison test. A value of P < 0.05 indicated a significant difference.


Comments (0)