
Remember me


Cannabis vaporizers are novel devices and their effects on the pulmonary system remain poorly characterized. To investigate the impacts of cannabis vapor on human lung epithelial cells, we treated A549 cells in a submerged model with CaVE at doses ranging from 0–4.5 µg/ml of Δ9-THC or equivalent volumes of ethanol vehicle control. CaVE caused significant cytotoxicity at a dose of 2.5 µg/ml (Fig. 1a). Based on this result, we selected 2 µg/ml for further transcriptomic analysis using RNA sequencing. Principal Component Analysis (PCA) showed clear separation between the CaVE, the vehicle, and the negative control groups (Fig. 1b). The first principal component (PC1) explained 32.2% of the variance, while the second component (PC2) explained 13.9%, indicating that the transcriptional changes were largely driven by treatment with CaVE.
Fig. 1
CaVE causes inflammation in A549 cells cultured under submerged conditions. (a) Cytotoxicity of CaVE or volume-equivalent vehicle control across a dose range of 0–4.5 µg \(^\)-THC/ml. (b) PCA of cell cultures treated with CaVE, ethanol vehicle control, or negative control (c) Volcano plot showing the transcriptional response of CaVE versus vehicle control in submerged A549 cells. (d) GSEA of pathways significantly enriched in response to CaVE. (e) Cnetplot illustrating gene similarities and overlaps among the top enriched pathways. (f–k) Heatmaps with z-scores of genes involved in the top enriched pathways in response to CaVE, including TNF Signaling (f), Inflammatory Response (g), Hypoxia (h), E2F Targets (i), G2M Checkpoint (j), and Cholesterol Homeostasis (k)
We then assessed DEGs affected by CaVE (Fig. 1c, Supp. Table 1). Some of the most upregulated genes included EGR2 and EGR4, which are involved in epithelial cell proliferation and differentiation (Kumbrink et al. 2010). To understand the pathways these DEGs contribute to, we performed GSEA (Fig. 1d, Supp. Table 2). The top three upregulated pathways included TNF signaling via NF-κB, inflammatory response, and hypoxia. The top three downregulated pathways were E2F targets, G2M checkpoint, and cholesterol homeostasis. Clustering of these pathways was also performed using cnetplots to visualize overlaps in genes (Fig. 1e). All upregulated pathways clustered together. The downregulated pathways E2F targets and the G2M checkpoint clustered together, while the pathways associated with cholesterol homeostasis remained distinct. Clustering indicates an overlap of genes contributing to these pathways, signifying that in general these pathways are interrelated.
The most upregulated genes in response to cannabis vapor were related to inflammation (Fig. 1f-g) and included chemokines such as those from the CXCL, CCL, interleukins, and TNF families, suggesting induction of inflammation in the epithelial cells. Genes in the hypoxia pathway were also upregulated by CaVE (Fig. 1h), including DNA damage response genes such as DDIT3 and TIPARP, which are involved in cellular stress adaptation and repair (Hutin et al. 2021; Osman et al. 2023). Additionally, CaVE upregulated FOS and JUN which are key components of the AP-1 complex, a transcriptional factor that regulates cell proliferation, differentiation, stress response, and DNA damage repair mechanisms (Rauscher et al. 1988). The downregulation of cell cycle pathways, including E2F targets and the G2M checkpoint, indicates an impairment in cell proliferation (Fig. 1i-j). Lastly, genes involved in cholesterol homeostasis were downregulated (Fig. 1k). These genes play a role in cholesterol biosynthesis, fatty acid and lipid metabolism, and cholesterol efflux, all of which are critical in the production of surfactant by AEC2 cells. Together these results show that CaVE exposure induces significant transcriptional changes in submerged A549 cells, characterized by inflammation, hypoxia-related responses, and activation of DNA damage repair mechanisms, while simultaneously downregulating those associated with cell cycle progression and homeostasis.
Alveolar epithelial cells cultured under pseudo-ALI and ALI conditions display enhanced AEC2-associated gene expressionA549 cells are a widely used AEC2 cell model. One of the limitations of this cell line is that A549 cells are derived from non-small cell lung cancer (NSCLC) and thus exhibit cancer-like characteristics, including uncontrolled proliferation. A major advantage of ALI cultures is their ability to allow cells to reach a non-proliferative, terminal state. To test this, we assessed markers of NSCLC in cells cultured under submerged, pseudo- and ALI conditions (Fig. 2a). We observed a decrease in NSCLC and cell cycle-associated gene expression when cells were cultured at pseudo-ALI and ALI. For example, the expression of AURKA, a gene frequently overexpressed in NSCLC and linked to uncontrolled cell proliferation, was reduced in pseudo- and ALI conditions (Zheng et al. 2018). This suggests that culturing A549 cells at ALI brings their transcriptional expression closer to that of AEC2 cells.
Fig. 2
Cells cultured at ALI show decreased markers of NSCLC and increased markers of alveolar epithelial cells. (a) Heatmap displaying z-scores of NSCLC markers and cell cycle regulators across submerged, pseudo-ALI, and ALI culture conditions. (b) Expression of the AEC2 marker SFTPC is elevated in pseudo-ALI and ALI cultures. (c-d) Culturing cells at ALI enhances the expression of genes associated with alveolar functions, including (c) barrier integrity markers CDH1, TJP3, OCLN, and CLDN4 and (d) ion transport-related genes AQP3, SLC4A4, and CFTR. Statistical analysis was performed using two-way ANOVA followed by Dunnett’s test (*p < 0.05, **p < 0.01, ***p < 0.001, ****p < 0.0001)
Major functions of AEC2 cells include surfactant production, fluid regulation, and barrier integrity (Ballard et al. 2010). To determine whether expected differentiation was taking place in our model, we interrogated our RNA-seq data to evaluate the impact of culture conditions on the expression of key genes in unexposed cells. First, we compared the expression of genes important for surfactant protein production. SFTPC, a marker of AEC2 cells, was increased in ALI and pseudo-ALI cell culture models compared to submerged cell cultures (Fig. 2b). We next assessed genes related to epithelial barrier integrity, which in AEC2 cells is made up of proteins for tight junctions, cadherins, and claudins (Díaz-Coránguez et al. 2019). Genes of proteins involved in cell-to-cell junctions and cell-to-cell contact such as ZO-1 (TJP3), E-Cadherin (CDH1), occludin (OCLN), and CLDN4 (CLDN4) were also expressed at higher levels in pseudo-ALI and ALI cultures than submerged cells (Fig. 2c). Lastly, genes associated with water transport and ion channels (Ruaro et al. 2021), including CFTR, AQP3, and SLC4A4 also had increased expression in pseudo-ALI and ALI cultures (Fig. 2d). It is noteworthy that between cells cultured at pseudo-ALI versus ALI, there was little difference in the expression of genes involved in surfactant production, water and ion channels or cell–cell junctions. Thus, pseudo- and ALI cultures promote a transcriptomic response more closely mirroring the phenotype of AEC2.
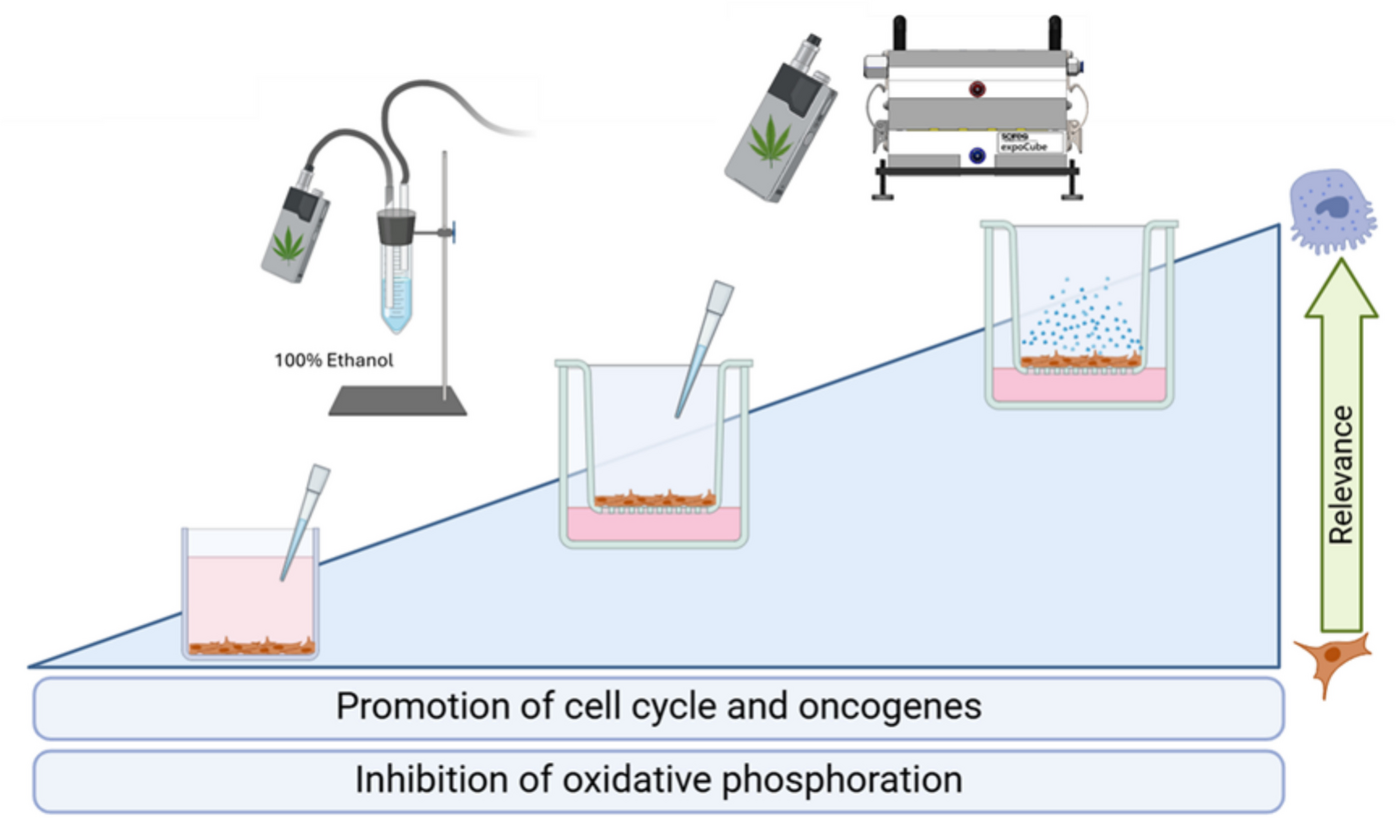
CaVE promotes cell cycle progression and suppresses oxidative phosphorylation in A549 pseudo-ALI culturesWe next tested the impacts of CaVE in A549 cells cultured at ALI with CaVE diluted in DMEM to a final concentration of 2 µg/ml Δ9-THC, equivalent volume of ethanol in DMEM (vehicle control), or DMEM alone (negative control). The vehicle elicited a minimal cytotoxic response of 1.1%, and CaVE showed no significant impact on cytotoxicity (Fig. 3a). PCA of the RNA-seq data showed separation of the negative control group from both CaVE-treated and the ethanol-vehicle control groups (Fig. 3b). While CaVE and vehicle control cells clustered separately, they were close in proximity, suggesting that vehicle effect in the ALI model may partially account for some of the effects of cannabis vapor in this model.
Fig. 3
CaVE alters metabolism and cell growth pathways in pseudo-ALI cultures. (a) Cytotoxicity of CaVE, volume-equivalent ethanol control and negative control in pseudo-ALI cultures. (b) PCA of transcriptional data from pseudo-ALI A549 cultures treated with CaVE, vehicle control, or negative control. (c) Volcano plot of the transcriptional response of CaVE versus vehicle control in pseudo-ALI A549 cells. (d) GSEA of significantly enriched pathways in response to CaVE. (e) Cnetplot showing gene similarities and overlaps among the top enriched pathways. (f–i) Heatmaps with z-scores of genes involved in the top enriched pathways, including Mitotic Spindle (f), G2M Checkpoint (g), E2F Targets (h), and Oxidative Phosphorylation (i)
We next identified the DEGs between CaVE exposed and vehicle control cells (Fig. 3c, Supp. Table 3). Notable upregulated genes included CYP1B1, a xenobiotic metabolizing enzyme frequently overexpressed in cancer (Murray et al. 1997). GSEA pathway analysis of DEGs revealed the upregulation of key pathways involved in cell cycle progression, including the mitotic spindle, G2M checkpoint, and E2F targets (Fig. 3d, Supp Table 4). These pathways are critical for proper mitosis, DNA replication, and checkpoint regulation. In contrast, oxidative phosphorylation was significantly suppressed by CaVE. Clustering analysis using cnetplot showed that the upregulated pathways clustered together, with overlapping genes driving their enrichment, indicating that they are interrelated. In contrast, the oxidative phosphorylation pathway clustered separately (Fig. 3e). Genes in the upregulated cell cycle pathways (Fig. 3f-h) included oncogenes such as BRCA2, which is involved in homologous recombination-mediated DNA repair (Abaji et al. 2005), and E2F family members, which drive cell cycle progression through S-phase entry (Pennycook et al. 2020). There was downregulation in oxidative phosphorylation after treatment with CaVE (Fig. 3i). This included a decrease in genes associated with electron transport chain (ETC) complexes, including complex I ubiquinone oxidoreductase (NDUF gene family), complex III cytochrome c reductase (UQCR gene family), and complex V ATP synthase (ATP5 gene family) (Fig. 3i). Together, these findings demonstrate that CaVE exposure in A549 cells cultured at ALI may promote cell cycle progression while simultaneously suppressing oxidative phosphorylation.
Cannabis vapor promotes cell growth and oncogenic non-coding RNA expression in A549 cells cultured at ALIGiven that ALI cultures exhibited evidence of AEC2-like gene expression, we utilized the RNA-seq analysis from A549 cells in this model to better understand the effect of whole cannabis vapor. Using an advanced exposure system, we achieved an average cannabis vapor deposition of 2.1 µg Δ9-THC/ml, with values ranging from 1.3 to 3.4 µg/ml (Fig. 4a). At this concentration, there was no increase in cytotoxicity compared to controls (Fig. 4b). PCA demonstrates distinct clustering patterns of alveolar epithelial cells following exposure to cannabis vapor, with some overlap between the vehicle and negative control groups (Fig. 4c). This indicates a lack of vehicle effect. We next identified DEGs following cannabis vapor exposure (Fig. 4d, Supp. Table 5). Notable upregulated genes included AHRR, CYP1B1, and CYP1A1, genes which are regulated by the aryl hydrocarbon receptor (AhR) (Peres et al. 2017). Activation of the AhR is a well-documented response to exposure to toxic substances, suggesting that cannabis vapor triggers a detoxification response. GSEA pathway analysis of DEGs revealed that cannabis vapor significantly upregulated pathways related to cell metabolism and growth, and downregulated pathways involved in migration and inflammation (Fig. 4e, Supp Table 6). Cnetplot clustering showed some overlap in both downregulated and upregulated pathways (Fig. 4f). Upregulated pathways involved in cell metabolism included the unfolded protein response and mTORC1 signaling pathway (Fig. 4g-h), suggesting that cannabis vapor promotes cellular adaptation to stress. Conversely, epithelial-to-mesenchymal transition (EMT), complement activation, KRAS signaling, and estrogen receptor signaling pathways were downregulated (Fig. 4i-l) together indicating a dysregulation of cell growth and metabolism pathways.
Fig. 4
Cannabis vapor alters metabolism and cell growth pathways in ALI cultures. (a) Cannabis vapor deposition in cell culture. (b) Cytotoxicity of cannabis vapor or air vehicle control compared to negative control. (c) PCA of transcriptional data from A549 cells treated with cannabis vapor, vehicle control, or negative control. (d) Volcano plot of the transcriptional response of cannabis vapor versus vehicle control in ALI A549 cells. (e) GSEA of significantly enriched pathways in response to cannabis vapor exposure. (f) Cnetplot showing gene similarities and overlaps among the top enriched pathways. (g–l) Heatmaps with z-scores of genes involved in the top enriched pathways, including Unfolded Protein Response (g), MTORC1 Signaling (h), Epithelial-Mesenchymal Transition (i), Complement (j), KRAS Signaling (k), and Estrogen Response (l)
We also found significant changes in non-coding RNAs (ncRNAs) that play critical roles in gene expression regulation (Table 1). We identified 18 long non-coding RNAs (lncRNAs) that were upregulated and 10 that were downregulated. Notably, among the upregulated lncRNAs was LINC00115, which is highly expressed in tumor tissues and cells (Wu et al. 2022). On the other hand, DIO3OS was downregulated; this lncRNA is known to be downregulated in NSCLC (Zhang et al. 2021). Moreover, our results also showed that three microRNAs (miRNAs) were significantly upregulated. Of the upregulated miRNAs, both MIR27b and MIR421 are identified oncogenes contributing to progression of various cancers (Dong et al. 2020; Hannafon et al. 2019). Thus, acute cannabis vapor exposure promoted pathways associated with cancer and cell growth, and markedly increased oncogenic ncRNAs. Taken together, these results demonstrate that acute cannabis vapor exposure promotes pathways associated with cellular stress, metabolism, and growth, while simultaneously increasing the expression of oncogenic ncRNAs. This dysregulation highlights the potential of cannabis vapor to contribute to pro-cancerous processes in the lung epithelium.
Table 1 Expression of ncRNA in A549 cells exposed to vaporized cannabisCannabis vapor does not exhibit a genotoxic mechanism of actionBecause we observed significant changes in cancer-related pathways, we next sought to understand the potential genotoxicity of cannabis vapor exposure. Genotoxicity is one of the primary mechanisms through which carcinogenic materials induce oncogenesis. To assess the genotoxic potential of cannabis vapor, we used the TGx-DDI biomarker for DNA damage classification (Li et al. 2019). This methodology was designed for identifying DDIs and operates by analyzing stress response-related gene expression alterations using an established gene expression database against which new compounds are compared, thereby categorizing them as DDI or NDDI (Li et al. 2019). In Fig. 5a, the heatmap shows the comparison of the transcriptomic response of A549 cells to cannabis vapor with the transcriptomic signatures of known DDI and NDDI compounds. The compound prediction class for cannabis vapor based on this analysis is classified as NDDI. PCA and hierarchical clustering illustrate the degree of similarity between cannabis vapor and the compounds of the database (Fig. 5b-c) whereby cannabis vapor clusters on the NDDI side of the PCA plot and hierarchical cluster. Overall, these results show that vaporized cannabis affects key cellular pathways related to cancer in AEC2 cells through a non-genotoxic mechanism, highlighting the need for further research on the potential health implications for habitual users.
Fig. 5
Cannabis vapor does not elicit genotoxic effects in alveolar epithelial cells. (a) Heatmap, (b) PCA, and (c) hierarchical clustering using Euclidean distances with average linkage of transcriptome profiling data illustrating co-expressed sets of genes associated with genotoxic and non-genotoxic compounds
Cannabis vapor elicits transcriptional changes in pathways regulating cell division, metabolism, and migration across all modelsFinally, we evaluated the transcriptional profile of A549 cells in response to cannabis vapor across all three models to visualize conserved pathways. Cannabis vapor significantly altered transcriptional activity compared to vehicle control in all models, with the submerged model showing the most changes for both upregulated (Fig. 6a, Supp. Table 7) and downregulated genes (Fig. 6b, Supp. Table 8). To understand what impacts of cannabis vapor are conserved regardless of model, we next ran GSEA on genes that were upregulated or downregulated in all three models. GSEA identified activation of the mitotic spindle and UV response pathways, along with suppression of EMT and oxidative phosphorylation (Fig. 6c, Supp. Table 9). The cnetplot showed that these pathways are independent, with no overlapping genes (Fig. 6d).
Fig. 6
Transcriptional changes in A549 cells in response to cannabis vapor exposure across submerged, pseudo-ALI, and ALI models. (a) Venn diagram showing DEGs upregulated by cannabis vapor across models. (b) Venn diagram showing DEGs downregulated by cannabis across models. (c) GSEA of DEGs common to all models. (d) Cnetplot of enriched pathways. (e–h) Heatmaps displaying log2 fold change values of DEGs of cannabis vapor versus vehicle control in each model related to (e) Mitotic Spindle, (f) UV Response, (g) Epithelial-Mesenchymal Transition, and (h) Oxidative Phosphorylation pathways
Genes in the mitotic spindle pathway and UV response pathway (Fig. 6e-f) are critical for cell growth signaling through the mTOR pathway as well as cytoskeletal organization, migration, and division. In the EMT pathway (Fig. 6g), there was downregulation of genes critical for cell adhesion as well as Wnt signaling inhibitor DKK1 (Wall et al. 2020). Lastly, the suppression of oxidative phosphorylation genes (Fig. 6h), encoding components of the mitochondrial ETC, indicate a shift from oxidative phosphorylation to glycolysis. Overall, these results suggest that, regardless of exposure and/or culture condition, cannabis vapor promotes changes in key pathways regulating cell division, metabolism, and migration.
Comments (0)