
Remember me
Manifested as inflammation and fibrinoid necrosis within the walls of small blood vessels, antineutrophil cytoplasmic antibody (ANCA)-associated vasculitis (AAV) is a systemic autoimmune disorder. This condition arises owing to the malfunction of the immune system, leading to an erroneous attack on the body’s own healthy cells and tissues. It frequently engages small-scale blood pathways and affects the kidneys, showcasing itself through injury to the glomerular vasculature, fibrinoid necrosis, and infrequent accumulation of immune complexes. The disease rapidly progresses and has poor prognosis.[1] Clinical presentations, imaging results, pathological findings, serological analyses, and other distinguishing attributes show that AAV primarily encompasses eosinophilic granulomatosis with polyangiitis, polyangiitis, and microscopic polyangiitis.[2] In the serum samples of individuals with AAV, ANCA is directed against either target antigen proteinase 3 (PR3) or myeloperoxidase (MPO). Thus, AAV is categorized as PR3-ANCA and MPOANCA. Differentiation leads to differences in the levels of kidney engagement, affected organs, lesion types, and eventual prognoses. ANCA is the first autoantibody confirmed to be associated with vasculitis[3] and is considered an important indicator for the diagnosis and monitoring of AAV activity.[3]
Neutrophil extracellular traps (NETs) are structures released by neutrophils and contain DNA and antimicrobial proteins that effectively trap and neutralize bacteria, fungi, parasites, or viruses and are involved in inflammatory responses.[4,5] NETs play a beneficial role in the management of bacterial infections.[6] Patients with sepsis exhibit elevated levels of circulating NETs possibly because of the diminished clearance of NET-released products. Cell-free DNA intensifies an inflammatory response by inducing tumor necrosis factor α (TNF-α) messenger ribonucleic acid (RNA) expression.[7] In addition, histones serve as damage-associated molecular patterns that can result in organ damage by promoting the release of pro-inflammatory cytokines and causing endothelial dysfunction through the induction of cytotoxicity and increase in reactive oxygen species production.[8] Furthermore, NETs are associated with pathological alterations in autoimmune and autoinflammatory diseases,[9] including psoriasis,[10] systemic lupus erythematosus,[11] rheumatoid arthritis,[12] small-vessel vasculitis,[13] and inflammatory bowel diseases.[14]
AAV treatment progresses through three distinct phases: Initiation of remission, upholding remission, and relapse.[15] The induction period of remission is key to the clinical treatment of AAV, and the treatment effect often directly affects the prognoses of patients.[16] To date, hormones combined with immunosuppressive agents are often used to treat AAV. However, these treatment regimens are prone to induce toxic side effects, cause major stress, and cause co-infection. Hence, exploring novel therapeutic approaches is crucial for extending the progression of the illness.
Sodium ferulate, a natural phenolic acid, is the main component of traditional Chinese medicines for promoting blood circulation and removing blood stasis, such as Angelica sinensis and Ligusticum chuanxiong. It has anti-apoptotic, antiplatelet aggregation, and antithrombotic effects.[17] Sodium ferulate can protect human umbilical vein endothelial cells damaged by oxidized low-density lipoprotein by downregulating the expression of the chemokine ligand 1 gene.[18] In the application of clinical treatment, sodium ferulate is mostly used as an adjuvant therapy for vascular diseases such as atherosclerosis and coronary heart disease.[19] However, regarding the crucial question of whether it can play a positive role in alleviating vasculitis, there has been no in-depth research and no definite conclusion so far.
In this experiment, anti-MPO immunoglobulin G (IgG) was passively transferred to Rag2 knockout (KO) mice to establish a passive immunization mouse model of MPO-AAV, and the therapeutic effect of sodium ferulate on MPO-AAV mice was tested. In addition, endothelial progenitor cells (EPCs) isolated from peripheral blood mononuclear cells (PBMCs) of AAV patients were treated with sodium ferulate, and the effects of sodium ferulate on AAV NETs, platelet activation, and endothelial dysfunction were investigated at the cellular level. This research explores the use of sodium ferulate in AAV treatment by exploring the efficacy of sodium ferulate and provides an alternative therapy for AAV treatment.
MATERIAL AND METHODS Consent to participateInformed consent was obtained from all participants for all experiments in this study after the nature and potential risks of the study were explained to them. They were also informed of their right to withdraw from the study at any time without penalty.
Animal model of MPO-AAVThis study followed the management methods for laboratory animals that were approved by the Ethics Committee of Chongqing Traditional Chinese Medicine Hospital (Approval No. 2022-DWSY-ZXL; Approval Date: November 7, 2022). Fifteen Rag2−/− mice (7–8 weeks, specific pathogen - free grade) were purchased from Chongqing Ensiweier Biotechnology Co., Ltd. The indoor temperature of the rearing room was 22°C ± 2°C, humidity was 60%, day and night alternated for 12 h, and the rats were provided with fresh and nutritionally balanced feed and clean water throughout the experimental period. The rats received fresh and nutritionally balanced feed and clean water throughout the experimental period and were subjected to regular health checkups so that health problems can be detected and addressed promptly. An animal model of immune small vasculitis was established by transferring anti-MPO IgG (GTX11730, Gene Tex, California, America) to Recombination activating gene 2 knockout (Rag2 KO) mice.[20] During and after modeling, the general state of the mice was observed, including mobility, diet, and hair condition. MPO-AAV model mice were assessed for ANCA expression via immunofluorescence staining to validate successful model construction. The sodium ferulate group was administered by intraperitoneal injection (100 mg/kg, continuously for 10 days), and the control and MPO-AAV model groups received the same doses of the solvent by gavage. After 6 weeks, in the MPO-AAV mouse model, anesthesia was performed with the intraperitoneal injection of 3% pentobarbital (dose: 30 mg/kg; P3761, BSZH, Beijing, China). After successful anesthesia administration, kidney, lung, and whole blood samples were collected. Subsequently, when the mice were in a state of deep anesthesia, a 15% pentobarbital sodium solution (dose: 150 mg/kg) was slowly injected into the lateral abdominal vein, and the gradual disappearance of the vital signs of the mice was observed.
EPC culture and groupingPBM Cs were obtained from 30 patients with immune vasculitis by density gradient centrifugation. All experiments involving human patients in our study followed the ethical regulations of the Ethics Committee of Chongqing Traditional Chinese Medicine Hospital and have been approved by the Committee (Ethics Approval No. 2020-ky-64, Chongqing Hospital of Traditional Chinese Medicine; Approval Date: January 25, 2021). The ethical principles set forth in the Declaration of Helsinki were duly considered throughout the process. In summary, anticoagulated whole blood was combined with an equivalent amount of phosphate-buffered saline (PBS) after dilution and thorough mixing. A centrifuge tube was loaded with 15 0 mL of Ficoll separation solution. Subsequently, we introduced 15 mL of thinned blood gently and gradually onto the surface of the separation solution to ensure that the interface between the two liquid surfaces remained unobscured. The mixture was centrifuged at room temperature, specifically at 1000 × g for 30 min. A white film layer, situated between the upper plasma layer and intermediate transparent separation liquid layer, constituted the lymphocyte layer. The bottom of the centrifuge tube contained red blood cells and granulocytes. Cells from the white film layer (lymphocyte layer) between the upper plasma layer and intermediate transparent separation liquid layer were carefully aspirated into a fresh centrifuge tube. The cells were then washed with 10 mL of PBS. Then, centrifugation was performed at ×250 g for 10 min, resulting in cellular precipitation. Subsequently, the cells were resuspended in 5 mL of PBS and centrifuged again at ×250 g for 10 min. After the addition of PBS and resuspension, a final centrifugation step was performed for PBMC collection. Harvested PBMCs were resuspended in endothelial basal medium-2 BulletKit medium (CC-3156, Lonza, Visp, Valais, Switzerland) supplemented with 1% penicillin and streptomycin (C0009, Beyotime, Shanghai, China) and then inoculated into culture flasks for incubation. The cells were cultured for 4 days in a 37°C incubator with 5% carbon dioxide (CO2). After 4 days, non-adherent cells were removed by rinsing with PBS, the culture medium was replaced, and incubation was incubated until the 10th day. Adherent cells were collected after rinsing the culture flasks with PBS, followed by centrifugation. The five groups were separated from EPCs: Control (peripheral blood serum of healthy people), model (peripheral blood serum of patients with immune vasculitis), L-sodium ferulate (100 ng/mL), M-sodium ferulate (200 ng/mL), and H-sodium ferulate (400 ng/mL), and) and cultured at 37°C under 5% CO2 for 24 h.
Cell identification of EPCsThe EPC cells were inoculated with 2 × 10⁶/mL–3 × 106/mL in fibronectin-coated 24- and 6-well plates, collected on the 4th day of culture, and incubated with 2.4 ng/mL DiI-ACLDL (H7970, Solarbio, Beijing, China) at 37° C for 1 h. The cells were fixed with 2% paraformaldehyde for 10 min and washed with PBS for 2 min, and 10 ng/mL Ulex Europaeus Agglutinin I (L9006-1MG, MERCK, Darmstadt, Hesse, Germany) was added to the above specimens. The cells were incubated at 37°C for 1 h. Cells in each well were counted with an inverted fluorescence microscope (BLD-200, KEYENCE, Osaka, Japan) in 15 randomly selected microscopic fields of view (×400), and the cells were identified through flow cytometry (CytoFLEX, Beckman Coulter, Brea, California, America) and detected for cell surface markers.
Mycoplasma testingMycoplasma detection in EPCs in 30 patients with immune vasculitis was performed using a Mycoplasma capsulatum enzyme-linked immunosorbent assay (ELISA) kit (CB12541-Hu, COIBO BIO, Shanghai, China). The specific operation was as follows: Standard and sample wells were set up, 50 μL of different concentrations of standards was added to each standard well, and 50 mL of the samples to be tested was added to the sample wells; the blank wells were not added. In addition to the blank wells, 100 L of horseradish peroxidase-labeled detection antibody was added to each well of the standard and sample wells. The reaction wells were sealed with a sealing film and incubated for 60 min at 37°C in a water bath or a thermostat, the liquid was discarded, the wells were dried on blotting paper, and a full washing solution (350 μL) was added to each well. The reaction wells were left to stand for 1 min, the washing solution was shaken off, and the samples were pat-dried on the blotting paper. Plate washing was performed 5 times (a plate washer was used in washing the plates). Substrates A and B (50 μL) were added to each well and incubated at 37°C for 15 min, 50 uL of termination solution was added to each well, and the optical density value of each well was measured at 450 nm within 15 min.
ImmunofluorescenceParaffin-embedded tissues were cut into 3 μm-thick sections with a slicer (RM2235, Leica, Wetzlar, Germany) and then dewaxed in xylene for 5 min 3 times. Antigen retrieval was performed using 10 mM sodium citrate at pH 6.0 and 95°C for 12 min in a toaster (HI1220, Leica, Wetzlar, Germany). The tissue was blocked overnight with an immunostaining blocking solution (C0265, Beyotime, Shanghai, China). The blocking solution was blotted with absorbent paper. Diluted primary antibodies (1: 200) of ANCA (ab103768, Abcam, Cambridge, United Kingdom), histone H3 citrullinated (H3Cit; 9701, Cell Signaling, Danvers, Massachusetts, America), and MPO (ab9090, Abcam, Cambridge, United Kingdom) were added dropwise, and the samples were left in a wet box at 4°C overnight. After the wet box was rewarmed, the sections were rinsed saturated with PBS 3 times for 3 min each time. Diluted fluorescent secondary antibody (1:100) (A11029, Invitrogen, Carlsbad, California, America) was incubated in a humidified box (37°C, 60 min). 2-(4-Amidinophenyl)-6-indolecarbamidine dihydrochloride (C1005, Beyotime, Shanghai, China) was added dropwise to stain the nucleus, and the samples were left to stand for 15 min in the dark. A tissue autofluorescence quencher was added, and incubation was performed for 5 min in the dark. The slides were mounted with an autofluorescence quencher (G1221, Servicebio, Wuhan, China). Observations were initially performed using an upright fluorescence microscopy system (Guangzhou Mshot Photoelectric Technology Co., Ltd.) at low magnification. Subsequently, images were acquired at ×400 magnification. ImageJ software (Fiji, National Institutes of Health, America; download site: https://imagej.net/ij/download.html) was used to merge and quantify the experimental results.
Flow cytometryAfter the collected blood samples were gently mixed (this step prevented in vitro platelet activation due to human manipulation), 5 μL of whole blood was promptly added to a preprepared sample tube containing the monoclonal antibody. Then, 20 μL of CD61-PerCP (46–0619–42, Invitrogen, Carlsbad, California, America) was added to each sample. For the experimental tubes, 20 μL of human procaspase-activating compound-1 (PAC-1) FITC (MA5-28564, Invitrogen, Carlsbad, California, America) and CD62P (P-Selectin) Monoclonal Antibody (AK-4), PE, eBioscience™ (12-0628-42, Invitrogen, Carlsbad, California, America) were added. The reaction was performed in an environment away from light at 25°C for 20 min. For sample fixation, 1 mL of PBS containing 1% paraformaldehyde (DF0135, Leagene, Beijing, China) was added to each tube, and the tubes were incubated for 20 min. The assay was performed using a CytoFLEX flow cytometer (Beckman Coulter, Brea, California, America) within 24 h and the results of the experiments were analyzed with FlowJo X software (v10.8, BD Biosciences, America, download site: https://www.bdbiosciences.com/zh-cn/products/software/flowjo-v10-software).
Platelet thrombin generation time assayPlatelet thromboplastin generation time test was carried out using a thromboplastin time test kit (YS0335, Yaji, Shanghai, China), and the detailed procedure was carried out according to its instruction. Specifically, 1.8 mL of fresh venous blood to be tested was mixed with 0.2 mL of sodium citrate anticoagulant (109 mM) in a 9:1 ratio. The mixture was gently inverted and mixed. Centrifugation was performed at 3000 rpm (or ×2500 g) for 10–15 min, and the upper layer of the liquid (plasma lacking platelets) was transferred to a plastic tube or centrifugal tube. Normal control plasma was maintained. Anticoagulated plasma (0.1 mL) was collected and placed in a 37°C water bath and warm for 5 min. Thrombin solution (0.1 mL) was added. Coagulation time was recorded 2 or 3 times, and the average was obtained.
ELISAThe whole blood specimen collected in the serum separation tube was placed at room temperature for 2 h, and then, serum samples were acquired by centrifugation (×1000 g for 20 min). ELISA was performed in accordance with the manufacturer’s instructions. The following ELISA kits were used: Platelet activating factor (PAF) (CEA526Ge, Cloud-clone Corp, Houston, Texas, America), β-TG (TW10534, Tongwei, Shanghai, China), PAC-1 (RX101227H, Ruixin BioTech, Quanzhou, China), and human inducible nitric oxide synthase (iNOS) (TW7992, Tongwei, Shanghai, China).
Western blottingProtein (500 μg) was combined with ×5 sodium dodecyl sulfate loading buffer in a 4:1 ratio, and the final protein concentration was approximately 3.3 μg/μL. Subsequently, proteins were denatured by boiling in water at 100°C for 6 min. For loading purposes, 60 μg of denatured total protein was separated by electrophoresis at 80 V to separate the proteins. The proteins were then transferred to a polyvinylidene fluoride membrane at a constant current of 250 mA. Afterward, the membrane was washed with tris buffered saline with Tween 20 (TBST) for 1 min and blocked with 5% skim milk at room temperature for 60 min. After blocking, the membrane was rinsed 3 times with TBST for 5 min each. Primary antibody (1:1000) was added and incubated overnight at 4°C. After incubation, the membrane was washed 3 times with TBST for 10 min each for the removal of excess primary antibodies. The membrane was then incubated with secondary antibody (1:2000; AS014, ABclonal, Wuhan, China) for 60 min and washed with TBST for 10 min 3 times. A mixture of solutions A and B from the ECL exposure aqueous solution (34580, Thermo, Waltham, Massachusetts, America) in a 1:1 ratio was applied to the membrane. After reacting for 1 min, the membrane was placed in a gel imaging system (Bio-Rad, Universal Hood II, America) for exposure detection. Finally, the trimming result images were analyzed with Image J software. All primary antibodies were purchased from ABclonal Technology Co., Ltd.: PAC-1 (A10011, ABclonal, Wuhan, China); β-trace protein (β-TG; A1925, ABclonal, Wuhan, China); soluble thrombomodulin (sTM) (A12357, ABclonal, Wuhan, China); iNOS (A0312, ABclonal, Wuhan, China); TNF-α (A11534, ABclonal, Wuhan, China); von Willebrand Factor (vWF; A13523, ABclonal, Wuhan, China); and β-actin (AC026, ABclonal, Wuhan, China).
Real-time quantitative polymerase chain reaction (qPCR)First, RNA was retrieved from the tissues using RNAiso Plus (9108, Takara, Kusatsu, Japan) after tissue grinding. Then, using a Goldenstar RT6 complementary deoxyribonucleic acid (cDNA) Synthesis Kit Version 2 (TSK302M, Tsingke, Beijing, China), we acquired cDNA through reverse transcription using RNA as a template. The qPCR experiment was implemented according to the directions of the ChamQ Universal SYBR qPCR Master Mix kit (TSE002, Tsingke, Beijing, China) after cDNA was acquired. Experimental data were calculated using the 2−ΔΔCt method, with the endogenous gene GAPDH serving as the reference point. The primer sequences used in this study are listed in Table 1.
Table 1: Primer sequences used in qPCR.
Primer name Sequences PAC-1-F TTGACTGACTCCTGGGGGAA PAC-1-R CACCATATCAGAGCAGCCGT β-TG-F CCTGGCGTCAAGAGAATCGT β-TG-R CTTGGCTTGCCCGTCTTCAT sTM-F ACACAGGTAGACACACCCCAGATAG sTM-R CAAAAGCCATAGCCAGCAAGC iNOS-F CCTTGTTCAGCTACGCCTTC iNOS-R CTGAGGGCTCTGTTGAGGTC TNF-α-F CGAGTGACAAGCCCGTAGCC TNF-α-R GGATGAACACGCCAGTCGCC GAPDH-F AGGTCGGTGTGAACGGATTTG GAPDH-R TGTAGACCATGTAGTTGAGGTCA Detection of NETsThe procedures followed the guidelines of the PicoGreen double-stranded DNA quantitative detection kit (P9740, Solarbio, Beijing, China). Initially, a standard working solution with 1 mg/mL calf thymidine DNA dry powder (D8515, Sigma-Aldrich, St. Louis, Missouri, America) and PicoGreen dye working solution was prepared. Subsequently, 1 mg/mL calf thymine DNA dry powder standard working solution was diluted twice. A fluorometer (UV752, Yoke, Shanghai, China) was used in measuring the fluorescence values of the samples. Excitation was performed at 488 nm, and emission was detected at 520 nm. The NET concentration was determined by plotting the working curve of the standard product and measuring the sample.
3-(4,5-Dimethylthiazol-2-yl)-2,5-diphenyltetrazolium bromide (MTT) assayEPCs were seeded in 96-well plates at a density of 200 μL/well, and three replicates were performed for each group. Cells were cultivated at 37°C and 5% CO2 and grouped according to the above cell model after they were adhered. In each group, the samples were added and incubated for 24 h. Subsequently, 20 μL of 5 mg/mL MTT solution (M1020, Solarbio, Beijing, China) was added to each well to initiate a reaction with succinate dehydrogenase. Afterward, 4 h of incubation was carried out, the culture was then terminated, and the medium in the well was gently discarded. After the low-speed shaking of the plates for 10 min, 150 μL of dimethyl sulfoxide was added. The absorbance of each well was measured at 490 nm wavelength with a microplate reader (840–317500, NanoDrop One/OneC, Thermo, Waltham, Massachusetts, America).
Ultrastructural detection of EPCsCells were obtained by centrifugation at 1500 rpm for 10 min after digestion with trypsin. Next, a 0.5% glutaraldehyde fixative solution was added to the cells and incubated at 4°C for 10 min. For cell collection, centrifugation was performed at 10,000 rpm for 15 min, and then, 3% glutaraldehyde fixative was added slowly. Re-fixation was continued with 1% osmium tetroxide (GP18456, Leica, Wetzlar, Germany), and progressive dehydration was performed using pyruvic acid. The dehydrated sample was successively treated with a dehydrating agent and epoxy resin infiltrate (GP18010, Zhongjingkeyi, Beijing, China) to preserve the cellular microstructure. The immersed sample block was placed in a suitable mold, filled with an embedding solution, embedded, and heated to form a solid matrix. Ultrathin slices of approximately 50 nm thick were prepared using an ultramicrotome (EMUC7, Leica, Wetzlar, Germany), floated on the liquid surface of the knife bath, and then applied onto a copper mesh. The sections were stained with uranyl acetate (GS02624, Zhongjingkeyi, Beijing, China) for 10–15 min at 25°C and then with lead citrate (GZ02616, Zhongjingkeyi, Beijing, China) for 1–2 min and photographed with a transmission electron microscope (JEM-1400PLUS, JEOL, Akishima, Tokyo, Japan).
Statistical analysisThe collected data were analyzed using GraphPad Prism 8.0.1 (8.0.1, GraphPad Software, America, download site: https://www.graphpad-prism.cn) software, and the outcomes were depicted as mean ± standard deviation. Comparisons between groups were made using ordinary one-way analysis of variance with GraphPad Prism 8.0.1 software. Statistical significance was set at P < 0.05.
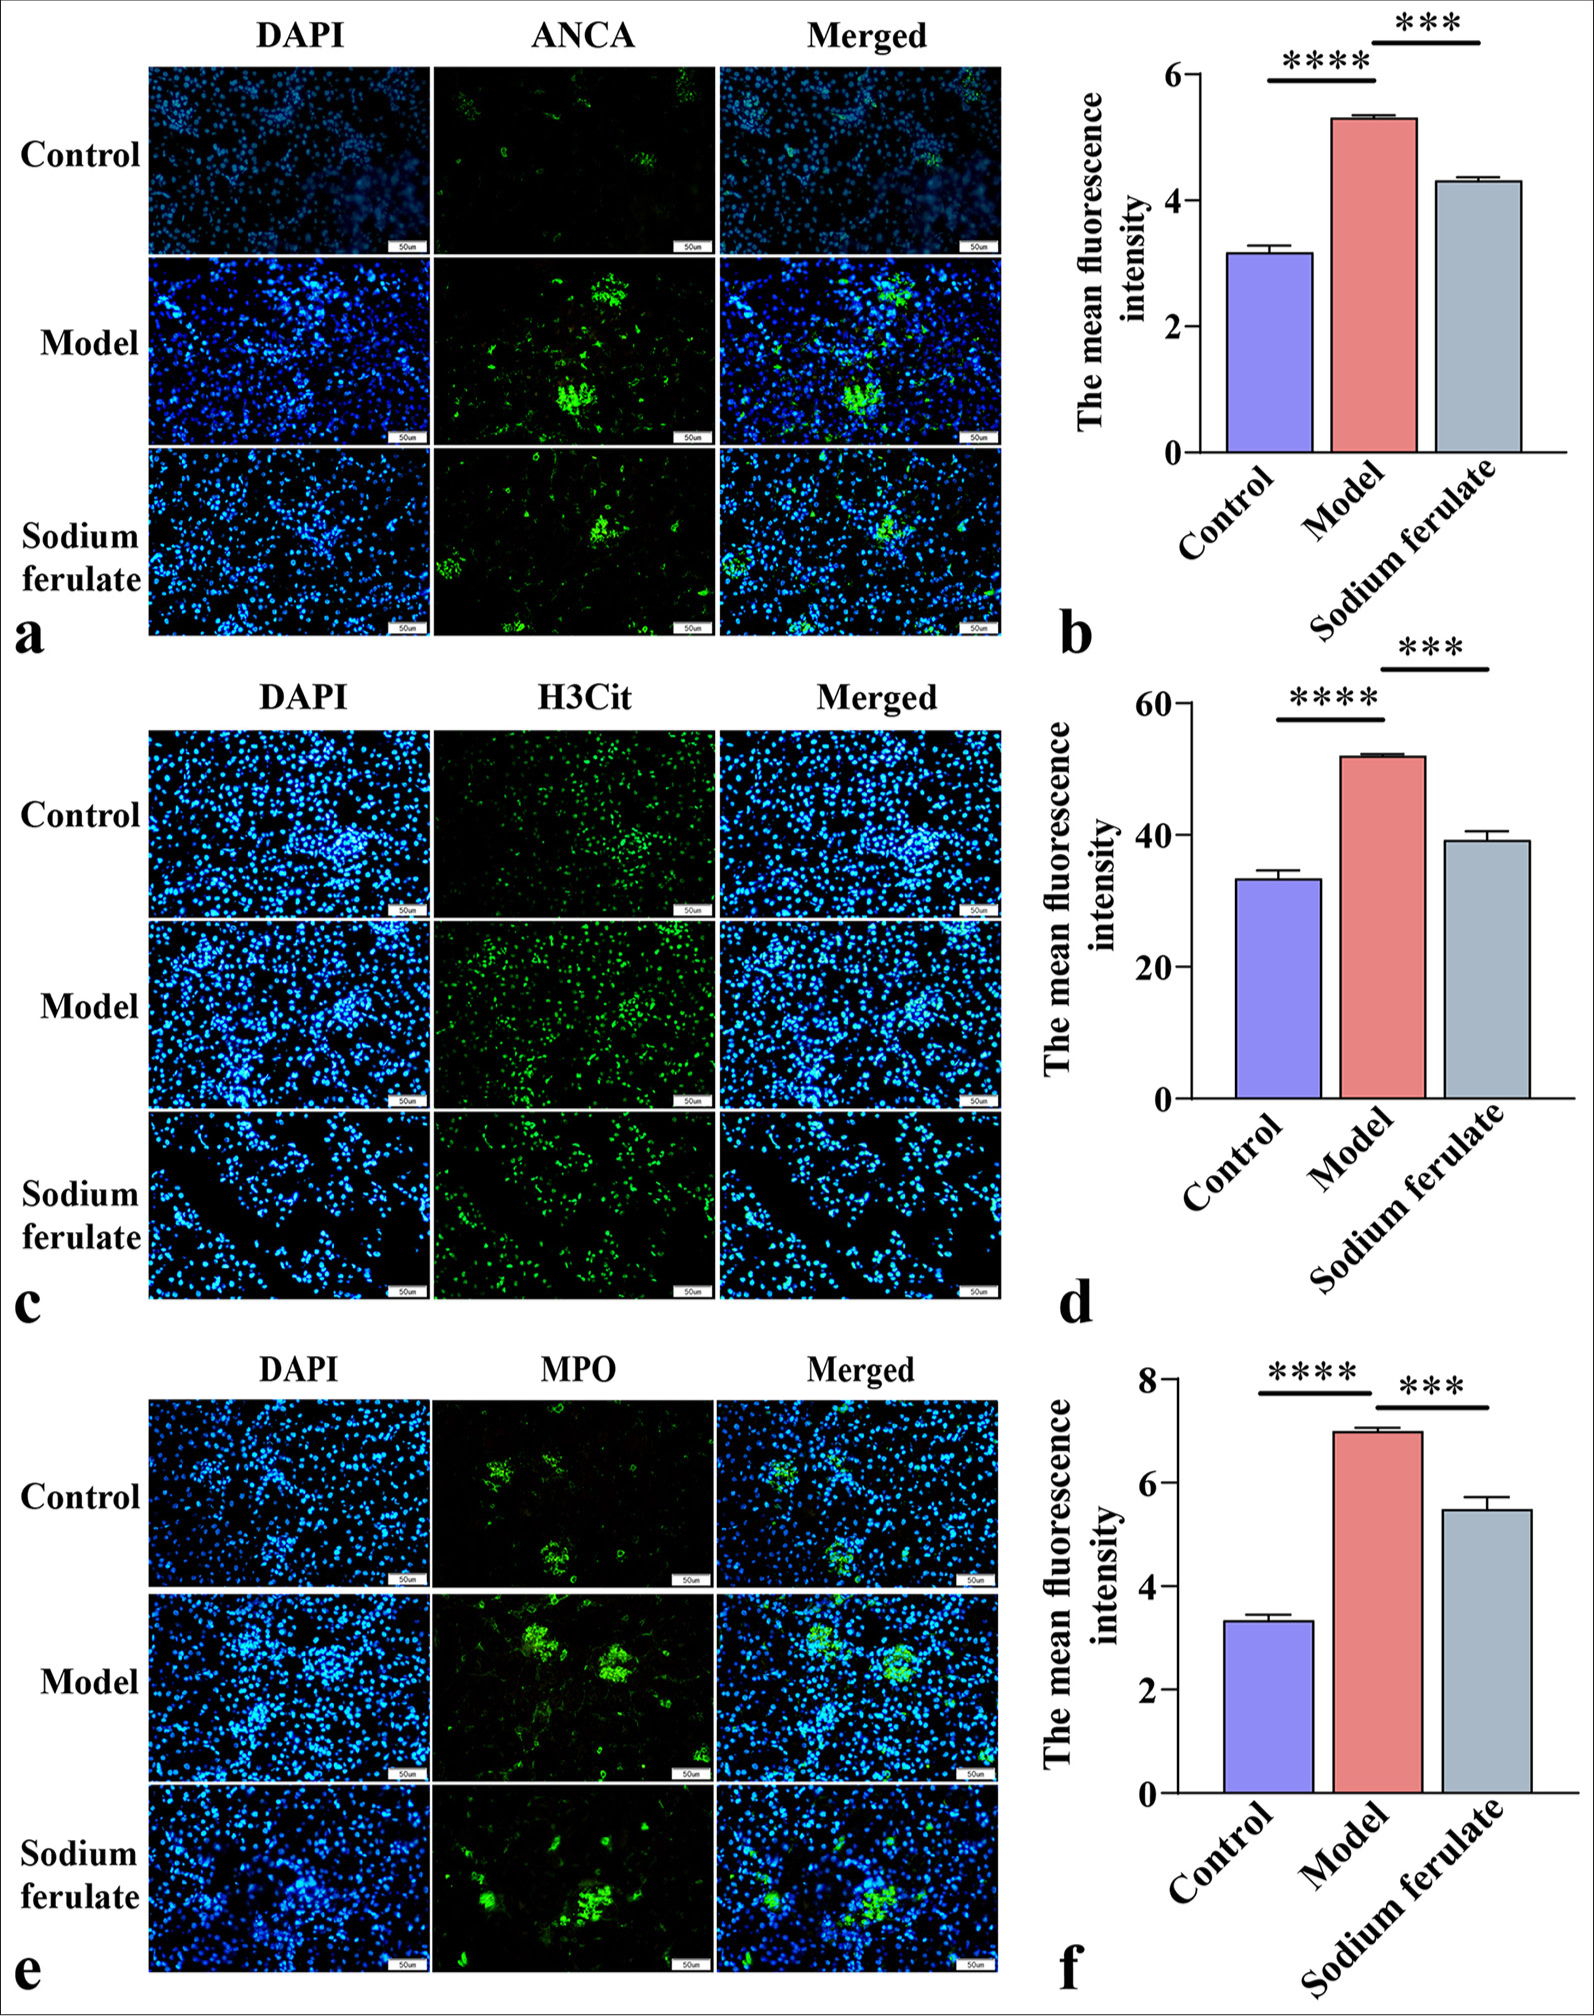
RESULTS Sodium ferulate inhibits NET formation in kidney tissues of MPO-AVV miceAfter establishing the mouse model of immune vasculitis, we observed that compared with normal mice, Rag2 KO mice in the MPO-AAV model group showed symptoms, such as decreased activity, listlessness, decreased appetite, weight loss, and dull hair, indicating that MPO-AAV model mice have immune vasculitis. Immunofluorescence staining showed that the ANCA fluorescence of MPO-AVV mice was greatly enhanced [Figure 1a and b], indicating the successful establishment of the MPO-AAV model. Subsequently, our results showed that after the mice were treated with sodium ferulate by gavage, the ANCA fluorescence in the sodium ferulate group decreased but remained considerably higher than that in the control group [Figure 1a and b]. Fluorescence detection results indicated that NETs in the MPO-AVV mice increased considerably compared with those in the control, and the fluorescence intensity of H3Cit and MPO increased remarkably. NET network formation was observed in the micrographs of MPO-AVV mice. Following gavage treatment with sodium ferulate, a decrease in NETs was observed, along with a reduction in the fluorescence intensity of H3Cit and MPO, compared to MPO-AVV mice [Figure 1c-f].
Export to PPT
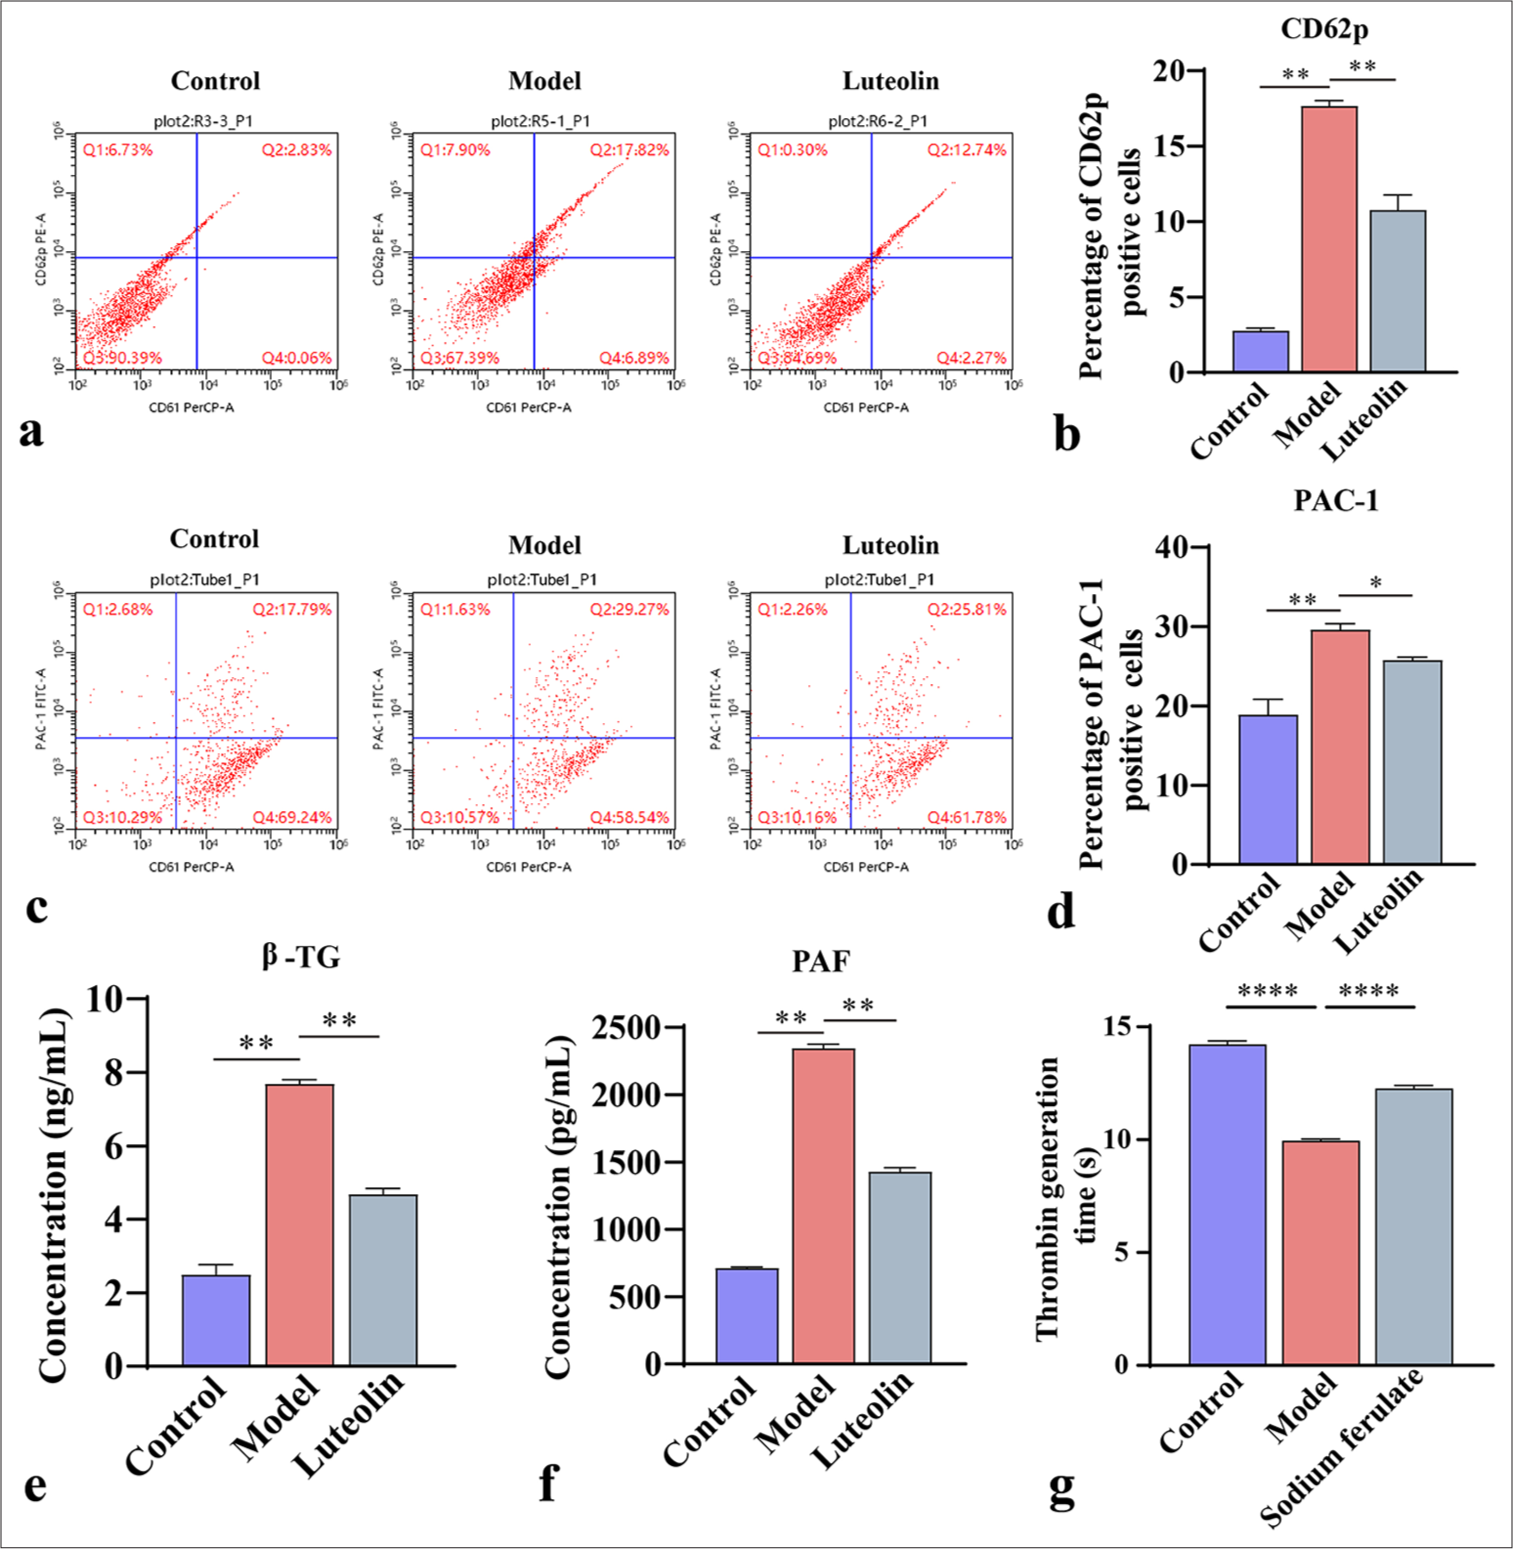
Sodium ferulate inhibits platelet activation in MPO-AVV miceCD62p and PAC-1 are markers of platelet activation. In this experiment, we used flow cytometry to determine the number of activated platelets in mice. As shown in Figure 2a-d, the CD62p- and PAC-1-positive cells in the model group increased dramatically, and the magnitude of platelet activation in the model group increased. After sodium ferulate treatment, the number of CD62p- and PAC-1-positive cells decreased, whereas the level of platelet activation in the cells decreased. Meanwhile, the concentrations of β-TG and PAF in the serum samples were measured using ELISA. β -TG is an active substance released after platelet activation, and PAF can induce platelet activation. The results showed that the concentrations of β -TG and PAF in the serum samples greatly increased in the model compared with the control. In the sodium ferulate-treated group, the concentrations of β -TG and PAF were significantly lower than those in the model group [Figure 2e and f]. Meanwhile, the assay of platelet thrombin generation time showed [Figure 2g] that the generation time in the model group was much lower than that in the control group. After sodium ferulate treatment, platelet thrombin generation time was recovered partially but still lower than that in the control group.
Export to PPT
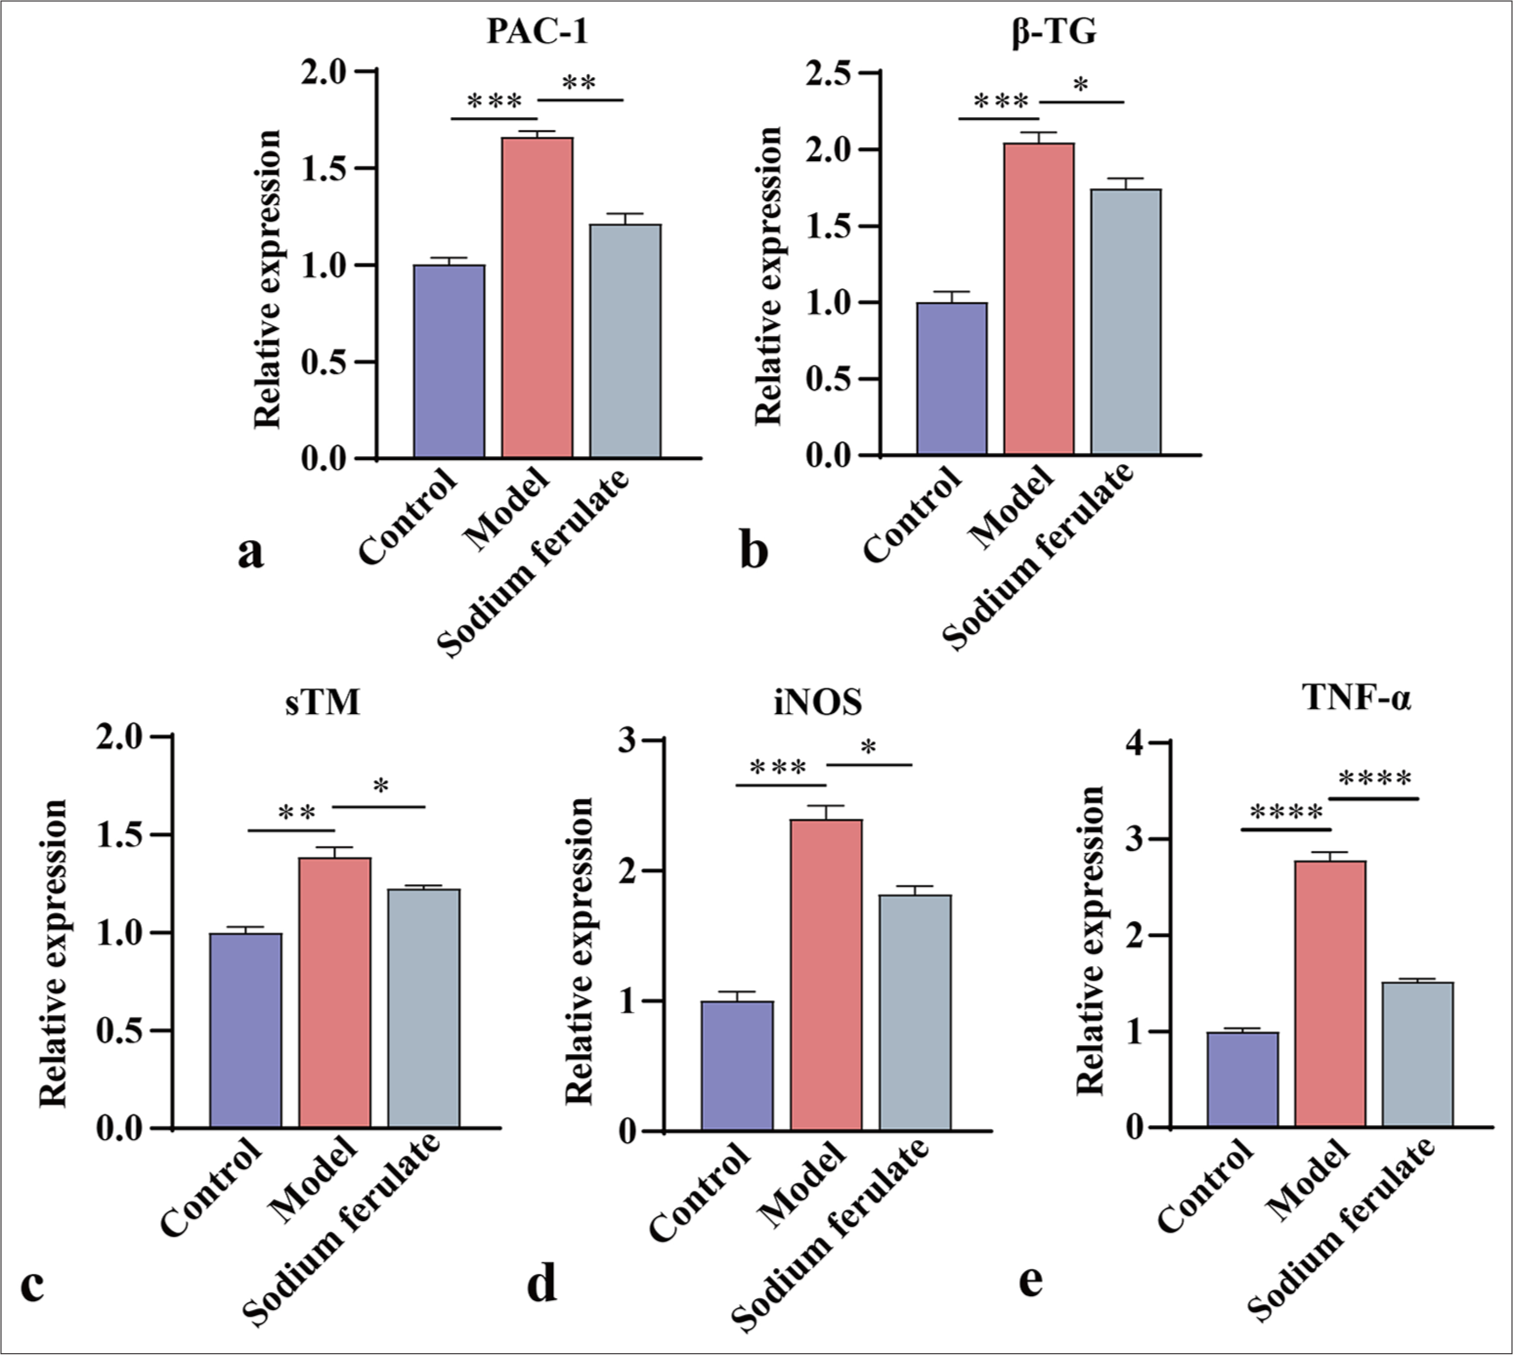
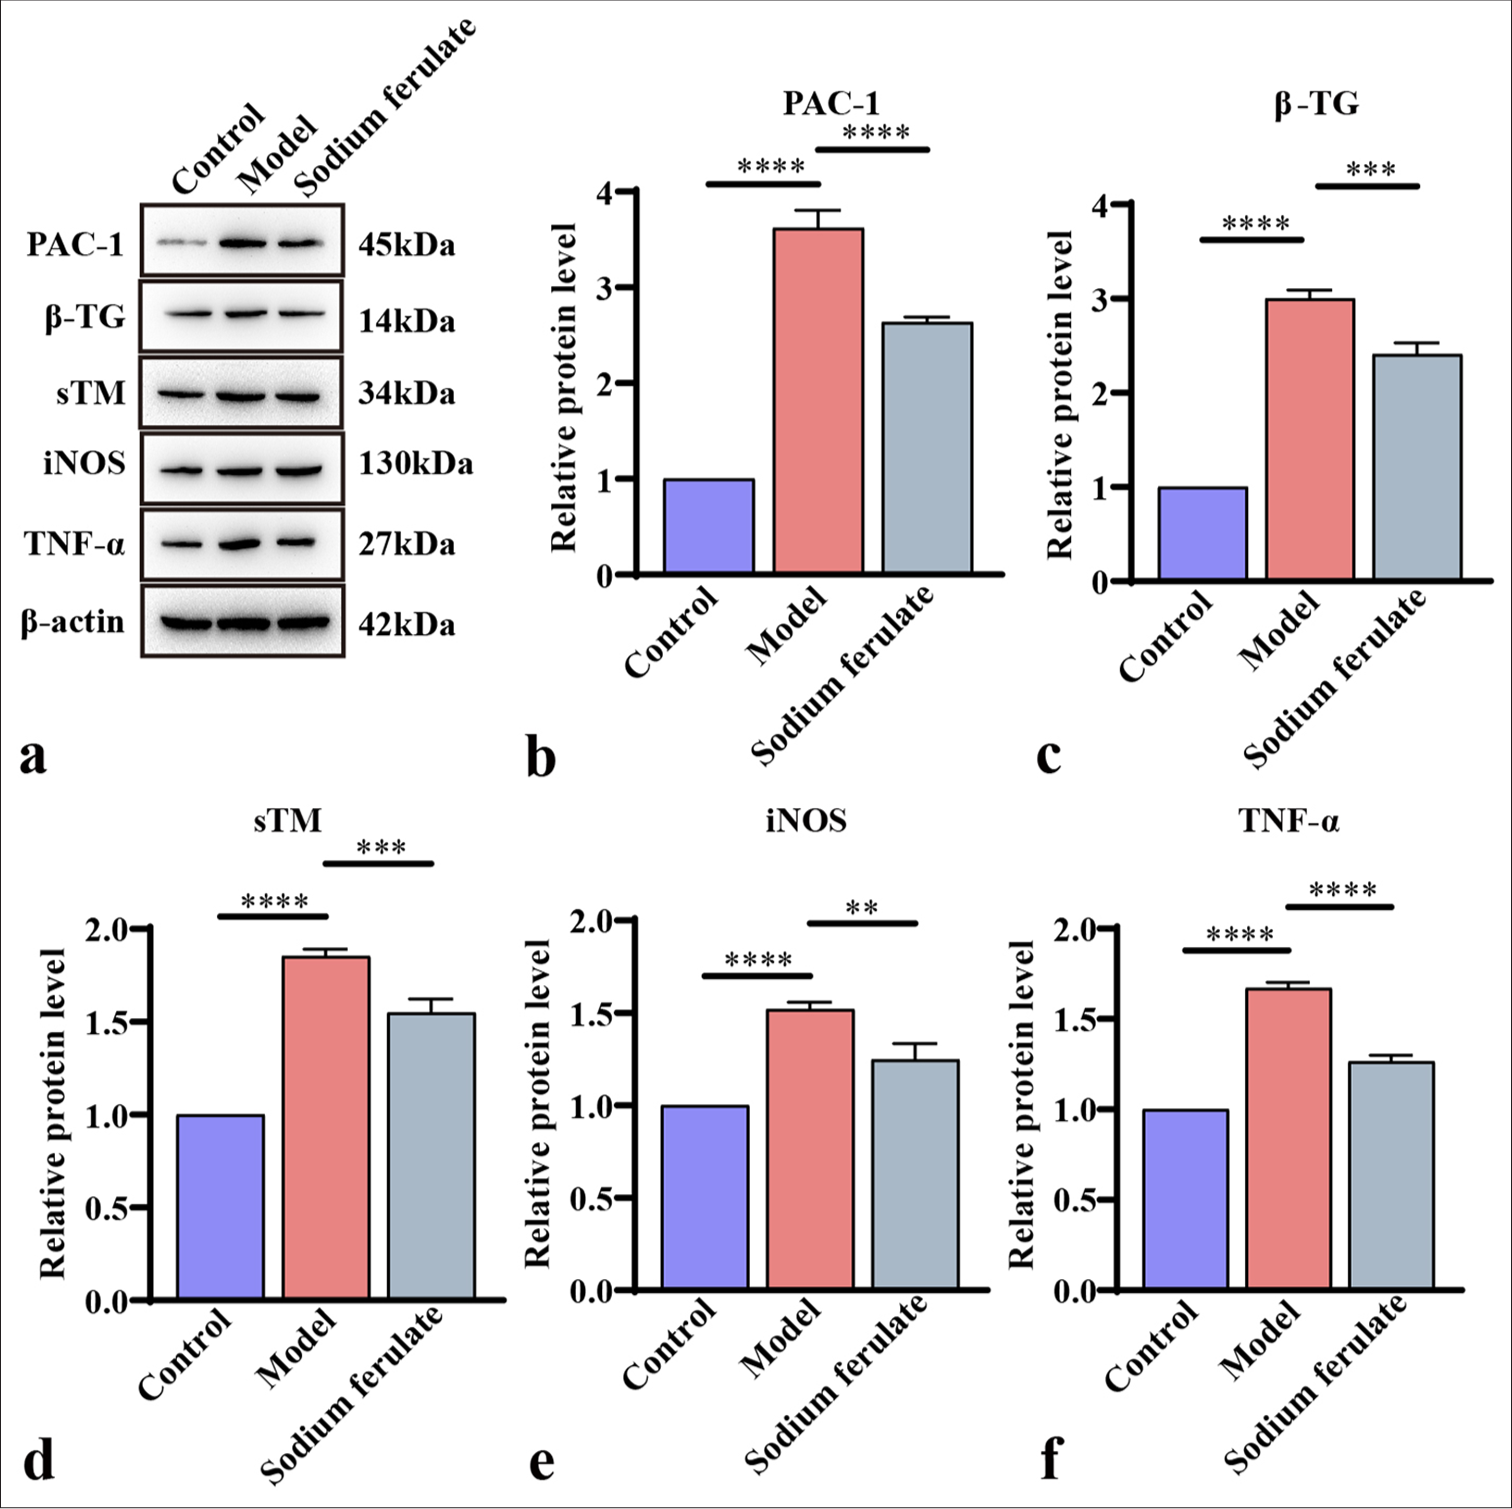
Sodium ferulate alleviates endothelial function damage of MPO-AVV miceFurthermore, the expression levels of PAC-1 and β-TG in the renal tissue were determined by qPCR and Western blot, and the activation status of platelets was evaluated. The expression levels of sTM, iNOS, and TNF-α were measured to study the effect of sodium ferulate on endothelial damage. Consistent with the above results, as illustrated in Figures 3a-e and 4a-f, compared with the control, the gene and protein content of PAC-1 and β-TG in the kidney tissue of immune vasculitis mice increased, and the level of platelet activation increased. After sodium ferulate was administered by gavage, the expression levels of PAC-1 and β-TG in renal tissue were decreased, and the platelet activation state was inhibited. sTM, iNOS, and TNF-α gene and protein expression levels were greatly enhanced in the model group compared with the control and decreased after sodium ferulate treatment. sTM, iNOS, and TNF-α gene and protein expression levels remained significantly elevated relative to those in the control [Figures 3a-e and 4a-f].
Export to PPT
Export to PPT
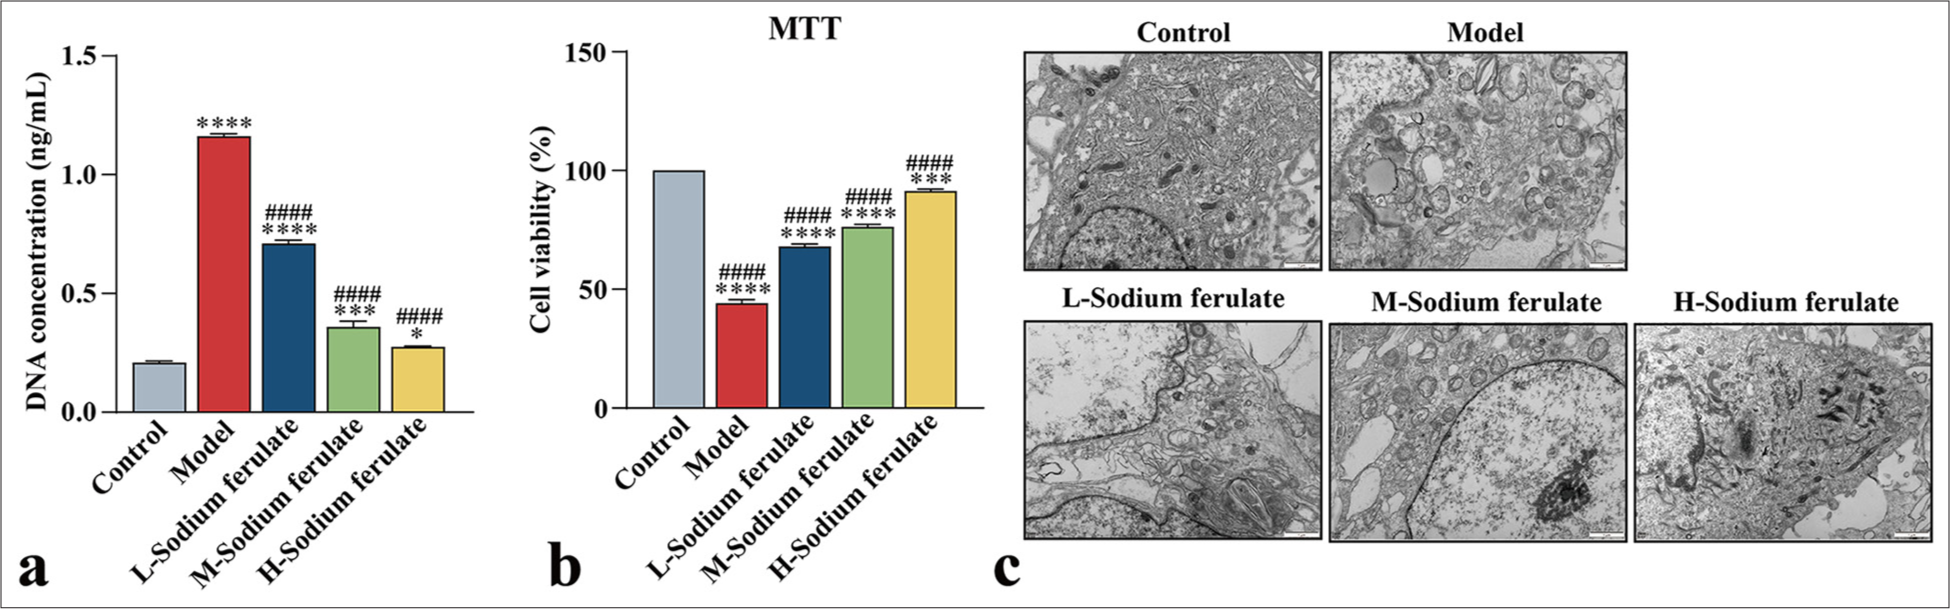
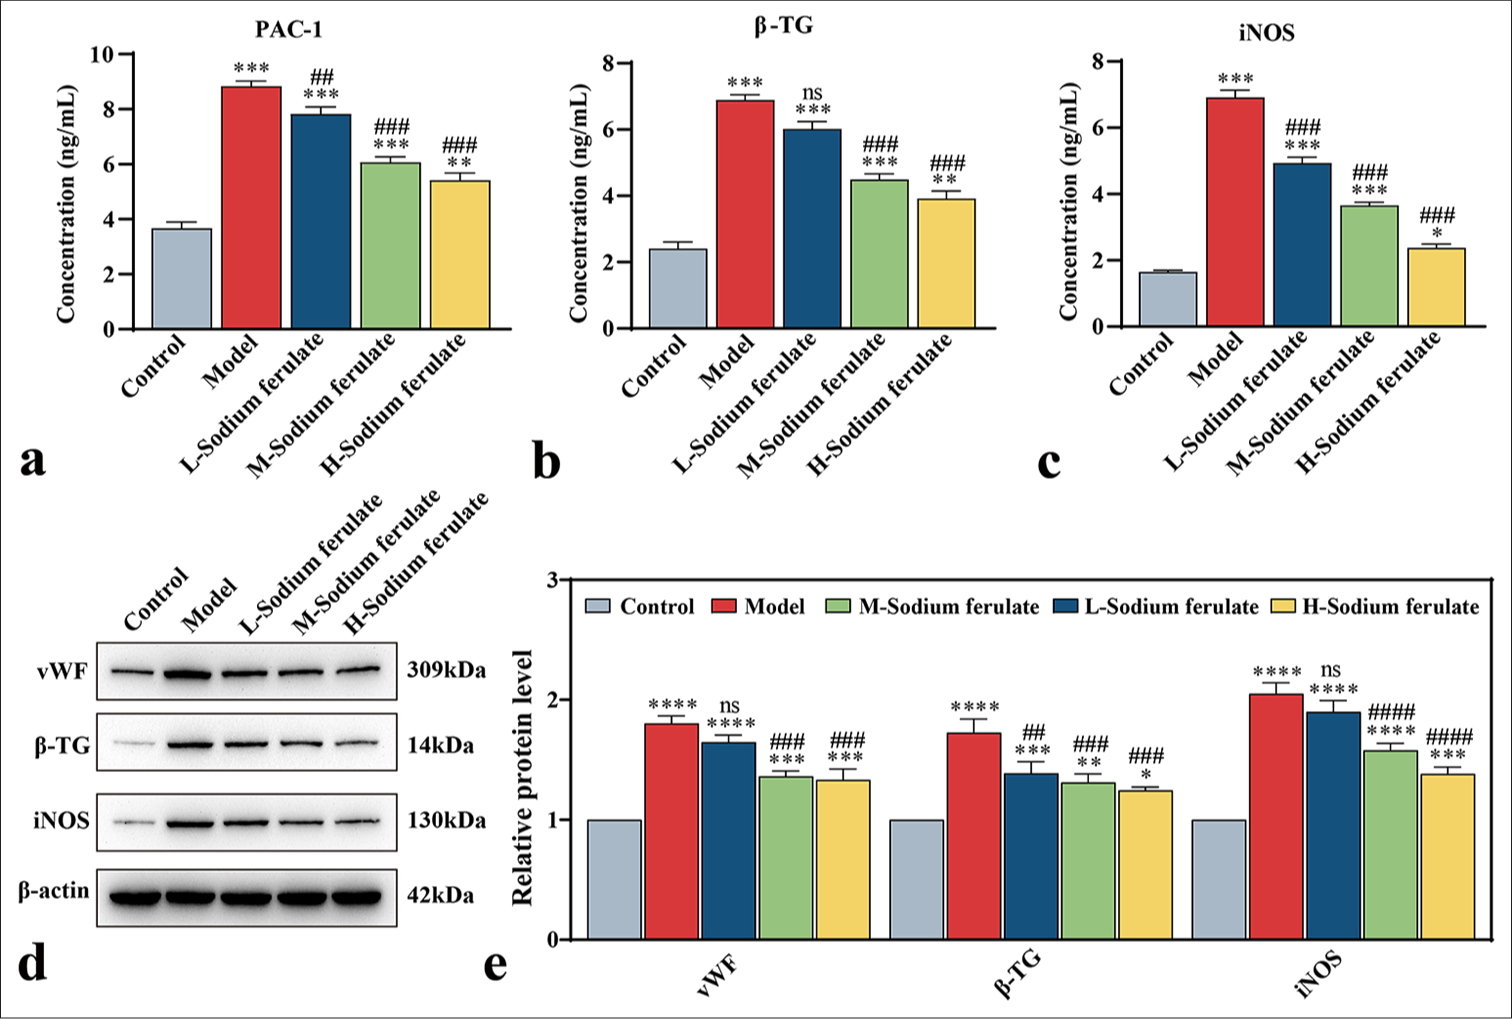
Efficacy of sodium ferulate on EPCsTo explore the efficacy of sodium ferulate in endothelial dysfunction at the cellular level, we used the collected peripheral blood of 30 patients with vasculitis, and EPCs from the peripheral blood were obtained by density gradient centrifugation and cultured. The resulting EPCs were identified and detected for mycoplasma infection, which showed no mycoplasma infection. The cultured cells were stimulated at different serum concentrations, and the effect on the endothelial function of different groups was determined. Similarly, in the model group, the release of NETs in EPCs treated with serum samples from patients with vasculitis considerably increased, and sodium ferulate suppressed the release of NETs in a concentration-dependent manner. As the concentration of sodium ferulate increased, the inhibitory effect improved [Figure 5a]. The MTT assay was used in determining the survival rate of the EPCs, and the findings indicated that sodium ferulate ameliorated the cell survival rate of EPCs, in contrast to the model [Figure 5b]. The ultrastructure of EPCs was observed by transmission electron microscopy, and the images displayed in Figure 5c] show that different degrees of mitochondrial swelling and endoplasmic reticulum expansion existed in the groups compared with the control. The concentrations of PAC-1, β -TG, and iNOS in the model were substantially increased but decreased after sodium ferulate treatment, showing a dose-dependent response to the concentration of sodium ferulate [Figure 6a-c]. vWF, β -TG, and iNOS protein expression in the tissue was determined by western blotting, as illustrated in [Figure 6d and e]. Compared with the control group, the protein expression of vWF, β -TG, and iNOS was observed in the model group, and sodium ferulate reduced the expression of vWF, β -TG, and iNOS protein in the tissues.
Export to PPT
Comments (0)