
Remember me

Of the total of 276 patients who met the inclusion criteria, there were 269 with follow-up data at 6 months and 229 at 12 months. Patients lived primarily on the south and west sides of Chicago (Fig. 1). Of the 276 patients included in the analysis, men represented 72% of the cohort, and the mean age was 77 ± 10 years. A total of 222 (80%) patients were in the LIG, and 54 (20%) patients were in the HIG. The overall cohort consisted of 37% Black patients, with the LIG and HIG composed of 43% and 15% Black patients (p < 0.001), respectively (Fig. 2). Table 1 demonstrates baseline demographics and clinical characteristics of the overall cohort as well as the characteristics within each income group. Except for the use of sodium-glucose co-transporter 2 inhibitor (SGLT2i), there were no significant differences in baseline characteristics between the LIG and HIG.
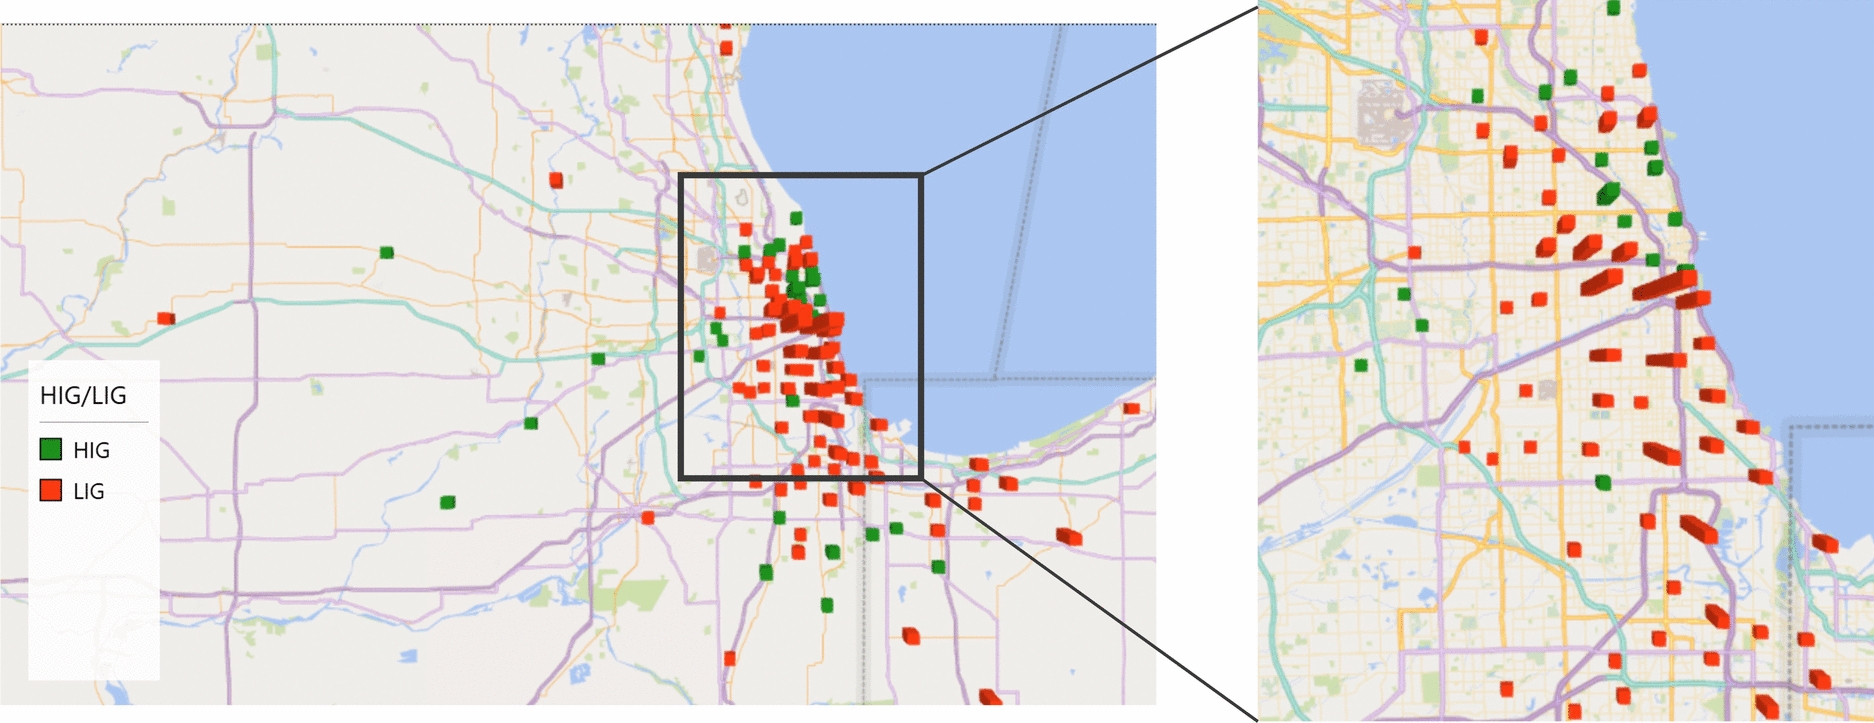
Fig. 1
Geographic distribution of patient’s home zip codes by income group. A representative map of the Chicagoland area demonstrates where patients who underwent transcatheter aortic valve replacement (TAVR) reside and their respective income group (high-income group (HIG) and low-income group (LIG))
Fig. 2
Race breakdown of cohort by income group. Three pie charts show the racial breakdown of the overall cohort, the high-income group (HIG), and the low-income group (LIG). The LIG demonstrates a larger percentage of Black and Hispanic patients
Table 1 Baseline demographics of cohortAs for the primary outcomes, we did not observe a difference between the HIG and the LIG. A higher proportion of patients in the HIG experienced conduction abnormalities at 12 months (19% vs. 9%, p = 0.04). Post-procedure MACE events did not differ between HIG and LIG at 6 months (6% vs. 8%, p = 0.8) and at 12 months (9% vs. 12%, p = 0.6) (Table 2).
Table 2 6-Month and 12-month outcomes by income groupA sub-analysis looking at the relationship by race was performed. Among the Black patients, we observed no difference in primary or secondary outcomes by income group. Similarly, there were no differences in the primary outcomes among White patients by income. White patients in the HIG had a numerically higher rate of CHF exacerbations at 12 months (13% vs. 9%, p = 0.6) than White patients in the LIG. White patients in the HIG experienced higher rates of post-procedure bleeding at 6 months (8% vs. 5%, p = 0.5) when compared to the LIG, but did not reach statistical significance.
Additional analyses utilizing median household income as a continuous variable, education levels, or the federal poverty level did not demonstrate any differences in primary or secondary outcomes of interest. Furthermore, there were no disparities by race or income group among patients lost to follow-up.
SVIWe did not observe any significant differences in SVI between patients experiencing a MACE event compared to those who did not at both 6 months (0.77 vs. 0.70, p = 0.18) and 12 months (0.74 vs. 0.69, p = 0.47). Table 3 summarizes the mean SVI between those who had an adverse outcome and those who did not. Those experiencing bleeding events at all time points (periprocedural bleeding (0.83 vs. 0.71, p = 0.01), 6-month (0.79 vs. 0.70, p = 0.07), and 12-month (0.78 vs. 0.69, p = 0.05) had higher SVI as compared to those that did not have a bleeding event, with only periprocedural bleeding reaching statistical significance. Those experiencing rehospitalizations at 30 days had higher mean SVI when compared to those not having rehospitalizations in the same interval (0.77 vs. 0.70, p = 0.07), although this finding was not significant at a p < 0.05 level.
Table 3 Social Vulnerability Index (SVI) and outcomes
Comments (0)