
Remember me


A total of 42 genomes were obtained, among them 38 samples were above 100 and the rest were their relatives. Among the 38 long-lived individuals, 20 were females, 17 were males, and the gender information for one individual was unavailable. This gender distribution aligns with the fact that the trend of increased longevity in women [26,27,28].
For the study, out of 38, we chose 3 centenarians and 18 supercentenarians, a total of 21 genomes for the downstream analysis. The genomes were filtered based on the completeness of genomic sequence. This include thirteen females and the rest eight males belonging to several race namely, Caucasian, African, Hispanic, and Ashkenazi Jewish. The Caucasians were found to be high in our dataset, comprising 17 samples. The age ranged from 106 to 117, with the oldest individual being a Caucasian female. The list of the samples used for study is given in Table 1.
Table 1 Sample IDs with Corresponding Gender, Race, and AgeThe variants such as SNPs, insertions, and deletions found in each sample were stored in Variant Call Format (VCF) files. Variants from a variety of sites on the reference genome can be quickly retrieved using an index of the VCF file, which is typically stored in a compressed format. The genome is organized into 22 autosomal chromosomes, labeled 1 through 22, two sex chromosomes, X and Y and a mitochondrial DNA, M. The total genome size was found to be 3,095,693,981 bp. The variants from each sample were extracted. The variant counts signify the number of genetic variations or mutations observed in each chromosome of individuals. The count of variants for each sample was found and the highest was found to be 6,239,943 for 31_113_M_FM6ZGT6 (African) and lowest 5,210,831 for 18_113_F_8X1QRI2 (Caucasian). Similar studies on the genomes of female and male supercentenarians obtained 3,334,819 variants for the female and 3,476,407 variants for the male [14]. The variant count for each sample chromosome wise is shown in Supplementary File 2. Among all autosomes, chromosome 2 had the highest number of variants with an average of 431,140.
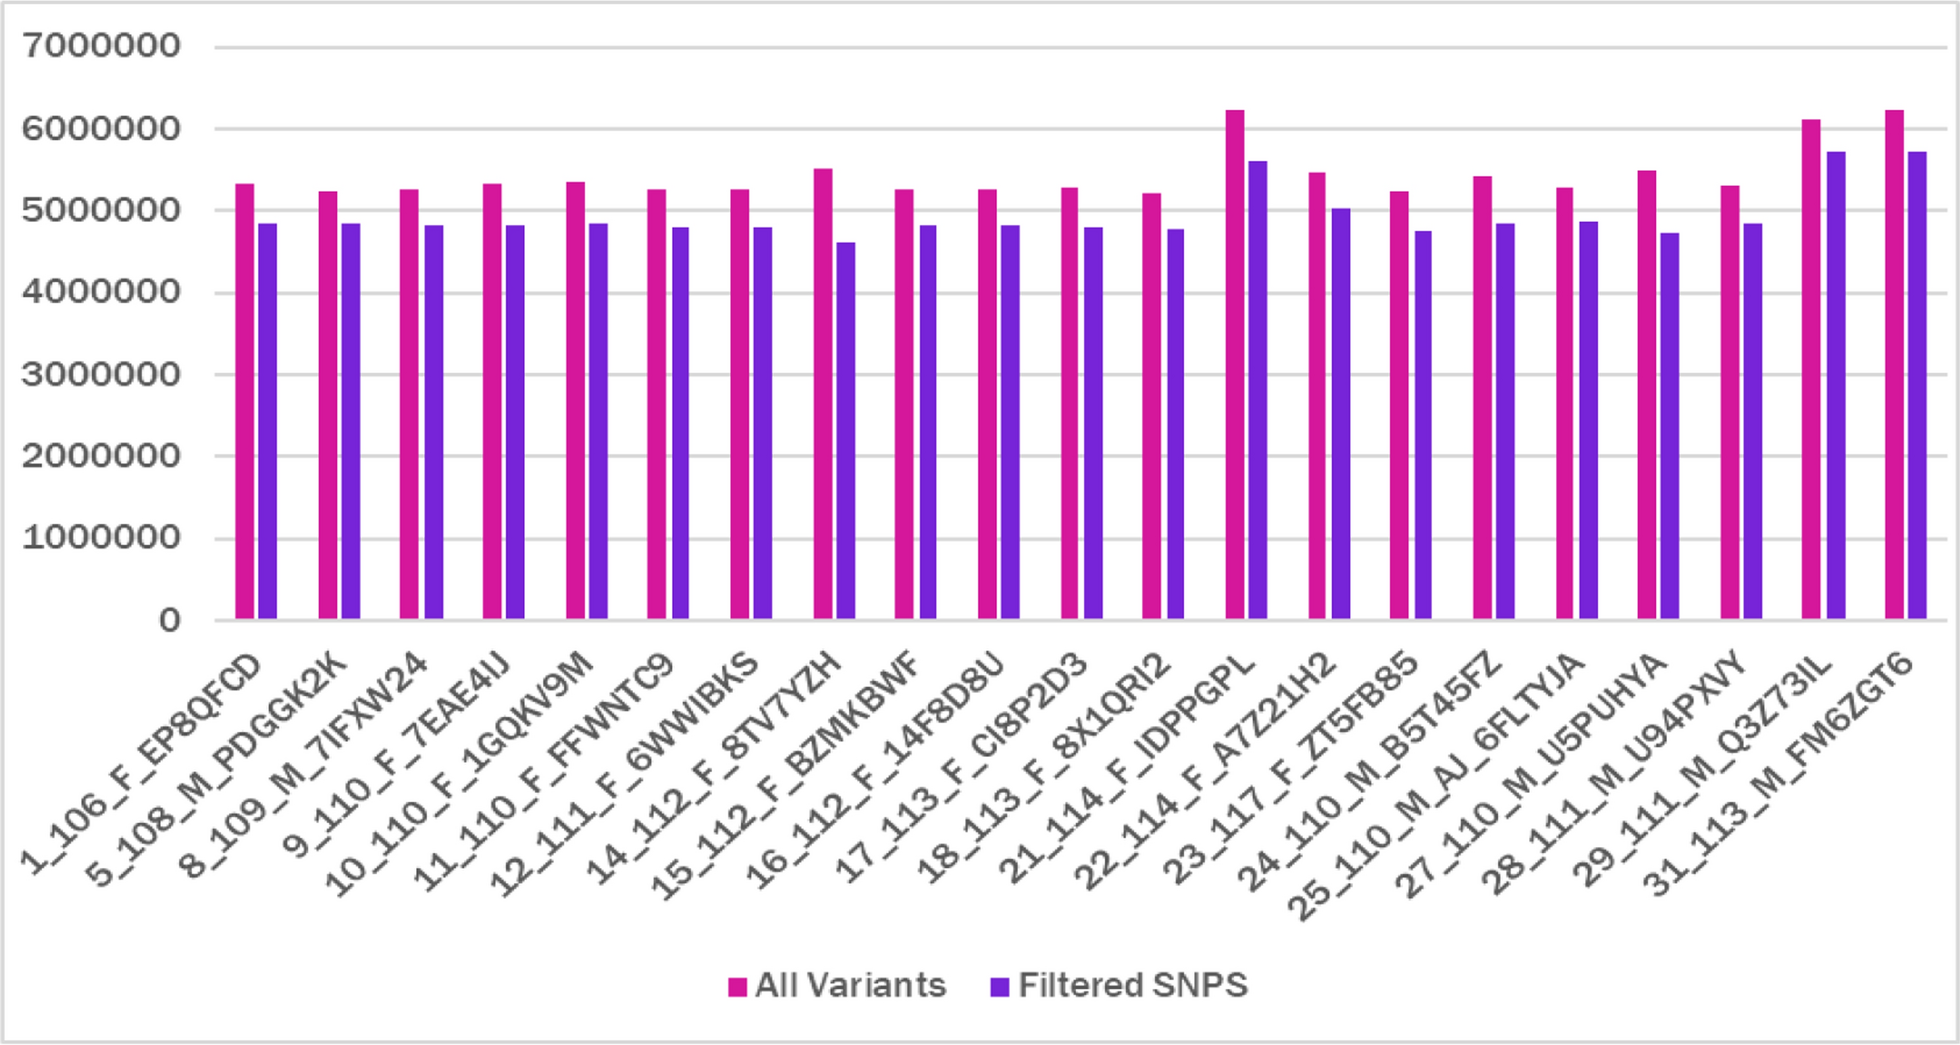
The chromosomewise filtered variants for each sample were extracted from the VCF files to eliminate low-quality SNPs and we found that approximately 91% of the variants were filtered (Fig. 1). We found the count of filtered variants (Supplementary File 3) and it was higher for Africans 5,717,868 (31_113_M_FM6ZGT6) and 5,717,488 (29_111_M_Q3Z73IL). Caucasian genome 14_112_F_8TV7YZH was lowest with 4,614,969 filtered variants (Fig. 2). The count of filtered variants was not different for different genders but they differed among races. Each genome had a total filtered count ranging approximately around 4,614,969 to 5,717,868 throughout all the chromosomes. Chromosome 1 being the largest chromosome had more number of variants and the smallest chromosome Y had the least, but this trend was not consistent among all samples. The mitochondrial genome had a least variant count when compared to the rest of the chromosome and this is due to the smaller size of the genome. In other words, chromosome M had a higher percentage of variant count of an average of 0.2. (Supplementary File 4). It has been reported that the mitochondrial DNA is more sensitive to oxidative damage and has a greater mutation rate than nuclear DNA due to the nonexistence of protective histone proteins, restricted DNA repair activities, and a high rate of Reactive oxygen species (ROS) formation in mitochondria.
Fig. 1
Comparison of Filtered Variant Counts with Total Variants for Each Individual. Filtering was performed to exclude low-quality SNPs, retaining only high-confidence variants for downstream analysis
Fig. 2
Chromosome-Wise Graphical Representation of Filtered Variant Counts
Count of common, unique, and shared SNPs in each datasetThe samples with filtered SNPs were categorized into three datasets, centenarians (3), supercentenarians (18) and both centenarians and supercentenarians (21) based on the age. The common, shared and unique SNPs were found using R program mentioned in Supplementary File 1. Common SNPs are those genetic variations found in all individuals within the dataset. Shared SNPs are genetic variations that are present in two or more individuals. Unique SNPs are identified as genetic variations that appear in only one individual, highlighting a distinct genetic characteristic exclusive to that individual. The count of common single nucleotide polymorphisms (SNPs) was relatively lower compared to the number of unique SNPs. Interestingly, the count of shared SNPs emerged as the highest of all three datasets (Fig. 3).
Fig. 3
Counts of Common, Unique, and Shared SNPs in Each Dataset (Centenarians, Supercentenarians, and Both)
Since the major theme was to find the SNPs that were found among the 21 individuals, the common SNPs were used for the further studies. To ensure the accuracy of the SNP counts, the sum of unique, common, and shared SNPs must be equal to the total sorted SNPs. This verification step helps to confirm the integrity of the dataset and ensures that all SNP categories have been accurately accounted for the analysis. We obtained 842,946 variants that were common among all the 21 supercentenarians. Of the 842,946 variants, some variants showed transition and others transversion. The altered allele with same change (either all transition or all transversion) were only selected, which was about 89.5%, totaling 754,520 SNPs. All the SNPs common to centenarians and supercentenarians are provided in Supplementary File 5.
Furthermore, the 754,520 SNPs which had same variant in all the 21 supercentenarians were annotated using SNP nexus tool, which focuses to delve deeper into the genetic mechanisms underlying longevity, offering valuable insights into the genetic landscape of centenarians and supercentenarians.
Population frequency assessment and annotation of the common SNPsThe population frequency of the common SNPs was compared with the 1000 Genomes Project, which revealed 564,572 variants. Of these, 2540 variants exhibited a minor allele frequency (MAF) less than 1%, and 1359 variants were entirely absent, i.e., not reported in the database/might be absent in the given population. In addition, the comparison of common SNPs with gnomAD showed 8290 variants, of which 277 had a MAF below 1%, and 66 variants were not found in the dataset (Supplementary File 6). The data shows the presence of SNPs with low frequency or complete absence in these public databases, which helps us rule out the presence of common SNPs, and suggests the possibility of rare variants specific to our supercentenarians’ dataset.
In order to annotate the common SNPs, we used Ensembl as an annotation system and annotated a total of 1,652,112 variants (Supplementary File 7), out of which 166,416 variants were found to be novel variants (Supplementary File 8). Removal of duplicates yielded, 1,607,122 SNPs with different transcripts, among which 162,589 were found to be novel. The annotation system provides predicted functions of the variants, which includes, coding, non-coding, intronic, non-coding intronic, non-coding intronic (splice site), 3’ downstream, 5’ upstream, 3’ untranslated region (UTR), and 5’ UTR. The categorization of these variants into various functional regions reveals critical insights into the genetic architecture and potential implications for gene regulation and function. The intronic, intronic (splice site), non-coding, non-coding intronic and non-coding intronic (splice site) fall under the non-coding region. Most of the SNPs were found in this region, with a substantial count of 1,444,421, among which 142,563 are novel SNPs, and, without duplicates, the count was 1,405,061 and 139,250, respectively. This indicates that a significant portion of the genetic variations has occurred within non-coding regions. A total of 190,713 SNPs without duplicates were found in the regulatory regions such as 3’ downstream, 5’ upstream, 3’ UTR, and 5’ UTR, among which 22,458 SNPs were found to be novel, suggesting potential regulatory effects on gene transcription. In contrast, a low number of SNPs was found in the coding region of about 11,736, among them 889 were found to be novel (Fig. 7), and 11,348 were obtained after the removal of duplicates, among which 881 were found to be novel (Fig. 4). This indicates a lower frequency of variations are directly affecting the protein-coding or mRNA stability, which aligns with the idea that coding regions are under strong selection to maintain protein function. However, the variants in coding regions are more likely to have deleterious or advantageous effects. In addition, the novel coding SNPs identified in this study could provide valuable insights into genetic variations that potentially affect or augment protein function or stability, which may be relevant to understanding disease mechanisms or other phenotypic outcomes. The amino acid changes are more likely to have functional consequences, potentially contributing to the phenotypic diversity observed among supercentenarians.
Fig. 4
Distribution of all and novel SNPs across genomic regions annotated using Ensembl. The total number of SNPs analyzed was 1,607,112 among them 162,589 were novel. The figure shows SNP counts in different genomic regions including coding, intronic, UTRs, upstream/downstream, and splice sites
The 11,736 SNPs in the coding region were analyzed further based on their functional impact, and were classified into approximately 20 distinct functional categories, including synonymous, non-synonymous, frameshift, and other types (Fig. 5). Most of the SNPs fall under synonymous, non-synonymous and the rest include Frameshift, Peptideshift, Pepshift: stop-gain, pepshift: stop-loss, Nonsyn: stop-loss, Nonsyn: stop-gain, frameshift: stop-loss, frameshift: stop-gain, coding-intronic-coding, and coding-intronic. An asterisk (*) preceding these labels denotes that the corresponding reference protein is incomplete, typically lacking a stop codon. Frameshift and peptide shift mutations disrupt the reading frame, altering protein sequences, while stop-gain and stop-loss mutations either truncate or extend proteins. Variants like coding-intronic-coding, coding-intronic, pepshift: stop-loss, nonsyn: stop-loss, and nonsyn: stop-gain affect gene expression and protein function through different mechanisms.
Fig. 5
Detailed functional analysis of coding variants, including novel variants annotated using Ensembl. The asterisk (*) preceding the label indicates that the reference protein is incomplete (e.g., missing a stop codon)
The synonymous SNPs in our dataset were 5091 (5291 with duplicates), which do not alter the encoded amino acid sequence. Conversely, non-synonymous variants, where a single nucleotide change results in a different amino acid, thereby altering the whole structure. Among the 4,980 non-synonymous SNPs (5130 with duplicates), we also found 389 nonsynonymous variants that have not been reported so far (Fig. 7). Synonymous variants, although they do not change the amino acid sequence, can still impact gene regulation and mRNA stability. In addition, the identification of novel SNPs in coding regions provides valuable insights into the genetic factors that may contribute to longevity. Further functional studies are needed to explore the specific roles of these variants in protein function and their potential impact on the health and lifespan of supercentenarians. Notably, two non-synonymous SNPs, rs412051 [29] and rs9885916 [30], have been previously associated with longevity in earlier studies. Their presence in our dataset validates the robustness of our variant filtering approach and supports the biological relevance of our findings.
In addition, the non-synonymous variants identified in our dataset were also evaluated for their population frequency using the 1000 Genomes Project and gnomAD. In both databases, a total of 2,133 non-synonymous variants were matched. Within the 1000 Genomes dataset, 24 variants were found to have a minor allele frequency below 1%, and only 2 variants were completely absent. In contrast, gnomAD identified 69 variants with MAF < 1% and 16 variants that were entirely absent. Among the novel non-synonymous variants, 182 were mapped in gnomAD, of which 16 had a MAF below 1%, and 6 were not reported at all. The list of variants in each category and their corresponding MAF has been shown in Supplementary File 9. Notably, a small subset of variants failed to return any annotation results from either database. The rare SNPs with MAF < 1% may not be the common SNPs found in the population and these variants could potentially alter the structure of the protein and thereby play an advantageous role for the exceptional longevity. However, we acknowledge that these findings should be experimentally confirmed.
Pathway enrichment analysis of non-synonymous variantsTo gain functional insights into the potential biological impact of the identified non-synonymous SNPs, we performed a pathway enrichment analysis using the Reactome. A total of 1,380 pathways were found to be enriched with the non-synonymous SNPs. Of these, 148 pathways were statistically significant (p-value < 0.05). Furthermore, when focusing on the novel non-synonymous SNPs, we observed enrichment in 138 pathways, of which 34 were statistically significant (p-value < 0.05). The top 10 enriched pathways in both known and novel SNPs have been shown in Table 2. The most significantly enriched pathway was Extracellular matrix (ECM) organization (R-HSA-1474244; p = 5 × 10⁻⁶). Related sub-pathways, including Degradation of the extracellular matrix (R-HSA-1474228), Non-integrin membrane-ECM interactions (R-HSA-3000171) and ECM proteoglycans (R-HSA-3000178), were also significantly enriched. Subpathways in disease, which include Diseases associated with O-glycosylation of proteins (R-HSA-3906995), Infectious disease (R-HSA-5663205) and Diseases of glycosylation (R-HSA-3781865) were also found to be enriched. In addition, intracellular signaling by second messengers (R-HSA-9006925) and Olfactory Signaling Pathway (R-HSA-381753) were the major Signal Transduction pathways involved. The novel variants showed enrichment in the above mentioned few pathways along with metabolism of proteins (R-HSA-392499) and translation (R-HSA-72766). The genes and the variants associated with these pathways have been shown in Supplementary File 10. The pathway enrichment analysis suggests possible impacts on ECM remodeling processes, disease-associated pathways, Signal Transduction, sensory processing, Metabolism of RNA and proteins suggesting the SNPs are involved in core biological processes, and any alterations in these key pathways may play a role in supporting longevity.
Table 2 Enriched pathways associated with known and novel non-synonymous SNPs, including Reactome Pathway ID, description, parent process, p-value, number of genes involved, and number of mapped variantsPrediction of the deleterious effects of the non-synonymous variants using SIFTThe deleterious effects of the non-synonymous mutations were checked using SIFT score. Sorting Intolerant From Tolerant (SIFT) is the prediction score for non-synonymous substitution of reference amino acid with observed amino acid. The non-synonymous variants found in our dataset were categorized into different predicted functional classes based on their potential deleteriousness or tolerance. Supplementary File 11 contains the list of all and novel non-synonymous SNPs predicted using SIFT. The deleterious variants were predicted to have a significant negative impact on protein function, which totals about 208 SNPs (223 SNPs with duplicates) (Fig. 7). Among these deleterious SNPs, variants such as rs575564328, rs75029097, and rs11228733 using 1000 Genomes Project and rs61849494, rs150316320, rs575564328, and rs141207681 using gnomAD and few SNPs without dbSNP id (Supplementary File 12) was found to be < 1% in the population, suggesting these deleterious SNPs were not found to be common among the population. Additionally, 119 variants were categorized as "Deleterious Low Confidence", indicating a lower level of certainty regarding their detrimental effects. Conversely, the count of variants tolerated was very high (3,793 SNPs) suggesting a minimal impact on protein function. Furthermore, there are 973 variants categorized as "Tolerated Low Confidence", indicating a degree of uncertainty in predicting their tolerance. Surprisingly 39 novel variants were found to be deleterious (Fig. 6). By categorizing variants based on their predicted effect, we prioritized SNPs with deleterious effect for further investigations.
Fig. 6
SIFT-based classification of non-synonymous SNPs. 5,093 variants assessed, 208 were predicted as deleterious, 119 as deleterious with low confidence, 3,793 as tolerated, and 973 as tolerated with low confidence. Additionally, 380 novel SNPs were predicted out of which, 39 were deleterious, 10 deleterious with low confidence, 288 tolerated, and 43 tolerated with low confidence
The 208 deleterious transcripts (223 with duplicates) had 110 deleterious SNPs including the 16 novel deleterious SNPs (Fig. 7). Deleterious transcripts represent distinct transcript isoforms that contain SNPs predicted to have harmful effects. A single SNP may be associated with multiple isoforms of a transcript and for each transcript it is classified as deleterious. We compared the 110 non-synonymous deleterious SNPs identified in this study with previously reported longevity-associated variants from two studies [31, 32]. Lescai et al., 2009 analyzed five candidate genes and identified only six longevity-associated SNPs, most of which lacked replication in follow-up datasets. Sebastiani et al., 2013 emphasized the role of multi-marker genetic signatures (281 SNPs across 130 genes) in predicting exceptional longevity, particularly in centenarians aged ≥ 106 years. Notably, none of the SNPs identified in our study overlapped with the markers reported in either study. This lack of overlap suggests the presence of novel genetic variants in our dataset. Furthermore, some of the identified SNPs are located in genes functionally linked to aging or cellular stress response, which may provide new insights into the molecular basis of healthy aging. References for aging-related associations have been incorporated into Supplementary File 13.
Fig. 7
The number of variants found in different categories, including coding regions, non-synonymous, deleterious transcripts, deleterious SNPs, and associated genes. The counts are shown for both All and Novel datasets, with and without duplicate. Deleterious transcripts refer to individual transcript isoforms that harbor SNPs predicted to be deleterious. A single variant may be counted multiple times if it is predicted to be deleterious in multiple isoforms of a transcript
The 110 SNPs were associated with 79 genes and the list of genes is provided in Supplementary File 11. These genes are involved in a diverse biological processes. Several genes have been reported to be associated with longevity and the aging process, which include MDM1, [33] and KMT2C [34].
One key group of genes involved in longevity is related to the mitochondrial function and the cellular stress response pathways. Mitochondria are essential organelles that generate energy for the cell and are also involved in various signaling cascades. Disturbances in mitochondrial function have been linked to the aging process and age-related diseases [2]. For instance, the gene TIMM23 encodes a subunit of the translocase of the inner mitochondrial membrane and has been implicated in maintaining mitochondrial homeostasis [35]. Similarly, the gene NEMF is involved in the mitochondrial unfolded protein response, a mechanism that helps maintain protein homeostasis [36]. The activation of unfolded protein response promotes longevity in some cases [37].
The gene KMT2C (also known as MLL3) encodes a histone methyltransferase that catalyzes the methylation of lysine 4 on histone H3 (H3 K4). Histone modifications, such as H3 K4 methylation, have been implicated in the regulation of gene expression and longevity [38]. Disruption of the histone methylation machinery can lead to dysregulation of transcriptional programs and contribute to aging [39].
Genes associated with longevity are also involved in regulating cellular signaling pathways, such as nutrient sensing and stress response [40, 41]. This include MAP2K3, and UBC. The gene TNK1 encodes a non-receptor tyrosine kinase that has been associated with the regulation of cellular signaling pathways involved in aging and longevity. Variants in several genes encoding zinc finger protein were obtained, such as ZNF214 that functions as a transcriptional regulator. The gene ZNF534 also encodes a zinc finger protein, and can play a role in regulating cellular processes linked to longevity, such as stress response and gene expression [42]. Zinc finger proteins have been implicated in the regulation of aging and lifespan, as they are involved in processes like DNA repair, stress response, and gene expression [42, 43].
Interestingly, some genes related to growth and development, have also been implicated in longevity. Studies on long-lived mutant and knockout mice have shown that alterations in growth hormone signaling can affect lifespan [12].
Genes associated with cell cycle and DNA repair have been linked to longevity, as maintaining genomic integrity is crucial for cellular homeostasis and prevention of age-related diseases [40]. Several genes have been associated with cell cycle regulation and DNA repair, which are crucial processes for maintaining genomic integrity and preventing age-related diseases. For instance, the gene ESPL1 is involved in the regulation of cell division and chromosome segregation [40]. CDK11 performs to play multiple roles in cytokinesis, cell cycle progression, and apoptosis [44, 45]. The gene MDM1 is a regulator of the p53 pathway, which plays a central role in cellular senescence and the aging process. PRIM2 is a DNA primase, an enzyme that plays a key role in the replication of DNA. Additionally, the gene ERCC5 is involved in DNA repair mechanisms, and its dysregulation has been linked to accelerate aging and age-related diseases.
The identification of deleterious SNPs using the SIFT score in the genes PDE4DIP, OR4C3, OR4C5, MAP2K3, KCNJ12, MUC3A, PRAMEF22, GPRIN2, and TIMM23B is particularly intriguing given their potential roles in longevity. Novel variants in these genes may provide key insights into the genetic factors that contribute to exceptional lifespan. Each of these genes has unique function that could influence longevity through various biological pathways. In conclusion, the genes provided encompasses a diverse set of biological functions, many of which have been linked to the regulation of longevity and the aging process. Further research is needed to elucidate the precise mechanisms by which these genes influence lifespan and uncover potential therapeutic targets for age-related diseases.
Comments (0)