
Remember me
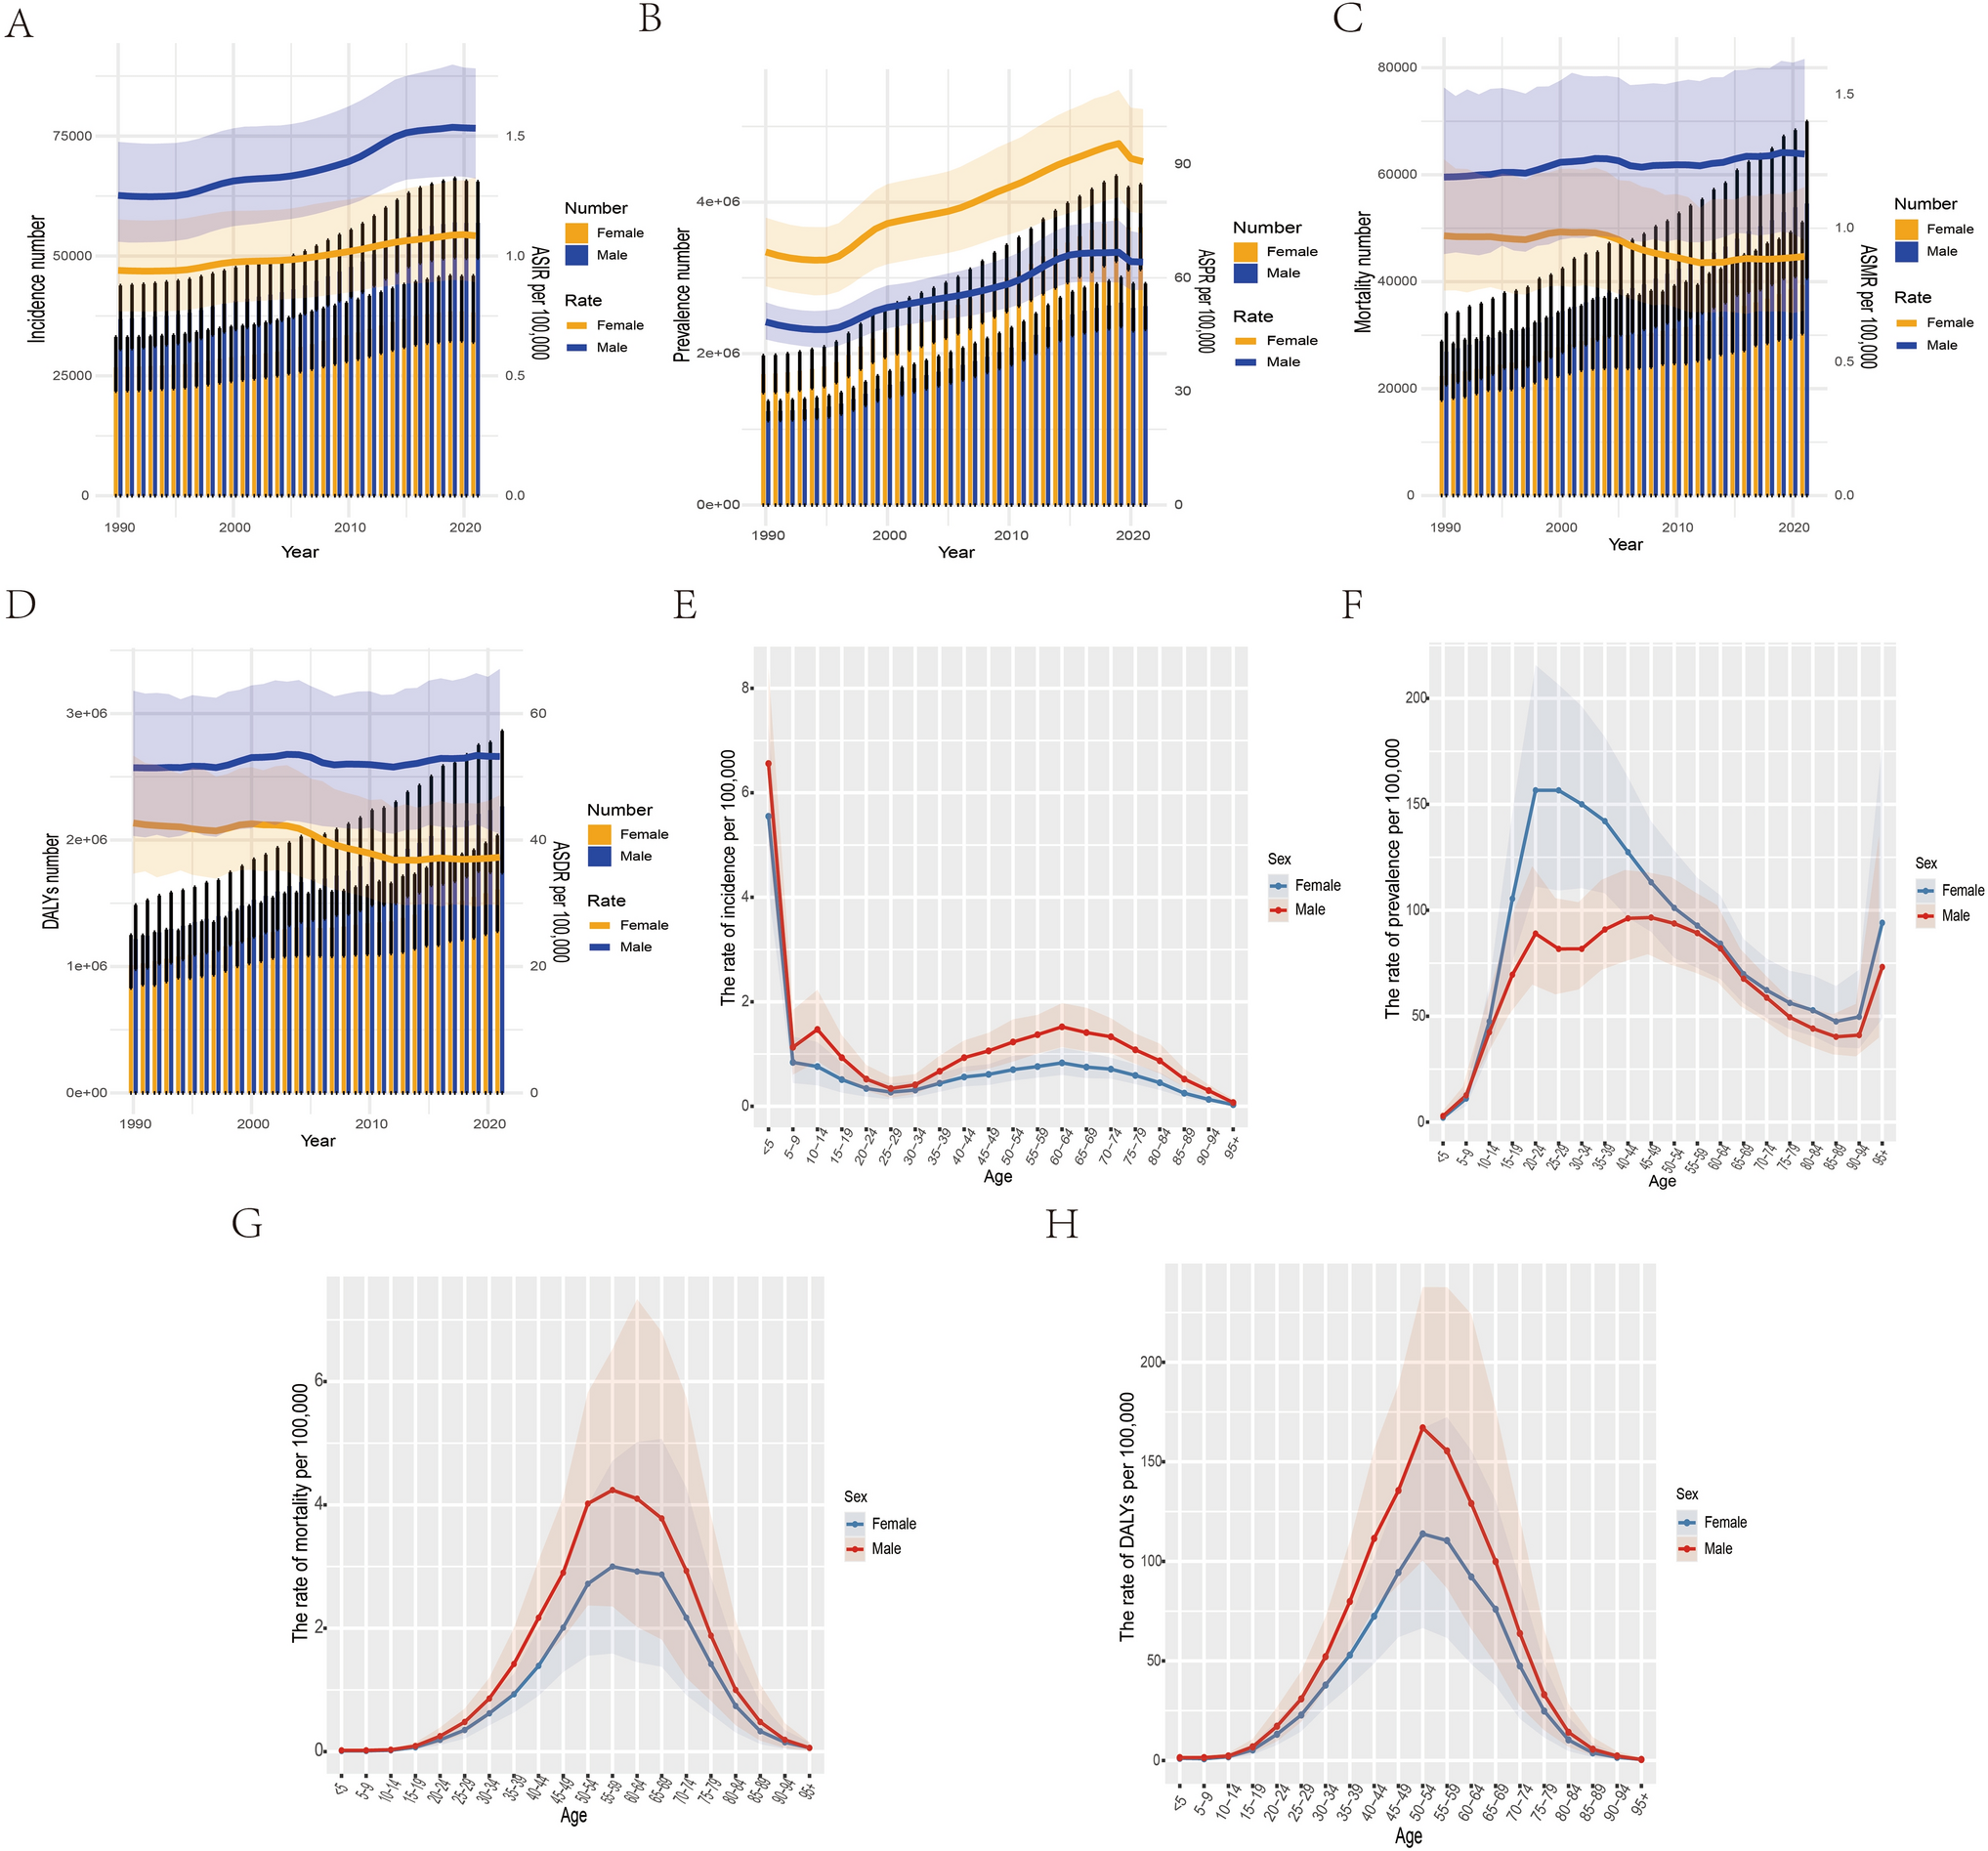
In 2021, the global ASIR, ASPR, ASMP, and ASDR per 100 000 population were 1.31(95% CI:1.12,1.55), 77.31 (66.91,87.58), 1.08 (0.83,1.38), and 45.2 (36.01,56.35), respectively. Between 1990 and 2021, both incidence and prevalence increased worldwide, while mortality remained largely unchanged and DALYs showed a downward trend. Men experienced higher incidence, mortality, and DALYs than women, whereas women consistently had a higher prevalence. (Fig. 1A-D; Table S1). This gender difference remained consistent across the five SDI regions (Figure S1 and S2).
Fig. 1
The global incidence, prevalence, mortality, and DALYs for T1DM-related CKD by gender and age in 1990 and 2021. A-D Temporal trends in the global number of incidence, prevalence, mortality, and DALYs in men and women with T1DM-related CKD, and accompanied by ASIR, ASPR, ASMR, and ASDR per 100,000. E–H The global rate of incidence, prevalence, mortality, and DALYs in T1DM-related CKD by age group in 2021
Age differences and aging in the burden of disease in T1DM-related CKDIn 2021, T1DM-related CKD prevalence was higher than in 1990 among individuals aged over 10–14 years, with higher prevalence in the > 15–19 age group compared to 1990. Mortality and DALYs were also higher in the > 45–49 age group in 2021 than in 1990 (Figure S3).
In 1990, the two peak ages of onset of T1DM-related CKD were < 5 years and 60–64 years, respectively. The peak age of prevalence numbers was 20–29 years. Peak prevalence occurred earlier in women (25–29 years) than in men (50–54 years), and the peak age of death was 50–59 years. The highest rate of DALYs was at 50–54 years (Figure S4). In 2021, the age of peak incidence, mortality, and DALYs was the same as in 1990. However, the peak prevalence age for women shifted to 20–24 years and for men to 45–49 years, both earlier than in 1990 (Fig. 1E-H, Figure S5). From 1990 to 2021, the peak prevalence shifted to younger age groups in both men and women, highlighting earlier onset of complications in recent decades.
Regional and SDI DifferencesMarked heterogeneity was observed across regions. In 1990, high-income North America recorded the highest incidence and prevalence, while Oceania had the highest mortality and DALYs. By 2021, Eastern Europe showed the highest incidence, Australasia the highest prevalence, and Oceania remained the region with the highest mortality and DALY burden (Table 1). When stratified by SDI, high-SDI countries had the highest incidence and prevalence but the lowest mortality and DALYs, reflecting more effective disease control. In contrast, middle-SDI countries had the heaviest mortality and DALY burden, while low-SDI countries exhibited underestimation due to limited data availability (Fig. 2).
Table 1 ASPR, ASIR, ASMR, ASDR and AAPC of T1DM-related CKD at global and regional level, 1990–2021Fig. 2
Time trends of ASIR, ASPR, ASMR, and ASDR for T1DM-related CKD in various SDI regions. Time trends of ASIR (A), ASPR (B), ASMR (C), and ASDR (D) for T1DM-related CKD in various SDI regions
National differencesAt the national level, Russia, the United Arab Emirates, and Uzbekistan ranked among the highest in incidence rates, while South Korea and China had the lowest (Fig. 3A). Canada reported the highest prevalence, whereas Honduras had the lowest (Fig. 3B). Mortality and DALYs were particularly elevated in Pacific Island nations such as American Samoa, Nauru, and Micronesia, where limited healthcare resources may contribute to disproportionately high burdens (Fig. 4; Table S2).
Fig. 3
ASIR, ASPR for T1DM-related CKD in 204 countries and territories in 2021. ASIR (A) and ASPR (B) for T1DM-related CKD in 204 countries and territories in 2021
Fig. 4
ASMR, ASDR for T1DM-related CKD in 204 countries and territories in 2021. ASMR (A) and ASDR (B) for T1DM-related CKD in 204 countries and territories in 2021
Temporal trendsJoinpoint regression identified distinct temporal patterns. For women, mortality rose until 2000, declined steadily until 2012, and then increased slightly thereafter, resulting in an overall declining trend (Fig. 5A). For men, mortality trends fluctuated but showed a net increase from 1990 to 2021 (Fig. 5B). By SDI category, high and low-middle-SDI countries experienced rising mortality trends, while high-middle, middle, and low-SDI countries generally showed declines (Fig. 5C-H; Table S3 and S4). These divergent trajectories highlight persistent gender and regional disparities in disease burden.
Fig. 5
Joinpoint regression results for ASDR in T1DM-related CKD by gender and SDI region. Joinpoint regression results for ASDR in women (A) and men (B) with T1DM-related CKD. Joinpoint regression results for ASDR in T1DM-related CKD globally (C), high SDI (D), high-middle SDI (E), middle SDI (F), low-middle SDI (G), and low SDI (H) regions. * P < 0.05
Health inequality analysis and frontier analysisAccording to the slope index of inequality (SII), the difference in DALYs between the countries and regions with the highest and lowest SDI regions increased from −39.63 (95% CI: −56.06490, −23.18810) in 1990 to −47.53 (95% CI: −65.3699, −29.69031) in 2021. The concentration index, which was 0.20 (95% CI: 0.15, 0.25) in 1990, decreased to 0.11 (95% CI: 0.06, 0.17) by 2021. The results of the health inequality analysis suggested an increase in absolute inequality and a decrease in relative inequality across sociodemographic levels of development from 1990 to 2021(Fig. 6A and B; Table S5 and S6).
Fig. 6
Results of the health inequality analysis and frontier analysis of the burden of disease for T1DM-related CKD. A The SII shows the difference in DALYs between the countries and regions with the highest and lowest SDI regions. B The concentration index shows relative health inequalities at different levels of sociodemographic development. The dots represent individual countries and areas by population size. Blue represents 1990 data, and red represents 2021 data. C Frontier analysis identifies areas where the healthcare system is performing best (frontiers) and areas where there may be inefficiencies or missed opportunities for improvement. The frontier Line is shown in black, and the top 15 countries and territories with the largest differences from the leading edge are shown in brown. Blue represents low SDI with the smallest differences from the frontier, red represents high SDI with the largest differences from the frontier. D The color of the dots represents the direction of change in DALY from 1990 to 2021. Orange represents decreasing, and green represents increasing
Using data from 1990 to 2021, ASDR- and SDI-based frontier analyses can identify countries that have yet to realize gains in disease reduction based on their SDI levels, thus helping to prioritize resource allocation and compare progress with top-performing peers. Effective differentials had generally increased with sociodemographic development, suggesting that countries and regions with higher SDI had more significant potential for burden improvement. The 15 countries and territories with the highest potential for improvement included Solomon Islands, Vanuatu, Tuvalu, Samoa, Tokelau, Fiji, Kiribati, Palau, Northern Mariana Islands, Mauritius, Niue, Micronesia (Federated States of), Marshall Islands, Nauru, and American Samoa. Frontier countries and territories with low SDI include Somalia, Niger, Guinea, Yemen, and the United Republic of Tanzania. High SDI countries and territories with significant potential for improvement based on their development level include Singapore, the Republic of Korea, Lithuania, the United States of America, and Taiwan (Province of China). The frontier analysis reveals potential room for improvement in reducing the T1DM-related CKD burden in different countries and regions. Some lower SDI countries, such as Guinea, show notable capacity for disease control despite resource constraints (Fig. 6C and D; Table S7).
Age-period-cohort analysis and decomposition analysisThe age-period-cohort model was applied to analyze the effect of age, period, and cohort factors on changes in T1DM-related CKD. After controlling for period and cohort factors, the risk of mortality and DALY increased with age and peaked at 57.5 years and 52.5 years, respectively (RR mortality = 3.3.4793, 95% CI: 3.4284, 3.5309; RR DALYs = 137.1917 135.1858, 95% CI:1 39.2273, 3.3.4793), and then gradually declined. The period effects all showed a downward and then upward trend. The cohort effects all showed a rise followed by a decline (Fig. 7A-F; Table S8 and S9).
Fig. 7
Age-period-cohort analysis and decomposition analysis for T1DM-related CKD mortality and DALYs. Age (A), period (B), and cohort (C) effects for T1DM-related CKD mortality globally. Age (D), period (E), and cohort (F) effects for T1DM-related CKD DALYs globally. The impact of population aging, population growth, and epidemiologic changes on mortality (G) and DALYs (H) for T1DM-related CKD in both, males, and females globally from 1990 to 2021. Impact of population aging, population growth, and epidemiologic changes on mortality (I) and DALYs (J) for T1DM-related CKD in different SDI regions from 1990 to 2021. The black dots represent the total change due to all three components. Positive values for each component indicate the corresponding positive contribution of mortality and DALYs, and negative values indicate the corresponding negative contribution of mortality and DALYs
A decomposition analysis of mortality for T1DM-related CKD was performed to assess the roles of aging, population growth, and epidemiologic change factors on the epidemiology of disease from 1990 to 2021. The contribution of global epidemiologic changes was 8.9% in men. In women, it was −15.65%. Aging had a stronger impact in medium SDI countries (57.11%). Population growth contributed significantly to middle, high, and low SDI countries (171.87% and 118.0%). The contribution of epidemiologic change factors was high for medium–high SDI and high SDI countries (−142.45% and 50.67%). The same decomposition analysis was performed for DALYs from T1DM-related CKD. Globally, there was a downward trend overall, an upward trend in high SDI and low-middle SDI countries, and a downward trend in the remaining regions. Aging and population growth contributed 37.86% and 70.47%, respectively, to the reduction of the global disease burden. The impact of epidemiologic changes varied between genders and was 4.4% in men. For women, it was −30.35%. Aging had the greatest influence in medium SDI countries (53.72%). The contribution of population growth was high in medium and high SDI and low SDI countries (2316.71% and 116.2%). Epidemiologic change factors contribute significantly to medium–high SDI and high SDI (−2115.01% and 53.34%). Overall, epidemiologic changes contribute to reducing the global burden of disease (Fig. 7G-J; Table S10 and S11).
Risk factorThe 2021 GBD database showed four attributable risk factors for DALYs in T1DM-related CKD: impaired kidney function, high fasting glucose levels, high temperatures, and low temperatures. These factors accounted for 7.08%, 99.97%,1.14% and 3.88%. The four risk factors differed slightly by region and gender. High and low temperatures accounted for the highest percentage in high SDI regions (Figure S6).
BAPC model predicts disease burden of T1DM-related CKD to 2050Using the BAPC model, we projected the disease burden for T1DM-related CKD from 2021 to 2050. Compared with 2021, the global ASIR for T1DM-related CKD will decrease to 0.96 (0.48,1.44) in women and 1.27 (0.52,2.02) in men (Figure S7). The global ASMR for T1DM-related CKD will decrease to 0.87 (0.51,1.2) in women and 1.21 (0.78,1.63) in men (Figs. 8A-B). The global ASDR for T1DM-related CKD will decrease to 32.84 (CI: 19.76,45.92) in women and 48.43 (31.14,65.73) in men (Figs. 8C-D; Table S12). The predictions indicate that although the global burden of T1DM-related CKD will decrease, the reduction will be relatively small. Additionally, by 2050, the burden was projected to be higher in men than in women.
Fig. 8
Temporal trend in ASMR and ASDR for T1DM-related CKD from 1990 to 2050 for both males and females. Dashed lines indicate observed ASMR, and solid lines indicate ASMR predicted by the BAPC model for females (A) and males (B). Dashed lines indicate observed ASDR, and solid lines indicate ASDR predicted by the BAPC model for females (C) and males (D)
Comments (0)