
Remember me


In our attempt to apply antibody at a minimal volume, the first challenge was how to evenly distribute antibody solution on the nitrocellulose (NC) membrane. The antibody-containing solution, TBST, did not effectively spread throughout the membrane due to its surface tension. We effectively distributed the solution over the membrane by overlaying a leaflet of a sheet protector (SP) on the solution (Figure S1 and Video S1). The solution maintained a certain thickness, balancing between the downward pressure from the weight of the SP leaflet and the counteracting pressure by surface tension of the solution. We empirically estimated the volume (µL) required to cover a 4.5 cm-long NC membrane (pore size 0.2 μm), \(\:_\), which was determined as \(\:_=10n\), where \(\:n\) is the total lane number for 15-well comb. The \(\:_\) ranges 20–150 µL depending on the size of the experimental groups (Examples of \(\:_\) are presented in Table S1).
Determination of Antibody Concentration for SP StrategyIn the SP strategy, the lack of large antibody pool can result in a decrease in antibody concentration, possibly leading to less efficient binding reactions. We investigated the relationship between the antibody concentration and the signal intensity to find the antibody concentration in SP strategy that produces similar signal intensity to its CV counterpart. Three housekeeping proteins (GAPDH, α-tubulin, and β-actin) were used since they are relatively abundant in mammalian cell lysate and are frequently used as loading controls.
We transferred a lane of HeLa cell lysate to NC membrane. For CV group, the membranes were incubated with 0.1 µg/mL antibody solution (10 mL) at 4 °C and were agitated overnight (18 h). For SP groups, antibody solutions (20 µL) at 0.1, 0.2, 0.5, and 1.0 µg/mL were applied to each membrane using SP strategy. Each SP-enclosed membrane was placed on a wet paper towel and sealed into a zipper bag to prevent it from drying up. They were incubated overnight at 4 °C, agitated by an orbital shaker. Then, we took the membrane out of the SP and followed the usual Western blot protocol for the rest of the assay. Overall, a tendency of positive correlation between the antibody concentration and the signal intensity was observed (Figure S2A–B and Table S2). We also found that SP strategy at 1.0 µg/mL antibody and CV method at 0.1 µg/mL produced signals of comparable intensity (Figure S2C). Therefore, we used antibodies for CV and SP at 0.1 and 1.0 µg/mL, respectively, in the following experiments.
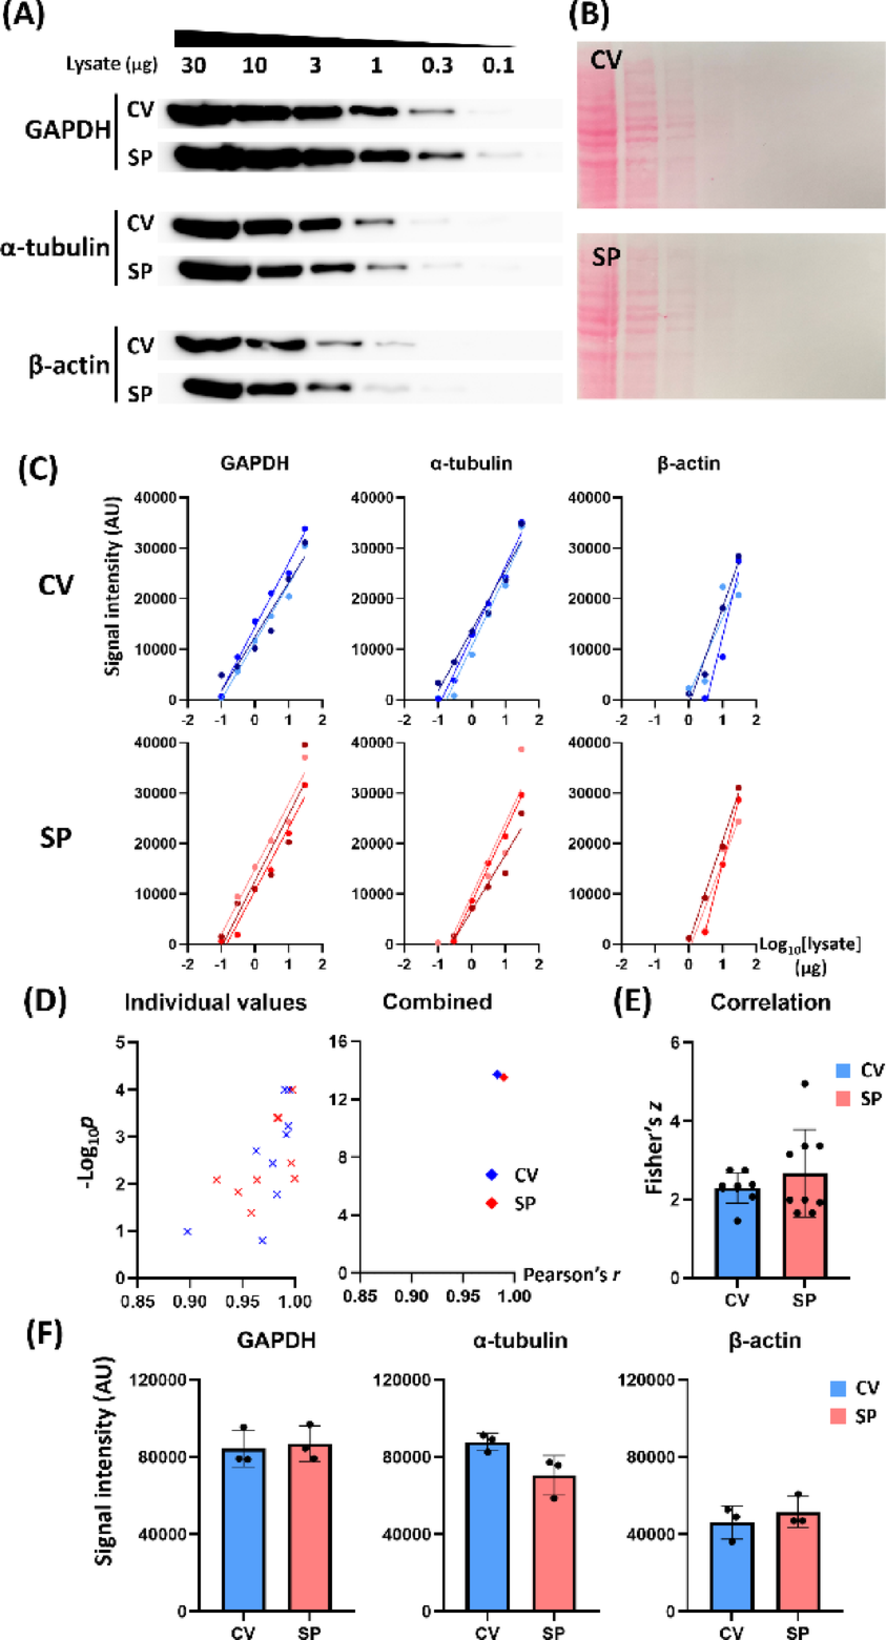
The Sensitivity and Specificity of the SP StrategySemi-quantitative detection is one of the key features of the Western blot assay. To confirm semi-quantitative detection power of SP strategy and to evaluate its dynamic detection range, we loaded 0.1–30 µg HeLa cell lysates and probed them using CV (0.1 µg/mL) and SP (1.0 µg/mL) methods, respectively (Fig. 1A–B). Both the CV and SP methods showed a robust linearity between the log10[amount of loaded lysate] and the detected signal intensity in all three tested antibodies (Fig. 1C and Table S3). The lower limit of the linear detection range was 0.1 µg, 0.3 µg, and 1 µg for GAPDH, α-tubulin, and β-actin, respectively.
We pooled the independent datasets of the three antibodies and plotted -log10[p-value] against Pearson’s r (Fig. 1D). We then calculated the combined r and p using Fisher Z-transformation and Fisher’s combined probability test, respectively (Fig. 1D). The combined parameters in both the CV (r = 0.9830 and -log10p = 13.7132) and the SP (r = 0.9895 and -log10p = 13.5167) groups exhibited significant linear relationships. The Fisher’s z for the CV (mean z = 2.3807) and SP (mean z = 2.6243) groups were not significantly different (Fig. 1E, Mann-Whitney test, n = 9). In addition, the summed band intensities for 1–30 µg lysates across the antibodies did not differ statistically between the CV and SP groups (Fig. 1F, Mann-Whitney test, n = 3).
Next, we investigated whether SP procedure increases the nonspecific signals compared to CV method. The specificity of the SP strategy was examined using the results in Fig. 1A, analyzing the target bands and non-target bands. The detection pattern and the band size of non-target signals of each antibody were identical between the CV and SP groups (Fig. 2A). We measured and summed the signal intensities of the 10 and 30 µg lysate for the target bands and non-target bands, respectively. The relative non-target signal was expressed as a fraction of the target band signal, which was not significantly different between the CV and SP groups in all three antibodies (Fig. 2B, Mann-Whitney test, n = 3).
In summary, the SP strategy showed a robust lysate-signal relationship of the target band as did the CV method, demonstrating the semi-quantitative detection of the SP strategy. In addition, the extent of non-target signals was on a similar level in both CV and SP methods. These results indicate that employing SP strategy at an optimized antibody concentration does not compromise the sensitivity and specificity of Western blot assays.
Incubation without AgitationIn CV method, agitation is a critical step in antibody incubation to facilitate the bulk movement of antibody solution for proper detection [8, 10, 11]. We speculated that agitation might not be as effective in the SP strategy due to the small liquid volume and could be omitted. We followed SP protocol with and without agitation during the 18-hour antibody incubation at 4 °C. The agitated (AG) and non-agitated (NA) groups exhibited similar band patterns and detection range (Fig. 3A), both showing semi-quantitative detection power with a highly linear relationship between the band signal intensity and the log10[lysate] (Fig. 3B and Table S4).
The combined Pearson’s r and combined p were calculated by pooling the datasets across the antibody groups (Fig. 3C). Both the AG (r = 0.9638 and -log10p = 10.2317) and NA (r = 0.9741 and -log10p = 11.6336) groups exhibited a strong correlation (Fig. 3C). The Fisher’s z in the AG and NA groups did not differ significantly (Fig. 3D, Mann-Whitney test, n = 9). Densitometric analysis showed that the sum of 1–30 µg band intensities of the AG and NA groups were not significantly different (Fig. 3E, Mann-Whitney test, n = 3).
The 15-min protocolWe speculated that the removal of pre-filled TBST could facilitate the access of the antibody solution to the pore space, resulting in faster reaction. In addition, antibody incubation at room temperature (RT) is a valid option in SP strategy, since the antibody is not expected to be reused. Therefore, we hypothesized that the SP strategy can reduce the incubation time.
We conducted Western blot assays using SP strategy with different incubation conditions: 5 min, 15 min, and 120 min groups at RT, and an 18-hour overnight group at 4 °C. All incubations were conducted without agitation. All groups produced bands with substantial signal intensities (Fig. 4A and Table S5). On visual inspection, the detection range tended to be narrower in the 5 min group for GAPDH and the overnight (4 °C) group in α-tubulin. However, we could find a robust correlation between the band intensity and log10[lysate] (Fig. 4B).
Fig. 1
Sensitivity of SP strategy. (A) Representative Western blot images showing semi-quantitative detection of target protein by CV and SP. (B) Ponceau S-stained membranes used for CV or SP. (C) The signal intensity against log10[lysate] exhibits linear correlation for each membrane set in both CV and SP. The lower limit of detection was 0.1 µg (GAPDH), 0.3 µg (α-tubulin), and 1 µg (β-actin). (D) The -log10p values were pooled across the three antibody groups and plotted against Pearson’s r values (left). Combined r and p values for these data were obtained using Fisher Z-transformation and Fisher’s combined probability test, respectively (right, n = 9). (E) Fisher’s z from the pooled Pearson’s r values between CV and SP exhibited no significant difference. (F) CV and SP target band intensity summed across 30–1 µg lysates in each antibody exhibited no significant difference
The datasets were pooled across the antibodies to plot Pearson’s r and -log10p (Fig. 4C). The combined Pearson’s r and the combined p for each group were as follows (Fig. 4D): 5 min (r = 0.9825 and -log10p = 9.1227), 15 min (r = 0.9950 and -log10p = 17.6211), 120 min (r = 0.9779 and -log10p = 12.8186), and overnight (r = 0.9904 and -log10p = 10.8350). The Fisher’s z values were different among groups (p = 0.0361, Kruskal-Wallis test, n = 9), where only 15 min and 120 min groups exhibited a statistical difference (Fig. 4D, p = 0.0355, Dunn’s multiple comparisons test). A densitometric sum of 1–30 µg lysates did not differ significantly among the groups in any of the antibodies (Fig. 4E, Kruskal-Wallis test, n = 3). Of note, overnight (4 °C) group, despite the longest incubation, did not produce a stronger signal than other groups.
Fig. 2
Specificity of SP strategy. (A) Representative whole blot image of Fig. 3A showing additional bands of non-theoretical molecular weight in CV and SP methods. (B) Non-target intensity relative to target (summed across 30 and 10 µg lysates) in CV and SP showed no significant difference
These results indicate that the detective power of the SP strategy is not critically dependent on the antibody incubation time within the range of 5–120 min (RT) and overnight (4 °C) conditions. Each condition produced substantial signal with a robust linearity between the signal intensity and log10[lysate]. If we incubate the membrane for 15 min, it is 70-fold more time-efficient than the traditional overnight (1,080 min) protocol. More importantly, the overall timespan for Western blot assay which used to take two days can now be completed in a single day.
Fig. 3
Agitation is not necessary in SP strategy. Antibodies were applied to NC membrane using SP and were incubated overnight at 4 °C with or without agitation. The signals of agitated (AG) and non-agitated (NA) incubation were detected side-by-side for accurate comparison. (A) Representative Western blot images comparing AG and NA. (B) The signal intensity against log10[lysate] exhibits correlation for each membrane set in both AG and NA. The lower limit of detection was 0.1 µg (GAPDH), 0.3 µg (α-tubulin), and 1 µg (β-actin). (C) The -log10p values were pooled across the antibody groups and plotted against Pearson’s r values (left). Combined r and p values for these data were obtained using Fisher Z-transformation and Fisher’s combined probability test, respectively (right). (D) Fisher’s z from the pooled Pearson’s r values were compared between AG and NA groups exhibited no significant difference. (E) Target band intensity summed across 30–1 µg lysates in each antibody exhibited no significant difference between AG and NA
Application of the Standard SP Protocol in Apoptosis DetectionWe investigated whether the suggested SP protocol for Western blot can produce sufficient signals in diverse antibodies, significantly reducing both the antibody consumption and the assay time. We performed an apoptosis experiment on HeLa cells with 1 µM staurosporine, a well-known apoptosis inducer [12], and obtained the cell lysates at 0, 2, 4, 6, and 8 h post treatment and a negative control (0.1% DMSO).
The antibody stock was diluted at 1:1,000 in TBST with 5% skim milk to prepare a working antibody solution. Using SP strategy, 70 µL antibody solution was applied onto the NC. After 15-min incubation at RT without agitation, the rest of the assay was performed in the usual way. The antibodies successfully detected the expression and the cleavage of caspase-9, −7, and − 3 proteins and the poly(ADP-ribose) polymerase (PARP), marking the time-dependent steps of apoptosis event (Fig. 5A). Staurosporine treatment at 1 µM resulted in an immediate decrease in the expression of the full-length caspase and PARP proteins. The full-length protein levels at 2–8 h post-treatment differed significantly from the 0-hour group (Fig. 5B, ordinary one-way ANOVA with Dunnett’s multiple comparison test, n = 3). The cleaved forms exhibited a bell-shaped pattern, peaking between 2 and 6 h post-treatment. Their levels also differed significantly over time (Fig. 5B). At 8 h post-treatment, full-length protein levels were significantly lower than those in the DMSO control (8 h), while cleaved forms were significantly higher (Fig. 5C, unpaired two-tailed t-test, n = 3). The only exception was cleaved caspase-9, which returned to the basal level after reaching its peak at 2 h post-treatment [13]. These results indicate that SP strategy could be used in researches that require semi-quantitative analysis of proteins. Also, various antibodies at a common working concentration (1:1,000) could be successfully used for SP strategy.
Comments (0)