
Remember me


In this retrospective analysis, the post-therapy imaging data of eight patients with liver malignancy including hepatocellular carcinoma (HCC) and metastatic colorectal cancer (mCRC) were examined from the Beijing Tsinghua Changgung Hospital. The patients underwent 90Y RE with SIR-Sphere® (Sirtex Medical, Sydney, Australia) and were subjected to PET/CT imaging between May 2023 and July 2024. Patients demographic (age: 59.38 ± 13.06) and tumor characteristics are shown in Table 1. The median injected activity is 1.7 GBq and average activity is 1.69 ± 0.88 GBq. The selection of these patients did not include additional clinical or demographic data, as such information was deemed unnecessary for evaluating and comparing dosimetric methods. The research data was obtained with the patient’s informed consent and approved by the Medical Ethics Review Board of Beijing Tsinghua Changgung Hospital.
Table 1 Summar of patient characteristicsPatient specific phantomThe PET/CT imaging was performed using the GE Discovery MI system. For the CT component, a helical scan was employed with a rotation time of 0.5 s and a full rotation length. The tube voltage was set to 120 kV, and the current was manually adjusted, with a reference mA of 200 and an actual mA of 200. For the PET component, the scan time was 20 min. Reconstruction was performed using the VUE Point FX method, while quantitation was conducted with the QClear4000 algorithm. The voxel size and dimension of the CT images are 0.98 × 0.98 × 2.79 mm3 and 512 × 512 × 71, respectively, providing patient-specific structural information for the simulation. The distribution of 90Y is determined based on the PET/CT image, the original voxel size and dimension of which are 3.65 × 3.65 × 2.79 mm3 and 192 × 192 × 71. Since the PET and CT scans were performed on the same device, the data from both modalities are considered pre-registered. To facilitate the dose calculation and the sampling of the 90Y source, the CT images were down-sampled to match the resolution of the PET using MATLAB script. Within the reconstructed voxel phantom, the organ types and material compositions for each voxel were determined based on the HU values, following the methodology reported in previous research [16]. This voxelization process was implemented using a C + + program developed on the Visual Studio 2022 platform.
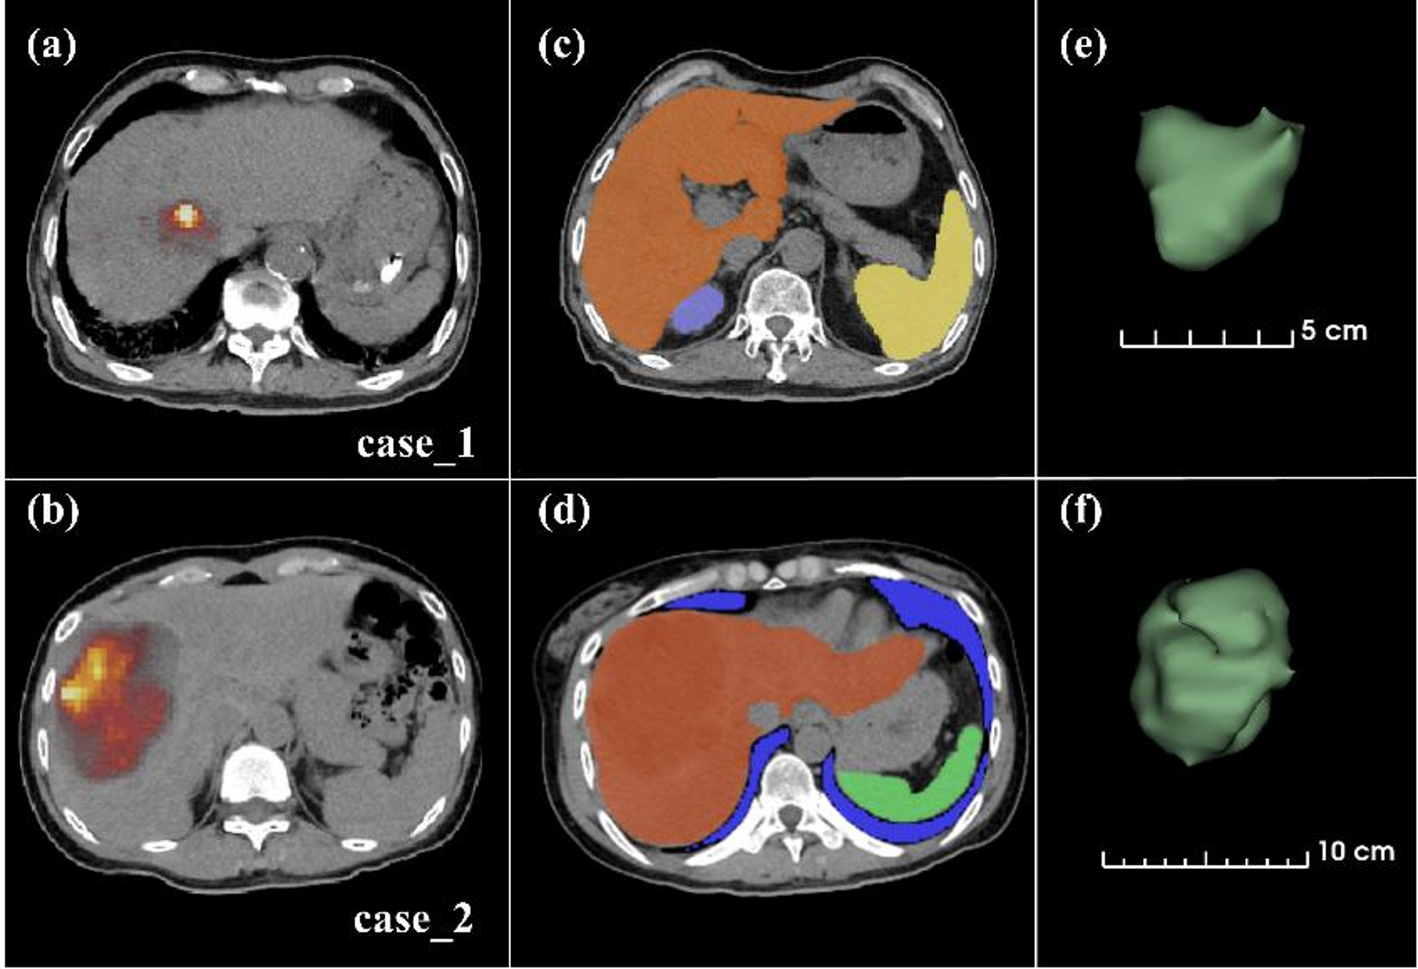
Tumor and organ segmentationThe open-source software TotalSegmentator [17], developed by University Hospital Basel, was used for organ segmentation. In this study, the lungs, liver, kidneys and spleen were segmented, as shown in Fig. 1(c)-(d). These binary masks were further refined with the assistance of a nuclear medicine physician with over five years of clinical experience. The tumor and healthy liver parenchyma exhibit similar tissue densities, which makes recognition challenging. Therefore, tumors with high uptake values were automatically segmented based on the PET images using the thresholding function of the 3D Slicer 5.6.2 software. Pixels with a value greater than 10% of the maximum pixel value on the PET images, which is consistent with clinical practice, were considered as the tumor region. The segmentation results were then reviewed and manually modified by the physician, particularly to remove any abnormal intrahepatic shunts. A 3D representation of the tumor is shown in Fig. 1(e)-(f).
Fig. 1
PET/CT and segmentation images. (a)-(b) represent the transverse views of case_1 and case_2, respectively. (c)-(d) show the binary masks of organ segmentation in the transverse plane. (e)-(f) present the 3D visualization of the tumor using 3D Slicer
Dosimetry approachesDirect Monte Carlo simulationThe direct Monte Carlo simulation is employed to model the transport and interactions of particles, which is regarded as the “Gold Standard”. Using the personalized phantom described in Sect. 2.2, individualized calculations are performed. The non-uniform distribution of the radioactive source, was sampled in proportion of the intensity of pixel values, which served as weights for position sampling. Simulations were conducted using Geant4 to obtain the three-dimensional dose distribution. To ensure that the results of the MC were within an acceptable range of statistical uncertainty, it was imperative to simulate 108 particles [18, 19].
Isotropic uniform sampling was applied within the voxels. The decay of 90Y consists of three components: gamma, beta particles, and electron, which sourced from the ICRP Publication No.107 [20]. In particular, the beta particle spectrum was provided with discrete data points, which has large intervals in the high-energy region. The average energy was calculated as follow:
$$\bar E = } \right) + P\left(}} \right)})\left(} - } \right)/2}} \over } \right) + P\left(}} \right))\left(} - } \right)/2}}}$$
(1)
where \(\:\stackrel\) is the average energy, and \(\:P\left(_\right)\) represents the probability density at \(\:_\), with units of MeV. This results in an average beta energy of 0.873 MeV. This value deviates significantly from the provided average energy of 0.937 MeV. Therefore, the nearest neighbor interpolation method was employed in the energy larger than 1 MeV, yielding an adjusted average energy of 0.934 MeV with a relative bias of -0.27%, as shown in Fig. 2.
Fig. 2
The integrated energy spectrum of 90Y beta particles
Both G4EmStandardPhysics_option3 and G4EmLivermorePhysics are commonly used electromagnetic physics models in nuclear medicine. The former covers a wider energy range and simplifies the interaction processes of low-energy photons and electrons, thus offering higher computational efficiency, while the later provides high-precision differential cross-section data with energies ranging from a few keV to 1 MeV. The energy deposition in a soft tissue voxel with a size of 3 × 3 × 3 mm³ were simulated for a single 90Y decay, and compared the results with those from the MIRD Pamphlet 17 [21] and EGSnrc [22], as shown in Table 2. Owing to its implementation of the Goudsmit-Saunderson multiple scattering model, G4EmLivermorePhysics offers improved accuracy in simulating sub-MeV electrons, which aligns well with the energy spectrum of 90Y [23]. Accordingly, this physics list was employed in all subsequent Monte Carlo simulations.
Table 2 Difference of energy deposition for a single 90Y decayMIRD methodAssuming a uniform distribution of activity, the MIRD method calculates the average organ dose by multiplying the accumulated activity in the organ by the S-value, which represents the average absorbed dose in the Region of Interest (ROI) per unit accumulated activity. Given that the position of microspheres remains relatively fixed, the accumulated activity is directly related to the initial activity and the physical half-life. In clinical practice, a variant of the MIRD method is commonly employed, which can be expressed as follows:
$$\:D=49.38\times\:\frac_}$$
(2)
In this formula, A0 represents the activity in the target liver region in units of GBq; the dose-activity coefficient is 49.38 Gy·kg/GBq [24]; the target liver mass ? (kg) is calculated by multiplying the segmented patient liver volume by the density.
Voxel S-valueThe voxel S-value method was introduced by the MIRD Pamphlet No.17. The absorbed dose in the target voxel t is calculated by convolving the activity map with a voxel kernel M, represented by the Eq. (3):
$$} = \mathop \sum \limits_^N \cdot S\left( \leftarrow voxe} \right) = \otimes M$$
(3)
In this equation, \(\:}_\) denotes the cumulative radioactive activity of the source voxel s surrounding the target voxel t, and \(\:S\left(_\leftarrow _\right)\) is the S-value from the source voxel s. The unit of S-value is mGy/MBq·s-1, which were calculated from MC. The M represents the matrix of S-value, and its size is determined by the maximum range of β particles. The voxel size of M is consistent with that of the phantom. In this case, a dimension of 13 × 13 × 13 and material of soft tissue was utilized. In the process of convolution, voxels with significant differences in soft tissue density inevitably introduce substantial computational errors. Therefore, the center voxel scaling method (formal 4) is adopted to correct the M [25]. In which, \(\:_\) represents the density of soft tissue, and \(\:_\) is the density of center voxel in the matrix.
$$\:^}=\:M\frac_}_}$$
(4)
Local energy depositionThis method operates with the assumption that the self-absorption rate of activity within voxel is 100%. The dose delivered to each voxel is obtained by multiplying the cumulative activity by a dose conversion factor, as expressed by the formula (5):
$$\:_=}_\times\:\frac}_}=}_\times\:_$$
(5)
\(\:\stackrel\) represents the mean energy released per decay, \(\:_\) is the mass of voxel, \(\:}_\) refers to the cumulative activity in the target voxel, measured in Bq·s, and \(\:_\) is the constant scalar factor, which is 3.89 mGy/MBq·s-1 in this study. The \(\:_\) denotes the mass of each voxel.
GPU-based Monte CarloThe GPU-based Monte Carlo simulation employed in this study is an optimized version of our previously developed platform [26], designed to simulate photon-electron coupled transport for internal irradiation dosimetry. The core modules include the GPU Monte Carlo engine and the internal source sampling system. The simulation incorporates the Livermore low-energy electromagnetic model to enhance the accuracy of low-energy photon transport, and accounts for key electron processes such as bremsstrahlung, ionization, multiple scattering, and positron annihilation.
The program is developed using C + + and CUDA, enabling high-performance parallel computing on an RTX 3090 GPU. The procedural implementation flow is illustrated in Fig. 3. Simulation parameters—including source definitions, cross sections, material properties, and random seeds—are initialized on the CPU and transferred to GPU memory. Transport routines are executed in parallel using pre-defined thread blocks and grids. Particle histories are processed based on a last-in-first-out logic until all primary and secondary particles are simulated. Qt and VTK are integrated for user interface development and dose visualization. Final statistical results, including absorbed dose distributions, are returned to the host for post-processing and analysis.
Fig. 3
The procedural implementation flow of personalized internal dosimetry by GPU-based Monte Carlo simulation
Criteria for benchmark data selectionTo ensure the accuracy of the geometry, source spectrum, and physical process parameters in voxel-level Monte Carlo simulations, the S-value for soft tissues (3 × 3 × 3 mm³) was selected as the evaluation metric. MIRD Pamphlet No.17 provides S-value for convolution kernels across various dimensions. However, discrepancies were noted between its data and results from using EGSnrc, particularly at source-to-detector distances beyond 10 mm (Fig. 4). In this Figure, the horizontal axis represents the distance from the voxel center to the source, while the vertical axis depicts the normalized dose. To investigate the discrepancies, Geant4 was used to model the energy deposition from the decay of 90Y within the voxel. Analyzing the MIRD Pamphlet suggests that the overestimation of energy deposition beyond 10 mm may stem from the use of the F6 tally card of MCNP4c 17. This distance corresponds to the maximum electron range in soft tissue, where photon-matter interactions have not yet reached equilibrium with charged particles. Thus, EGSnrc results were used as a benchmark to validate the accuracy of program.
Fig. 4
Variation of S-value with distance calculated using Geant4
Data analysisTaking MC as the reference standard, Mean Absolute Relative Error (MARE) was employed to evaluate the discrepancies among various dosimetric methods at the voxel level. The formula is as follow:
$$\:MARE\left(\text\right)=\frac\sum\:_^\left|\frac_\left(i\right)-_\left(i\right)}_\left(i\right)}\right|$$
(6)
where ? represents the number of voxels; Dx(i) and DMC(i) are the doses for the i-th voxel obtained by method ? and MC. Furtherly, the accuracy of organ-level dose estimation is assessed using the Relative Standard Deviation, as shown in Formal (6).
$$\:RSD\left(\text\right)=\:\frac_-_}_}$$
(7)
In addition, gamma passing rate within both the entire voxel space and the non-zero dose voxel space—defined as the proportion of voxels with a dose difference less than 1% of the maximum dose compared to MC—were calculated, denoted as γr. Finally, Shapiro-Wilk tests were first performed to assess the normality of the data, followed by repeated measures analysis of variance (ANOVA) to evaluate whether significant differences existed in the accuracy and stability of various dosimetric methods, using MC as the reference.
Comments (0)