
Remember me

The whole sample (n = 5709) had a median age of 86 (IQR = 81,91) years, with 63% (n = 3587) being females. A total of 5708 medication incidents were reported across 3,152,879 resident days for 2016 (35%) of the 5709 residents between 1 July 2014 and 31 August 2021 (Table 1). Of these 2016 residents, 1095 (54%) residents experienced more than one medication incident.
Table 1 Characteristics of the residents and their medication incidence statusDifferences were observed in the characteristics of residents with and without reported incidents. Sex was associated with medication incident status (p < 0.01), with females being more likely to have a reported medication incident. The residents with medication incidents were slightly younger at admission (median age = 86 years (IQR = 81,91, p < 0.01), had a longer LOS (median = 783, IQR = 3,571,364 days, p < 0.01) and had multiple comorbidities (median = 6, IQR = 5,7, p < 0.01) than those in the non-medication incident cohort.
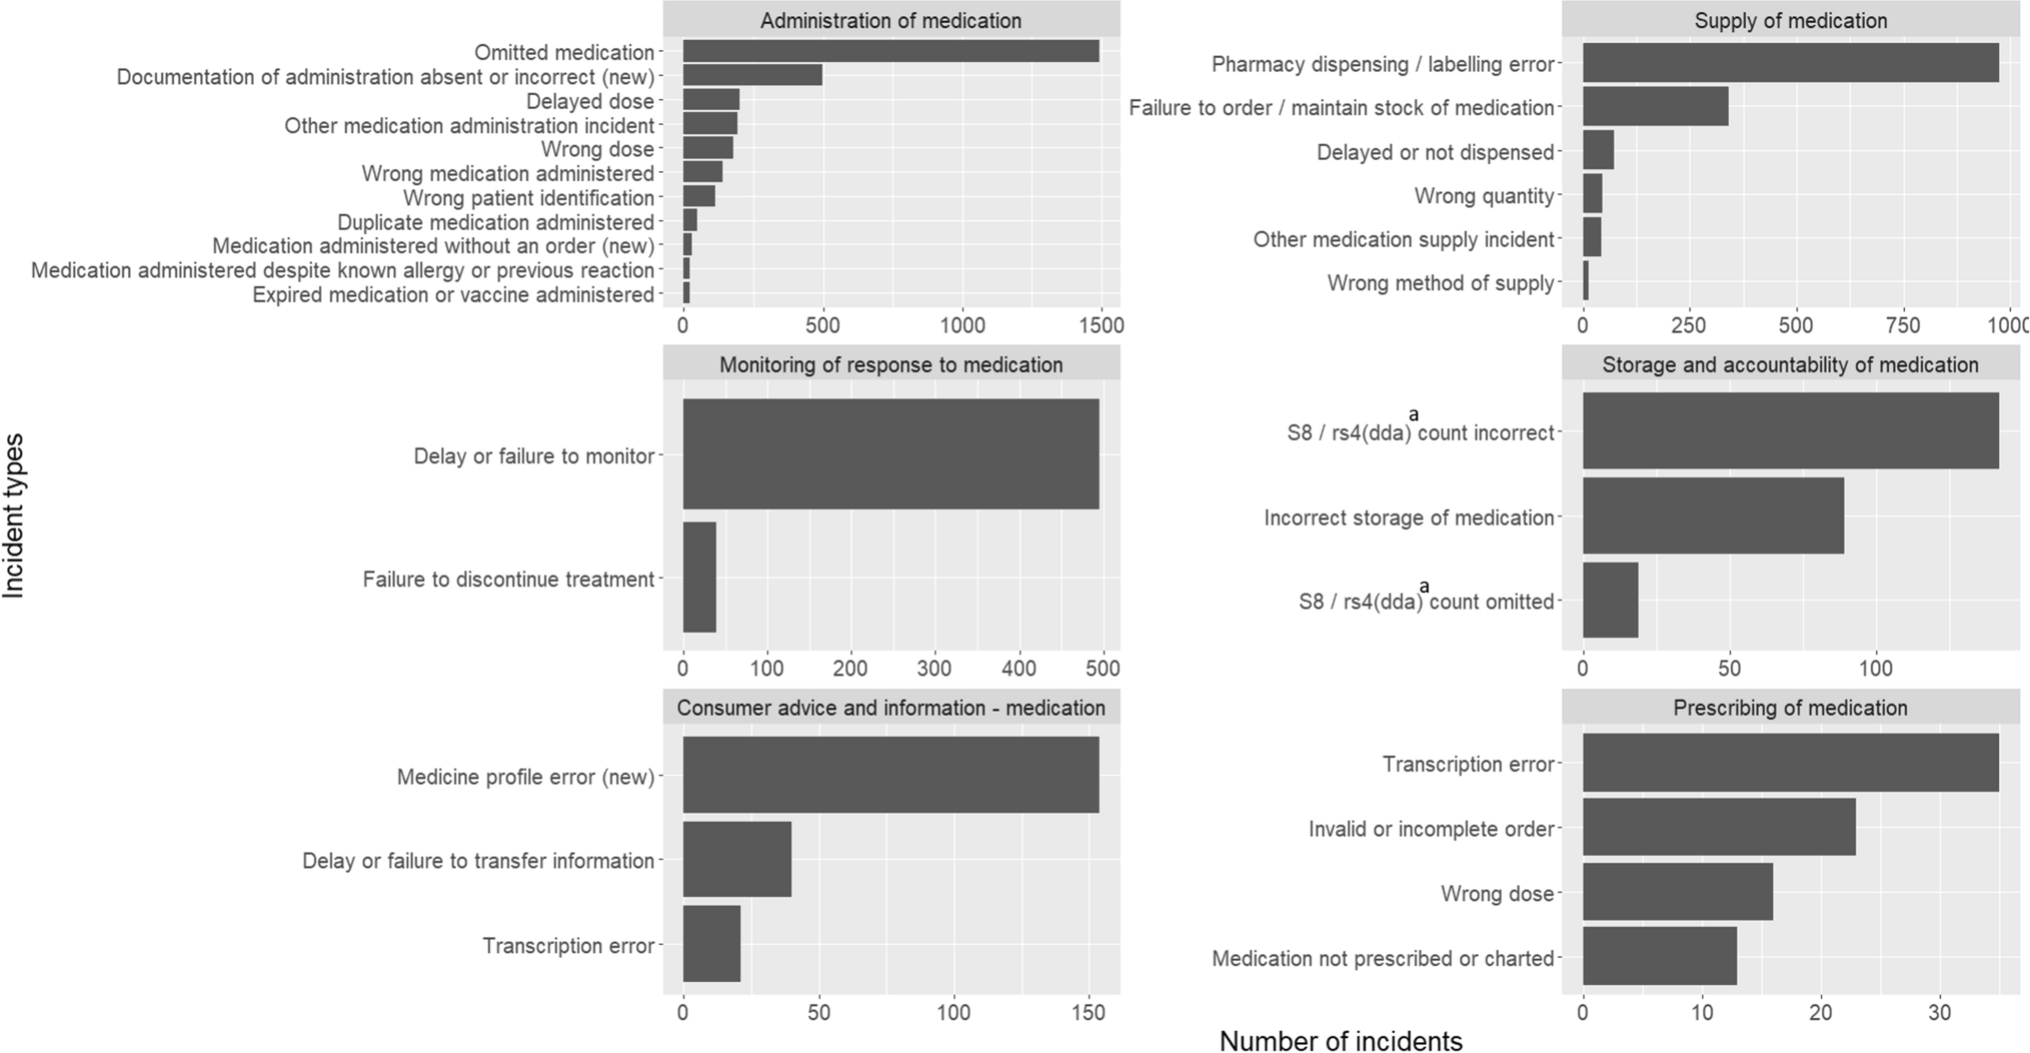
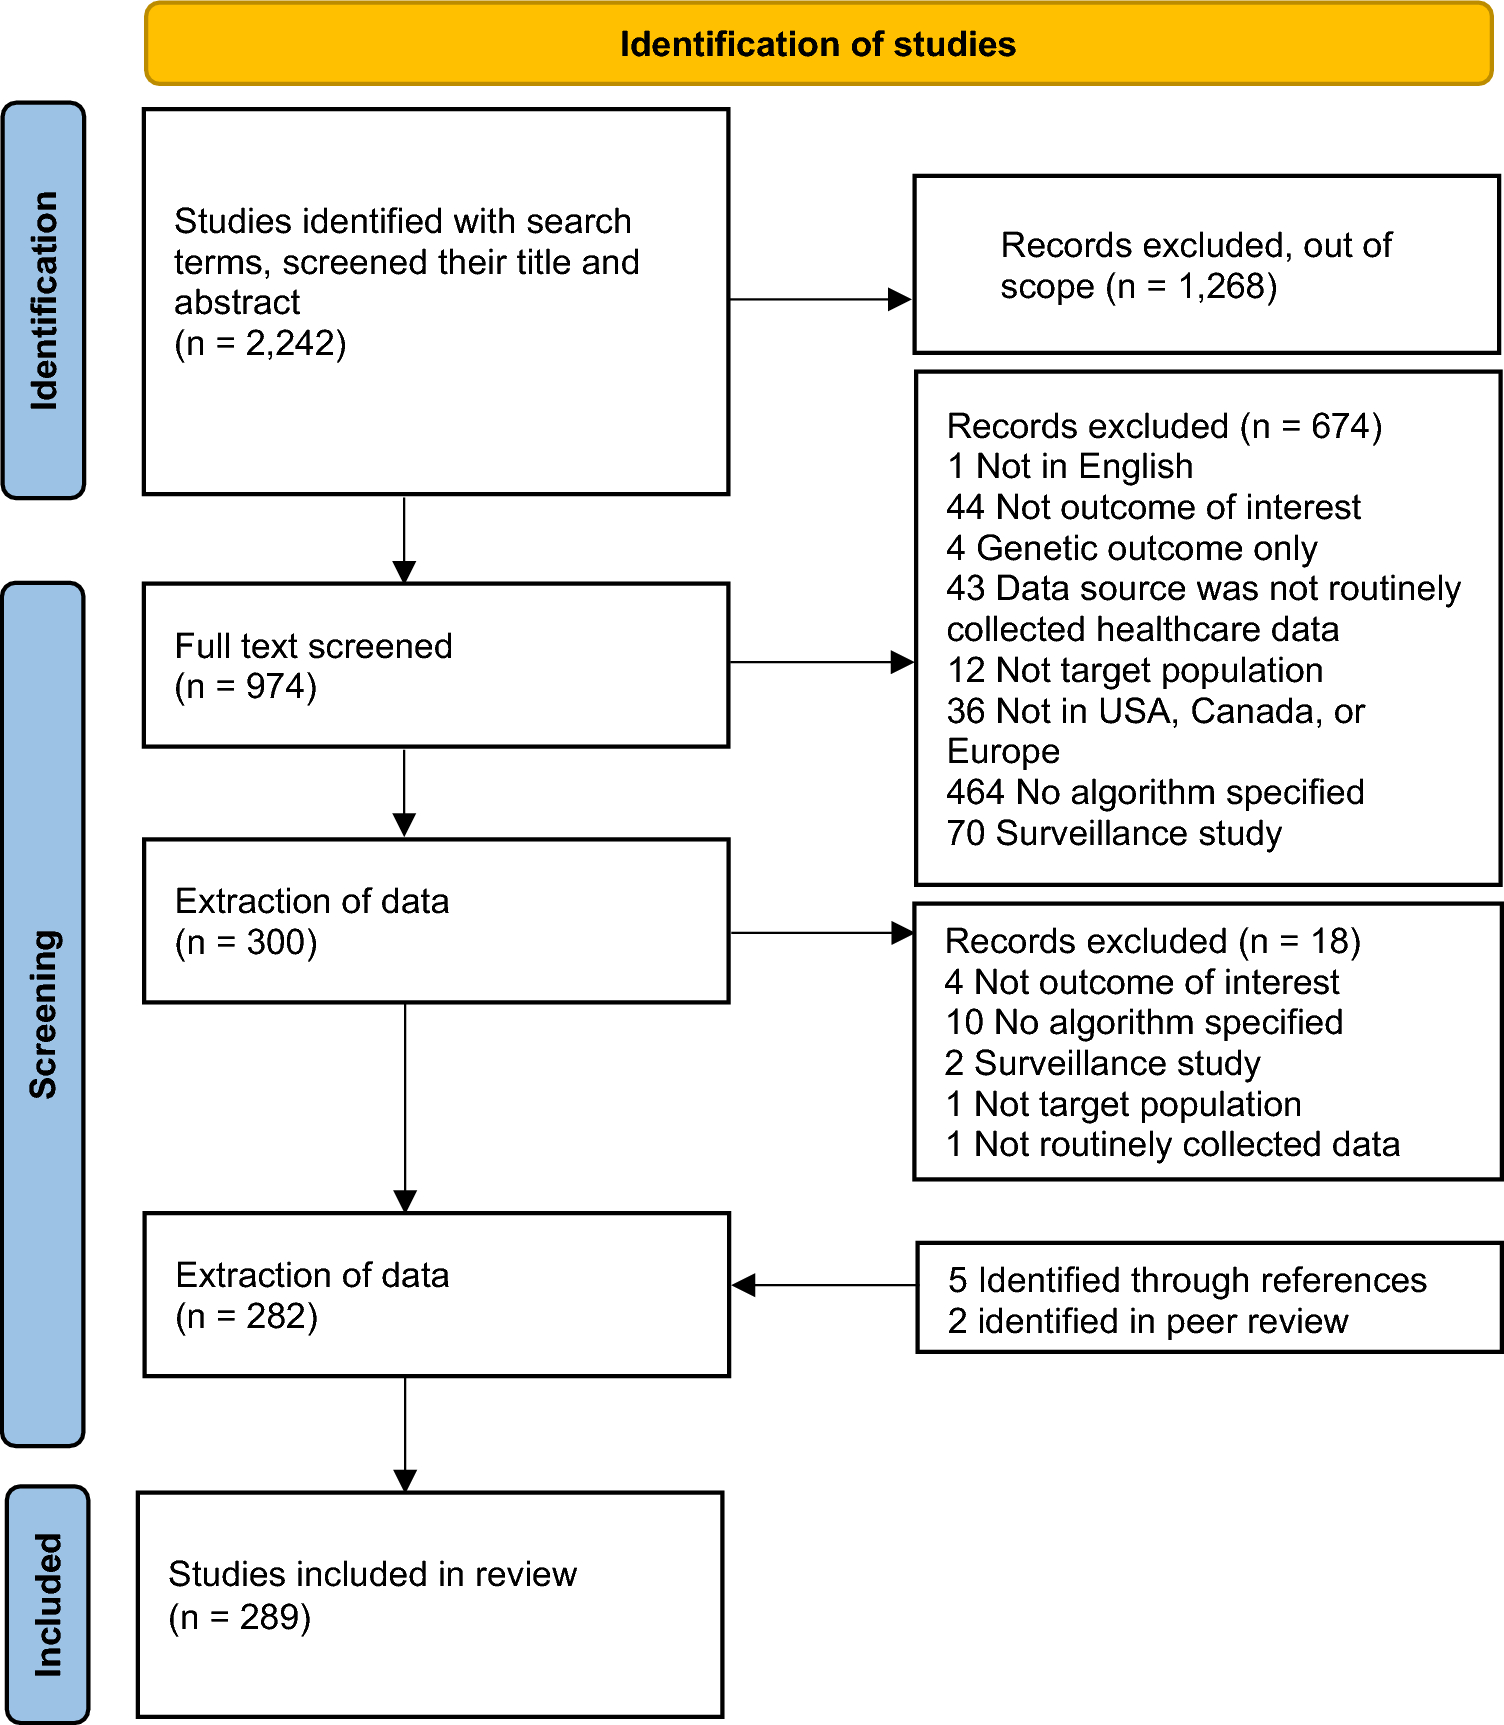
3.2 Medication management stages of the reported incidentsFigure 1 represents the ten most frequent incident types reported within each stage of the medication management cycle (refer to Supplementary Table 3 for the complete list of reported incident types). The majority of incidents reported were related to the administration of medication (n = 3023, 53%), followed by the supply of medications (n = 1546, 27%) and monitoring the response to the medication (n = 548, 9.6%). Half of the incidents within the administration stage involved the omission of medication (n = 1494, 49.4%). Dispensing or labelling errors (n = 974, 63%), delays or failures in the monitoring process (n = 481, 87.8%), incorrect counts of schedule 8 (S8) medications (n = 142, 55.9%) and transcription errors (n = 35, 29.4%) were the most frequent incident types within the supply stage, monitoring stage, storage, accountability stage and prescribing stage, respectively. Notably, documentation-related errors were reported, in the administration, supply, consumer advice and prescribing stages (Supplementary Table 3). Examples of the most common incident types are presented in Supplementary Table 4.
Fig. 1
The ten most frequently reported incident types at various stages of the medication management process. aSchedule 8 (s8)/ restricted Schedule 4 (rs4) drugs classified as Drugs of Dependence and Addiction (dda)
3.3 The Impact of Incidents on ResidentsThe impact of the incident on residents was reported in 5165 (90%) incidents (Table 2). Overall, 724 (14%) incidents required the resident to be monitored by the hospital, general practitioner (GP) or staff (Supplementary Table 5). Among them, only 15 (0.3%) incidents required the resident to be hospitalised for treatment or monitoring. The majority of these incidents were due to medication administration (n = 13), with two incidents reported as being due to supply issues. In total, 2.2% (n = 115) of incidents required GP attention, and 11% (n = 594) required residents to be monitored by staff.
Table 2 Impact of incidents on residentsOf the medication administration incidents 18% ((13+76+453)/3023) required residents to be monitored by hospital, GP or staff. Of these, 78% (n = 424/542) of incidents were owing to the omission of medication (n = 218), incorrect resident identification (n = 70), incorrect medication administration (n = 70) and incorrect dose (n = 66) (Supplementary Table 5). From the supply stage incidents, pharmacy dispensing/labelling errors (n = 49), failure to order/maintain a stock of medication (n = 27) and delayed or not dispensed medications (n = 14) accounted for 90% (90/99) of the supply incidents that required extra monitoring of residents.
3.4 Temporal Patterns in Reported IncidentsAs shown in Supplementary Table 6, a greater percentage of daily average medication incidents occurred/were detected on weekdays (15–16%) than on weekends (11–12%), and nearly half of the incidents reported occurred during the morning (44%), followed by afternoon (33%), evening (20%) and night (3.1%). For monitoring-related incidents, the percentage of incidents occurring in the morning (57%) was relatively high compared with that of other incidents (30–47%). However, for storage-related incidents and prescribing-related incidents, the majority occurred during the afternoon.
3.5 Trends in the Medication Incident Reporting RatesDuring the entire study period, the overall medication IR was 1.81 per 1000 resident days (95% CI 1.76, 1.86). Figure 2 presents the quarterly medication IRs (per 1000 resident days) for all incidents and the three most frequently reported medication stages in our study sample (i.e., administration of medication, supply of medication and monitoring of response to medication).
Fig. 2
Quarterly reported medication IR for all incidents and the three most common incident types. aIncident occurred date has been considered
The data show a notable initial decline in observed IRs relevant to all medication incidents, medication administration incidents and medication supply incidents. Specifically, these observed IRs decreased from 4.1, 2.1 and 1.4 per 1000 resident days to 1.5, 1.1 and 0.3 per 1000 resident days, respectively, between the third quarter of 2014 and the third quarter of 2016. Subsequently, the observed IR relevant to all medication incidents increased, reaching approximately two incidents per 1000 resident days, and then stabilised over the rest of the period after the third quarter of 2018.
3.6 Factors Associated with the Rate of Medication IncidentsUnivariable expected rate ratios identified by the multilevel Poisson model for medication incidents are included in Supplementary Table 7. Table 3 shows the risk factors retained in the final multivariable model. Multimorbidity was excluded from the full model because it was found to have multicollinearity (VIF > 5) with other comorbidities.
Table 3 Multilevel multivariable Poisson regression model when considering all medication incidentsAll risk factors retained in the final model increased expected medication IR except for age at admission and dementia. On average, the expected rate of medication incidents was approximately two times (RR = 1.908, 95% CI 1.646, 2.211) greater for respite residents than for permanent residents (p < 0.01). Similarly, the observed IR for respite residents was greater than that for permanent residents in all medication management stages except for incidents related to monitoring responses to medications (Supplementary Table 8). Residents with Parkinson’s disease had an IR more than 1.5 times (RR = 1.586, 95% CI 1.318, 1.908) higher than residents without Parkinson’s disease. Administering more than five medications increased the expected rate of reported medication incidents by more than two times (RR=2.019, 95% CI 1.930, 2.111) compared with less than five medications. Interestingly, the medication IR was 12% lower for residents with dementia (p = 0.012) and 0.8% lower for each 1-year increase in age at admission (p = 0.014).
3.7 Factors Associated with the Rate of Potentially Impactful Medication IncidentsSimilar to the pattern observed for all medication incidents, the expected rate of incidents was approximately twice as high for respite residents compared with permanent residents (RR = 2.158, 95% CI: 1.513–3.079; p < 0.01) (Table 4). In addition, residents with a history of cerebrovascular accident and those taking more than five medications were found to have a higher risk of experiencing potentially harmful medication incidents. Residents with Parkinson’s disease had an incident rate more than twice as high as those without the condition (RR = 2.166, 95% CI: 1.590–2.950), which represents a greater relative risk compared with the analysis of all medication incidents.
Table 4 Multilevel multivariable Poisson regression model when considering potentially impactful medication incidentIn both analyses, there was considerable variation at the resident and facility levels for medication IRs, as denoted by the standard deviation (Tables 3, 4) of the multivariable model. Facility level variability extracted from the random effects of the multivariable model (for all medication incidents) is further visualised aged care planning region wise (de-identified) in Supplementary Fig. 2. The facility level information is reported in Supplementary Table 9.
Comments (0)