
Remember me
The participants were categorized into three groups: SCD (n = 24), MCI (n = 246), and AD (n = 76). The average age of the participants was about 72.3 years, and there was no significant difference in age between the groups (Table 1). The proportion of men and women did not differ significantly among the SCD, MCI, and AD groups (Table 1). The number of years of education did not differ significantly between the groups. Notably, BMI was lower in the AD group than in the MCI and the SCD groups. The number of participants taking the medication for hypertension, diabetes, myocardial ischemia, and liver disease was not significantly different among SCD, MCI, and AD (Table 1). None of the participants were taking cholinesterase inhibitors, NMDA receptor antagonists, or anti-amyloid agents (lecanemab, aducanumab, or donanemab) before or during the study. The proportions of participants taking antidepressants, anxiolytics/antipsychotics, and sleep disorder medications did not differ significantly among the SCD, MCI, and AD groups (Table 1). The total duration of alcohol consumption was elevated in the ascending order of SCD, MCI, and AD (7.67 ± 0.20, 10.1 ± 7.81, and 12.6 ± 8.43 years, respectively), but it was not significantly different between the groups. Smoking status was not significantly different among the three groups and the amount was low about 7–10 packs per year (Table 1). MNA-K, a nutritional status, was significantly lower in the AD group than in the SCD and MCI groups.
Table 1 General characteristics of the participantsGlobal cognitive scores assessed by the MMSE and CDR-SB were higher in the order of SCD, MCI, and AD, indicating a progressive decline in cognitive function. The higher CDR-SB and lower MMSE scores reflected greater cognitive impairment (P < 0.001; Table 1). The percentage of Aβ deposition was lowest in the SCD group (4.2%) and increased in the MCI (20.7%), and AD (56.6%) groups (P < 0.001). The proportion of participants with APOE4 variants was lowest in the SCD group and increased in the AD and MCI groups (P < 0.001, Table 1). WMH in the right and left brain determined by Schelten-Grade from the MRI scan image was lowest in the SCD group and increased in the MCI and AD groups (Table 1). Depression scores measured with MADRS were lowest in the SCD group and increased in the MCI, and AD groups, but the increase was not significant.
Gut microbiota composition of participants in the SCD, MCI, and AD groups by the cognition testThere were no significant differences in a-diversity indicated by the Shannon and Chao1 indexes (Suppl. Fig. S1A, S1B). The β-diversity was associated with cognition status using principal coordinate analysis (PCoA) ordination plots, and the centroids of each ellipsis were located differently in Bray–Curtis distance (Suppl. Fig. S1C). The MCI and AD groups were significantly separated (P = 0.008 in PERMANOVA).
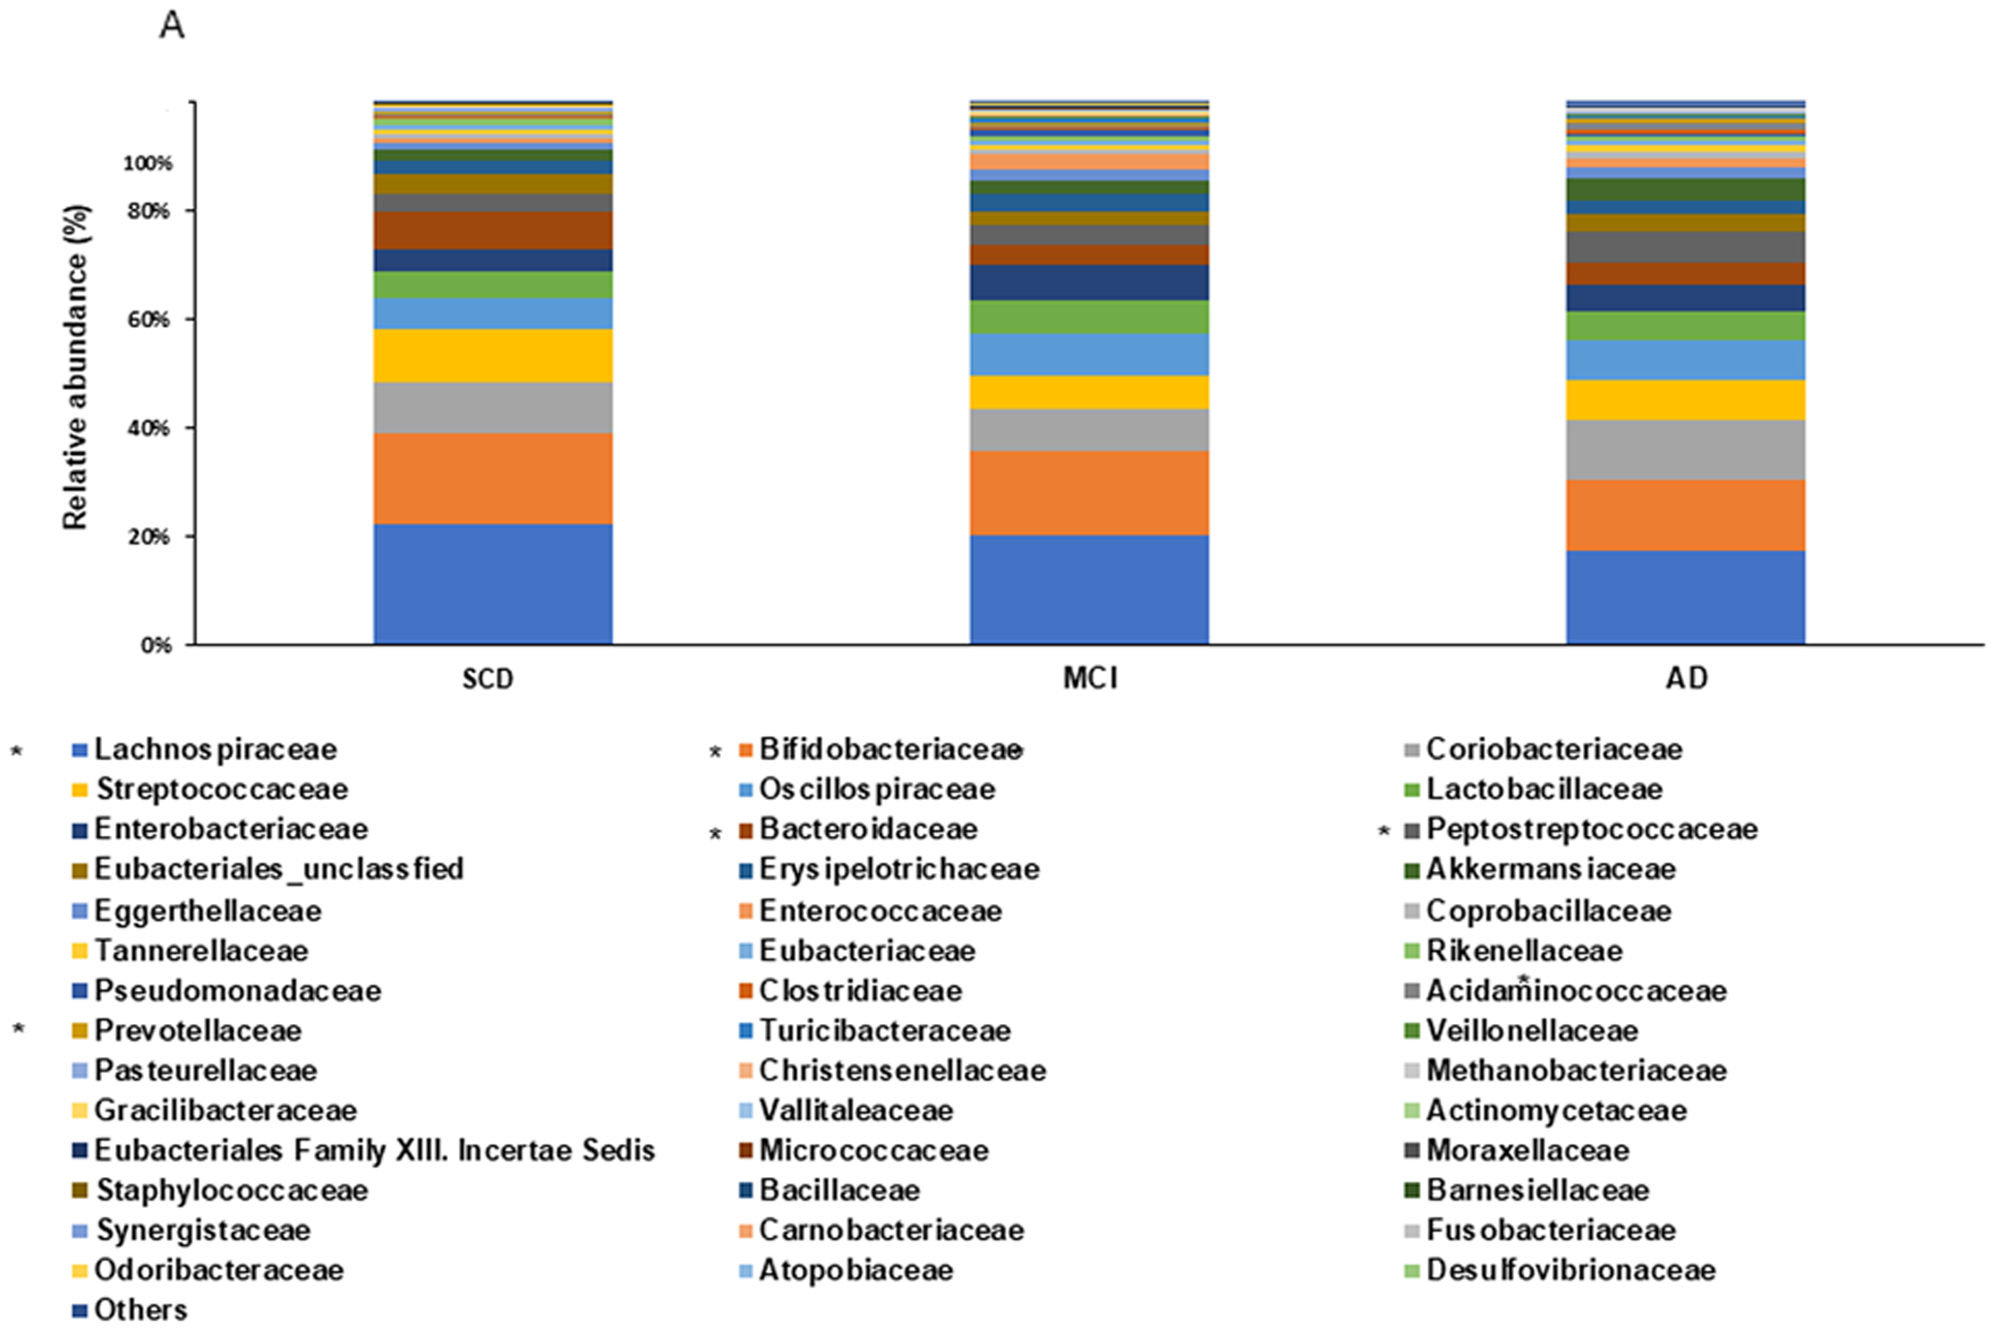
At the family level, the relative abundance of Clostridiaceae, Coriobacteriaceae, and Peptostreptococcaceae was higher in the AD than in the MCI group (P < 0.05; Fig. 1A). At the genus level, the relative abundance of Amedibacillus, Anaerobutyricum, Angustibacter, Hespellia, Lachnotalea, Lawsonibacter, Parasporobacterium, and Rhodospirillum was higher in the SCD than in the MCI and AD groups. The relative abundance of Citrobacter, Collinsella, Neglectibacter, Odoribacter, Peptostreptococcus, and Phascolarctobacterium was higher in the MCI than in the AD group (P < 0.05, Fig. 1B). Venn diagram analysis at the genus level (P < 0.05, Fig. 1C) of the gut microbiota among AD, MCI, and SCD groups revealed that 71 genera were shared among all three groups. The pairwise overlapping genera showed that Phascolarctobacterium was common to both AD and MCI groups, with its abundance showing no significant difference between these two groups but significantly differing from the SCD group. Similarly, Anaerostipes was shared by the MCI and SCD groups, with its abundance also showing no significant difference between these two groups but significantly differing from the AD group. Likewise, the AD and SCD groups shared some genera, the abundance of which showed no significant difference between these two groups but significantly differed from the MCI group. Each group also exhibited its unique genus composition; unique genera in the AD group included Hominisplanchenecus and Lentihominibacter, while the SCD group uniquely harbored Anaerosacchariphilus and Anaerobutyricum.
Fig. 1


Fecal bacterial composition among SCD, MCI, and AD. A The family level. BThe genus level. C Genus-level Venn diagram. *Significantly different among the groups at P < 0.05SCD, subjective cognitive decline, but no symptoms; MCI, mild cognitive impairment; AD, Alzheimer’s disease. The overlap between the two groups in the Venn diagram means no significant difference between them and a significant difference from the remaining group
The XGBoost model revealed that Intestinbacter barletti, Blautia glucerasea, and Romboutsia timonensis were higher in the AD than in the SCD group, while Gracilibacter thermotolerans, Rumincoccus torques, Bifidobacterium catenulactum, Anaerobutyricum halli, Eubacterium rectale, Anaerostipes hardrus, and Hespella porcina were higher in the SCD group (Fig. 2A). The random forest algorithm showed a similar pattern (Fig. S2A).
Fig. 2


Fecal bacteria prediction by the XGBoost algorithm at the species level. A Comparison between SCD and other groups. B Comparison between MCI and other groups. C Comparison between AD and other groups. D LDA scores in Lefse analysis XGBoost, Extreme Gradient Boosting; SCD, subjective cognitive decline, but no symptoms; MCI, mild cognitive impairment; AD, Alzheimer’s disease; LDA, Linear discriminant analysis; Lefse, Linear discriminant analysis Effect Size
The XGBoost and random forest algorithms showed good separation between the SCD and MCI groups with similar AUC-ROC, accuracy, sensitivity, specificity, and precision (about 0.9) (Table S1). Mogibacterium neglectum, Escherichia fergusonii, Blautia luti, and Streptococcus parasanguinis were higher in the MCI than in the SCD group. Coprococcus catus, Einsenbergiella tayi, Streptococcus salivarius, Hespella porcina, Alistipes onderdonkii, Anaerobutyricum hallii, Granulicatella adiacens, Bifidobacterium catenulactum, Phocaeicola vulgatus, Rothia mucilaginosa, and Ruminococcus torques were higher in the SCD than in the MCI (Fig. 2B). Random forest found some different bacteria when compared with XGBoost: Alistipes finegoldii, Alistipes shahii, Eubacterium rectale, Anaerobutyricum hallii, Bacteriodes uniformis, Ruminococcus torques, and Clostridium quinii were higher in the SCD group than in the MCI group (Fig. S2B).
Fecal bacteria in the MCI and AD groups were also separated using the XGBoost and random forest algorithms, but the AUC-ROC was 0.709 for XGBoost and 0.803 for random forest. Accuracy, sensitivity, and specificity were about 0.75 in both algorithms, but were higher in the random forest than in the XGBoost algorithm. Megibacterium neglectum and Blautia glucerasea were also higher in the AD than in the MCI group in the XGBoost algorithm (Fig. 2C). Random forest showed that Bifidobacterium longum, Megibacterium neglectum, Collinsella aerofaciens, Blautia glucerasea, Turicibacter sanguinis, Senegalimassila anaerobia, Streptococcus gordonii, Romboutsia timonesis, and Leuconostoc lactis were higher in the AD group than in the MCI group (Fig. S2C).
In the LEfSe analysis, the linear discriminant analysis (LDA) scores of Streptococcus salivarius, Anaerostipes hardus, Eubacterium rectale, and Gracilibacter thermotolerans were higher in the SCD group, and that of Intestinbacter barletti was higher in the AD group (Fig. 2D). However, there were no bacteria for the MCI group in the LEfSe analysis.
Associations with serum GFAP, nfl, Aβ42/Aβ40 with key bacteriaThe Aβ42/Aβ40 ratio was significantly higher in the SCD group compared to both MCI and AD groups (P < 0.05, Fig. S3A). No significant difference was observed between the MCI and AD groups for this ratio. Serum GFAP levels showed a progressive increase across cognitive impairment severity, with the AD group exhibiting significantly higher levels than both MCI and SCD groups (P < 0.05, Fig. S3B). The difference between the MCI and SCD groups was not statistically significant. For NfL concentrations, the AD group demonstrated significantly elevated levels compared to the SCD group (P < 0.05, Fig. S3B). The MCI group showed intermediate levels that did not differ significantly from either the SCD or AD groups. Correlation analysis revealed specific associations between neurodegeneration biomarkers and gut microbiota composition (Fig. S3C). The Aβ42/Aβ40 ratio showed positive correlations with Bifidobacterium catenulactum and Anaerostipes hardus. Anaerobutyricum hallii abundance was significantly negatively correlated with NfL levels (p < 0.05).
Association of cognitive status with gut microbiota after adjusting for demographic, nutritional, and brain Aβ depositionThe RDA model 1 included gut microbiota composition, age, gender, and BMI as predictor variables for cognitive function (Table 2). The explained variances for the first two RDA axes were calculated as 0.007 for RDA1 (P = 0.001) and 0.0032 for RDA2 (P = 0.139), indicating that the RDA1 axis captures a significant portion of the variability in cognitive function explained by the included variables (Table 2; Fig. 3A). The adjusted R-squared value, indicative of the overall goodness-of-fit of the model, was 0.011, suggesting that approximately 1.1% of the total variability in cognitive function can be explained collectively by the predictor variables in the model. Age significantly affected cognitive function (P < 0.0001) and gender (P = 0.05; Table 2; Fig. 3A). The association of cognitive function with the gut microbiota was affected by age (P < 0.001) and gender (P < 0.05). In RDA model 2, including nutrition and alcohol intake, the RDA1 and RDA2 axes did not differ significantly in explaining the cognitive function. However, alcohol intake was significantly associated with cognitive function (Table 2; Fig. 3A).
Table 2 Association of cognitive function and gut microbiota in different models with different confounders by redundancy analysis (RDA) analysisFig. 3


Redundancy (RDA) and network analysis of fecal bacteria and AD-related biomarkers. A Results of the RDA analysis. B Network analysis of fecal bacteria from all participants with 5 clusters by Co-Abundant Gene groups (CAG). C Network analysis of fecal bacteria categorized with SCD, MCI, and ADRed and blue lines indicated positive and negative associations between the nodes.SCD, subjective cognitive decline, but no symptoms; MCI, mild cognitive impairment; AD, Alzheimer’s disease
RDA models revealed associations between gut microbiota composition and various cognition-related parameters, including age, sex, BMI, alcohol consumption, nutritional status, depression scores, brain age, Aβ deposition, and cognitive performance. The constrained variation reflects the proportion of the total variance in gut microbiota composition that can be attributed to these explanatory variables (Fig. 3A). When APOE genetic variants were included in the RDA model, the variance explained along the first RDA axis (RDA1) significantly contributed to the explanation of cognitive function variability, with an adjusted R² of 1.76%. However, the addition of Aβ deposition and the MADRS depression score did not further increase the explanatory power of the model (R2 = 1.38%; Table 2; Fig. 3A). These findings suggest that only a small proportion of the variation in cognitive function associated with gut microbiota can be explained by demographic and clinical factors, including age, sex, BMI, nutritional status, alcohol intake, and APOE genotype.
Among the gut bacteria, high levels of Ligilactobacillus salivarius were linked to age and Aβ deposition, those related to alcohol consumption were Intestinibacter bartlettii, Streptococcus salivarius, Romboutsia timonensis, and Weissella confusa, that related to depression were Collinsella aerofaciens, and those related to APOE were Bifidobacterium longum and Blautia luti (Table 2; Fig. 3A).
Network analysisNetwork analysis, including epidemiological data, showed 5 clusters in all participants (Table 3; Fig. 3B). Cluster 1 included Bifidobacterium catenulatum as a seed bacterium and 6 nodes (bacteria) with 13 edges (connections). Bifidobacterium catenulatum was significantly higher in the SCD group than in the other groups. Among the bacteria, Intestinibacillus massiliensis was a seed bacterium in Clusters 2 and 6 nodes with 13 edges (Table 3; Fig. 3B). However, Cluster 2 did not include significantly different bacteria among the groups. Cluster 3 contained Anaerobutyricum hallii as a seed bacterium and 5 nodes with 10 edges (Fig. 3B). It included significantly higher Anaerostipes hadrus, Anaerobutyricum hallii, Anaerobutyricum soehngenii, and Blautia faecis in the SCD group than the other groups. This cluster included higher bacteria levels related to SCD than those linked to the MCI and AD groups. Clusters 4 and 5 contained the relative abundance of Enterococcus nangangensis and Parabacteroides merdae as seed bacteria and 4 for Cluster 4 and 7 nodes for Cluster 5 with 10 edges (Table 3; Fig. 3B). However, they did not include bacteria that were significantly different among the SCD, MCI, and AD groups.
Table 3 Network analysis of fecal bacteria clustering and epidemiological data with CAG scoresCognition-related parameters, including Aβ deposition, age, duration of alcohol intake, depression scores, WMH, and cognitive scores, were positively associated with AD, while nutritional scores were negatively associated with AD (Fig. 3C). BMI was positively related to MCI. Age was negatively associated with Bacillus velezensis and Blautia luti (P < 0.000001), and white matter measured by MRI was positively associated with Bacteroides thetaiotaomicron and Parabacteroides merdae (Fig. 3C). Cognitive function was positively linked to the relative abundance of Christensenella massiliensis, Enterococcus avium, Methanobrevibacter smithii, and Neglectibacter timonensis while it was negatively related to that of Alistipes finegoldii.
Network of fecal bacteria in the SCD, MCI, and AD groupsThe network analysis also showed the stability and complexity of the gut bacteria in the SCD, MCI, and AD groups (Table 4; Fig. S4A). The number of bacteria (nodes) that differed from each other was 91, 100, and 100 in the SCD, MCI, and AD groups, respectively. The number of edges was 2464, 1247, and 1920, respectively. The complexity of the bacterial community was represented by the average number of neighbors and the clustering coefficient, and they were higher in the SCD group than in the other groups (Table 4). The stability of the community detected with the network density was the highest in the SCD group.
Table 4 Stability and complexity of fecal bacteria according to the dementia statusThe multi-level sensitivity analysis demonstrated a high degree of consistency in network topological metrics across all down-sampling levels of the MCI and AD groups. Despite progressive reductions in sample size, no substantial deviations were observed in the calculated metrics across the 100 iterations at each sampling level. Key network properties—including the number of nodes and edges, average number of neighbors, number of connected components, network diameter, network radius, characteristic path length, clustering coefficient, network density, network heterogeneity, and network centralization—remained stable throughout. This stability suggests that the observed network characteristics, particularly those differentiating the SCD group, are robust and not attributable to group size imbalance or sampling variability (Table S2). These findings support the robustness of the observed network differences, particularly in the SCD group, and suggest they are not driven by sample size imbalance or statistical bias due to node overrepresentation in smaller groups.
At the species level, the microbial co-occurrence networks differed notably among the AD, MCI, and SCD groups (Fig. S4B–S4D, Table 4). The AD network (100 nodes, 1920 edges) exhibited moderate connectivity (density = 0.388, clustering coefficient = 0.43, characteristic path length = 1.612). Although the MCI network also contained 100 nodes, it had fewer connections (1247 edges), lower density (0.252), lower clustering (0.405), and increased characteristic path length (1.78), indicating weaker connectivity and enhanced modularity. In contrast, the SCD network showed the strongest connectivity (2464 edges, density = 0.602, clustering coefficient = 0.633) despite fewer nodes (91), along with the shortest characteristic path length (1.398), reflecting a greater microbial network stability (Table 4).
Network heterogeneity was highest in the MCI (0.455) and lowest in the SCD group (0.162), suggesting increasingly uneven microbial interactions with cognitive impairment (Table 4). Network centralization was also higher in the MCI (0.269) compared with the AD (0.202) and SCD (0.191) groups, further indicating disrupted microbial network structures in cognitive impairment states.
MNA-K and gut microbiotaBeta-diversity analysis revealed no significant differences in overall gut microbiota composition between MG and NMG groups (p > 0.05, Fig. 4A and B). However, machine learning analysis demonstrated that specific microbial taxa could differentiate nutritional status, with the XGBoost model achieving an AUC-ROC of 0.705, indicating moderate discriminatory power. SHAP analysis identified key microbial contributors to nutritional status classification. Species associated with malnutrition classification included Evtepia gabavorous and Neglectibacter timonensis, while Anaerobutyricum hallii and Vesimonas coprocola contributed to non-malnourished classification (p < 0.05, Fig. 4C). Correlation network analysis further elucidated microbiota-nutrition relationships (Fig. 4D). Three Streptococcus species—S. vestibularis, S. thermophilus, and S. uberis—showed strong negative correlations with nutritional status, suggesting potential associations with malnutrition. Conversely, A. hallii demonstrated a positive correlation with nutritional status. Additional species including Ellagibacter isourinifaciens, Bifidobacterium samirii, Blautia faecicola, and Howardella ureilytica also exhibited significant correlations with nutritional parameters (p < 0.05).
Fig. 4

Gut microbiome signatures associated with nutritional status. A Principal Coordinates Analysis (PCoA) plot illustrating gut microbiome composition differences between nutritional groups. B Receiver operating characteristic (ROC)curve for predicting nutritional status. C SHAP summary plot revealing key microbial features impacting model output. D. Network diagram illustrating associations between gut microbiota and nutritional status.NMG: Non-malnourished group, MG: Malnourished group
Metagenome functionThe analysis of predicted gut microbiota functions in each group showed that the bacteria at high levels in the SCD group had strong predicted associations with the degradation of aromatic compounds, butanoate metabolism, inositol phosphate metabolism, and cellular senescence pathways. The MCI and AD groups showed weaker predicted relationships with these pathways (Fig. 5A). However, the bacteria in the MCI and AD groups showed moderate predicted associations with taste transduction and immune-related pathways such as the B-cell and T-cell receptor signaling pathways, natural killer cell-mediated cytotoxicity, Fc epsilon RI signaling pathways, programmed death (PD)-ligand-1 (PD-L1) expression and the PD-1 checkpoint pathway in cancer, and neutrophil extracellular trap formation (Fig. 5A).
Fig. 5


Metagenome function of fecal bacteria. A Metagenome function of major fecal bacteria in SCD, MCI, and AD. B Metagenome function of fecal bacteria in Co-Abundant Gene groups (CAG) 3 clusterSCD, subjective cognitive decline, but no symptoms; MCI, mild cognitive impairment; AD, Alzheimer’s disease
The bacteria at high levels in the SCD group had weak predicted associations with these immune pathways. In the CAG3 among the five CAG clusters, the bacteria were predicted to be positively linked to valine, leucine, and isoleucine biosynthesis and autophagy while showing predicted negative associations with endocrine resistance including insulin resistance, lipopolysaccharide biosynthesis, and AD (Fig. 5B).
Comments (0)