
Remember me

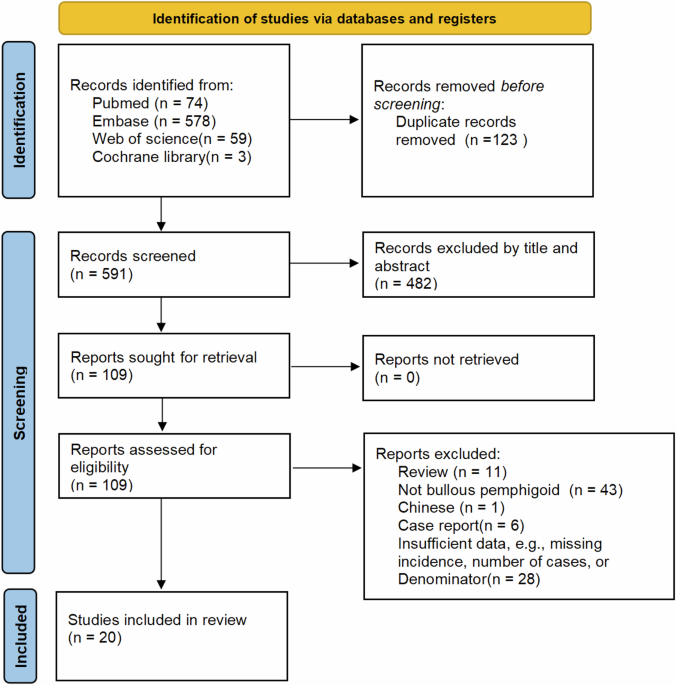
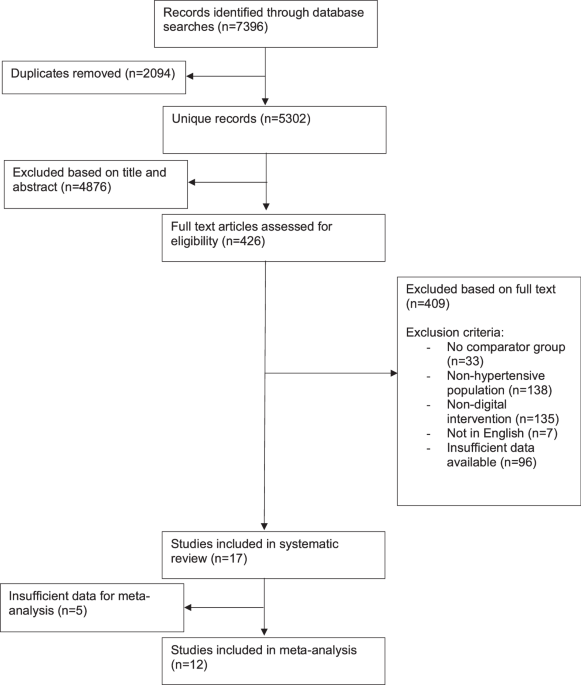
Following de-duplication, the database search resulted in 5302 titles and abstracts (Fig. 1). After review based on titles and abstracts, 426 full text articles were assessed for eligibility, leaving 17 studies included in the final analysis. 12 of these had sufficient data for meta-analysis.
Fig. 1
Flowchart of included studies.
Study characteristicsCharacteristics of the 17 included studies are outlined in Table 1. The studies were conducted in a range of countries. Most studies were conducted in outpatient [18,19,20,21,22,23,24,25] or community [26,27,28,29,30,31] clinics.
Table 1 Comparison of included study characteristics.The pooled sample size for change in systolic blood pressure was 3040 participants (range 30 [32] to 493 participants [24]). Most studies included participants based on a previous diagnosis of hypertension [18, 20,21,22,23, 25, 26, 28,29,30, 33, 34], with some specifying this to be >140/90 mmHg [22, 33] or ≥140/90 mmHg [18, 22, 23, 25, 30, 33]. The rest included individuals based on screening visit blood pressure readings ≥135/85 mmHg [31], ≥140/90 mmHg [24, 27, 32], or >140/90 mmHg at a previous clinic visit [19].
Intervention duration ranged from 3 months to 12 months. Only two studies followed participants up beyond the end of the intervention. Both had interventions lasting 3 months but followed up their participants at 6 months [30] or 12 months [18]. The outcomes at the end of the intervention period were included in the meta-analysis, as either there was an option to add medication after the end of the intervention period [30], or later end-point values were not given for each group [18].
The nature of the digital intervention varied amongst studies (Table 2). Six studies used multi-faceted interventions that involved contact with a healthcare professional as well as a digital intervention (e.g. website access and nurse telephone counselling) [19, 21, 22, 26, 29, 34]. The remaining 11 studies had fully automated digital interventions, with no direct involvement from a healthcare professional [18, 20, 23,24,25, 27, 28, 30,31,32,33]. Eight studies had interventions that involved participants self-monitoring their blood pressure [19, 22, 24, 27, 30,31,32, 34].
Table 2 Intervention characteristics.Control interventions varied between studies. Three studies had usual care as a comparator [23, 26, 28]. Ten studies had gave hypertension lifestyle advice in a ‘non-digital’ format, with eight providing written advice [18, 20, 21, 24, 27, 30,31,32] and two studies providing in-person hypertension education to control groups [19, 29]. Four studies gave control participants access to a limited element of the digital intervention received by the intervention group [22, 25, 33, 34].
11 studies had change in blood pressure as their primary outcome [19, 22,23,24,25,26,27, 30,31,32,33]. The remaining six had blood pressure measurement as secondary outcomes, with primary outcomes being change in BMI [18], change in weight [21], proportion of patients meeting pre-specified targets (glycated haemoglobin <7%, systolic blood pressure <140 mmHg, or low-density lipoprotein cholesterol <130 mg/dL) [20], study feasibility [28], and changes in health behaviour [29, 34].
Methods of blood pressure data collection included averages of repeat blood pressure measurements taken during study visits [18, 22, 24,25,26, 28, 31, 33, 34], self-reported home readings [19, 32], measurements taken in the community [27], 24-hour ambulatory blood pressure measurements [30], and was unspecified in 4 studies[20, 21, 23, 29].
Risk of biasResults from the risk of bias assessment are summarised in Fig. 2. Six studies had a high risk of bias in at least one domain [19, 20, 23,
Comments (0)