
Remember me


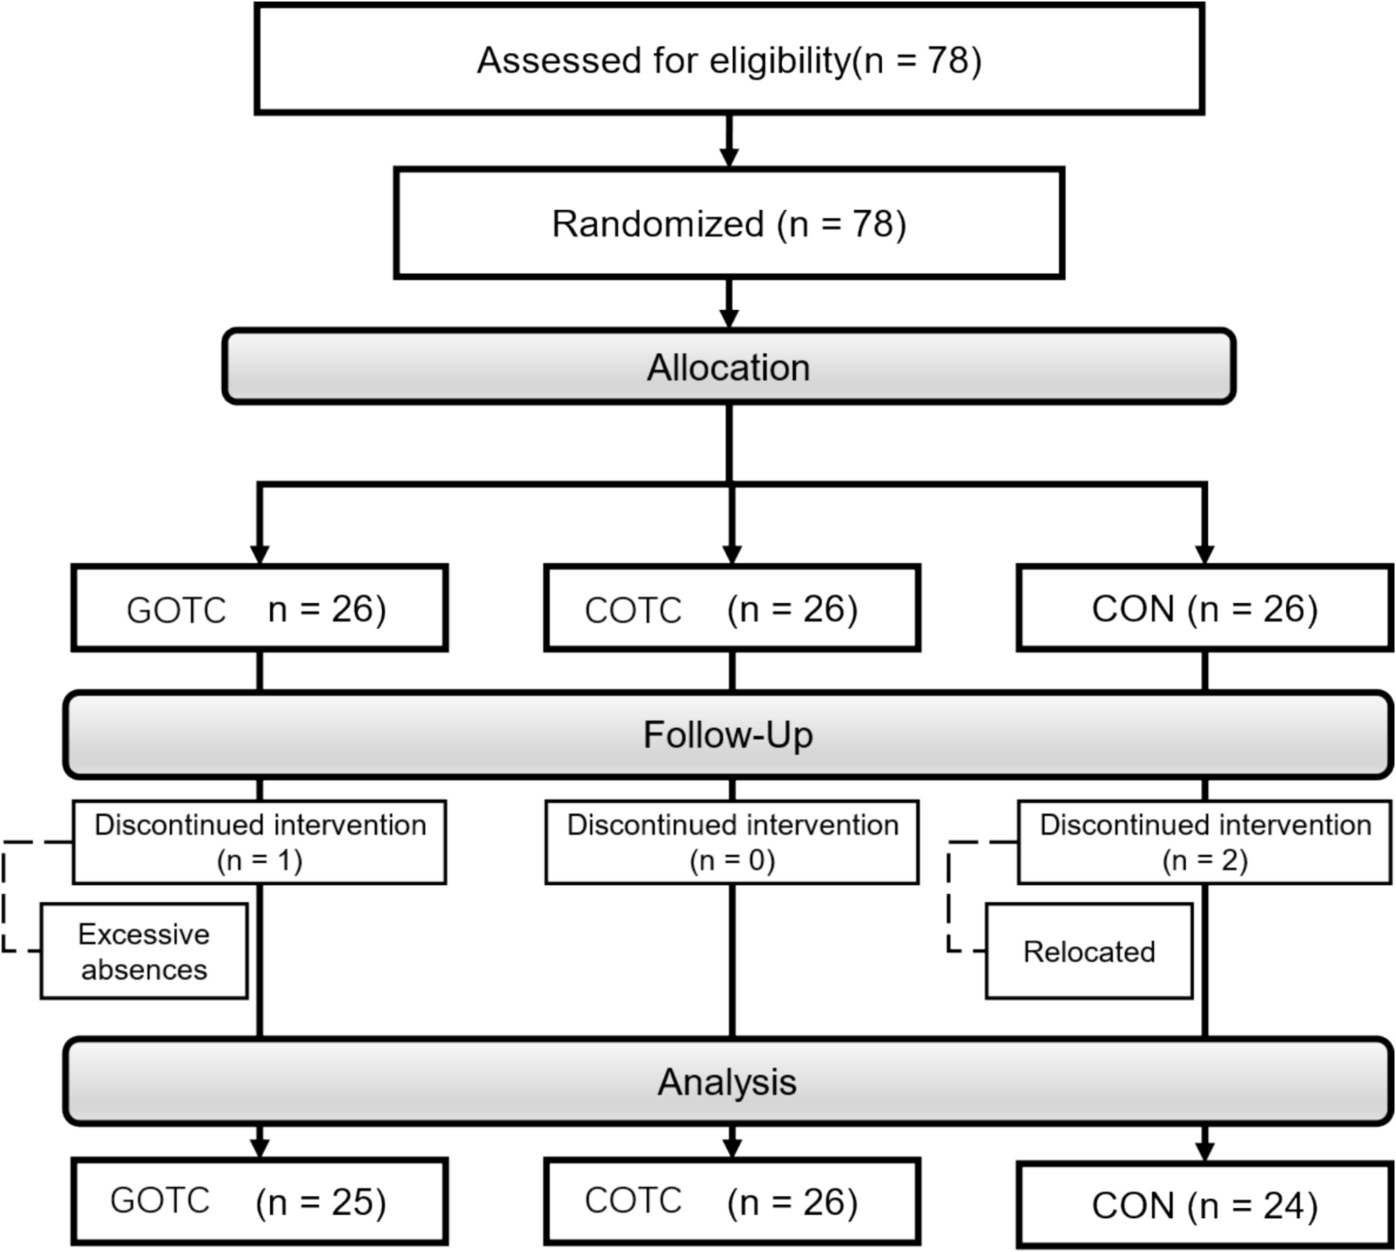
Out of the 70 patients considered, 31 (44.3%) were diagnosed with delirium (Fig. 1). At ICU admission, delirium development was significantly associated with male sex (p = 0.011) and non-administration of the COVID-19 vaccine (p = 0.009) (Table 1).
Table 1 Demographic and clinical characteristics of 70 patients, including 31 patients diagnosed with delirium, and the p-value of the statistical analysis comparing the two groups. Abbreviations: ECMO, extracorporeal membrane oxygenation; ICU, Intensive Care Unit; IMV, invasive mechanical ventilation; IQR, interquartile rangeDelirium patients also had a significantly longer ICU stay (median of 16.00 days) compared with non-delirium patients (median of 6.00 days, p < 0.001). These findings are consistent with those of the existing literature indicating that factors such as sex, COVID-19 vaccination, and length of ICU stay are critical determinants of the development and severity of delirium [82,83,84]. Other factors, such as age, comorbidities, ICU and hospital death, obesity, arterial hypertension, diabetes mellitus, dyslipidemia, use of ECMO or IMV, or medications (e.g., propofol, and midazolam), did not significantly differ between the groups.
Most patients (n = 63, i.e., 90%) were admitted to the ICU primarily because of acute respiratory failure caused by SARS-CoV-2 infection (Table S2). Furthermore, analysis of the infection waves in Portugal revealed no statistically significant differences in the distribution of infection waves between delirium and non-delirium patients (Table S3). Nevertheless, while most patients in this study were admitted during the fourth wave, accounting for 57.1% of all cases, a study on the same initial population of 1,040 patients found that the majority were actually admitted during the second and third waves of the pandemic [85], similar to trends observed in other countries.
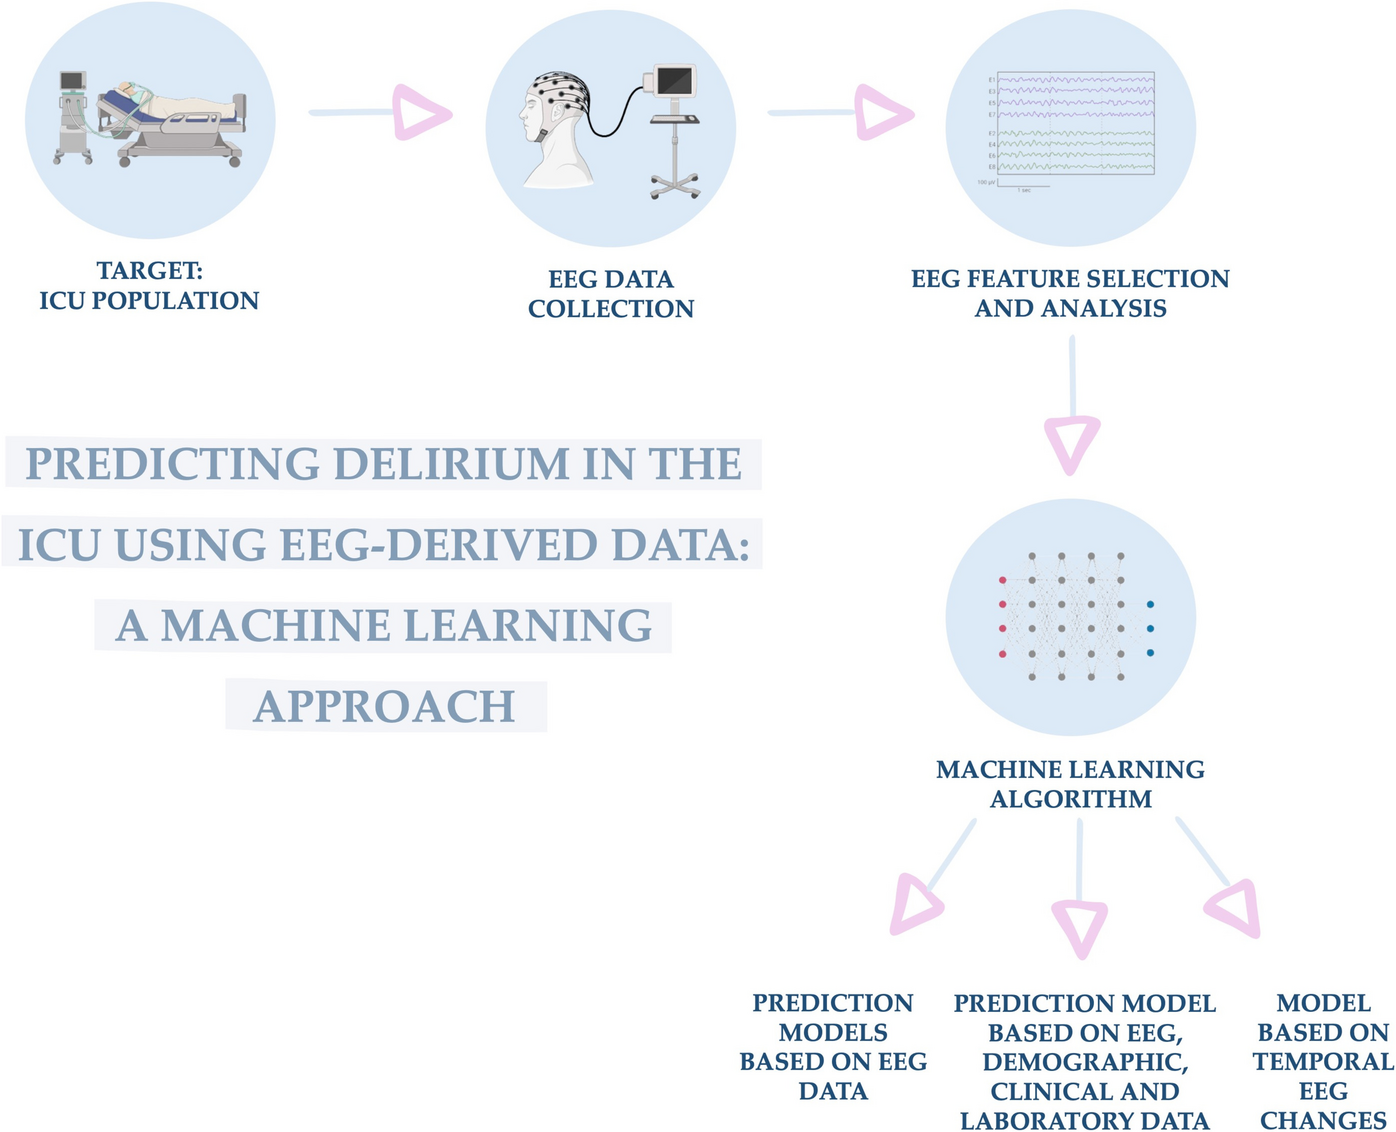
EEG-based ML modelsVarious ML models were developed to predict delirium, each employing a distinct approach.
Initially, traditional and well-known EEG variables associated with delirium development were analyzed both independently (individual EEG models) and collectively (combined EEG model). Subsequently, all collected EEG variables were considered and evaluated using a ranking score method (comprehensive EEG model). Demographic, clinical, and laboratory variables were then incorporated to assess potential improvements in model performance (model based on EEG, demographic, clinical and laboratory variables). For all these approaches, EEG data recorded at ICU admission were used, involving 70 selected patients (31 with confirmed delirium and 39 without delirium).
Lastly, a final model was developed to identify differences in EEG features before (at ICU admission) and after the diagnosis of delirium (model based on temporal EEG changes), using 22 EEGs from 11 male patients with confirmed delirium, each having EEGs recorded both before and after the delirium diagnosis.
For clarity, these models are referred to by their respective designations, as provided above, throughout the remainder of this paper.
Individual and combined delirium prediction models using literature-supported EEG variablesA preliminary exploration of EEG recordings aimed to differentiate between critically ill patients with and without delirium based on EEGs performed at ICU admission. The analysis included the selected cohort of 70 patients, 31 with confirmed delirium and 39 without.
Initially, 12 EEG features known to be associated with delirium were selected based on an extensive review of the literature and key studies. These features included increased delta activity (predominant background frequency of less than 4 Hz) [40, 51, 82, 83, 86], increased theta activity (predominant background frequency of 4 to 7 Hz) [47, 82, 83, 86], reduction in alpha activity [40, 47, 82, 83], absent reactivity [51, 87], RPPs [41, 51, 86, 88], low voltage (< 20 µV) [89], suppression [56, 90], burst-suppression/burst-attenuation [41, 47], absent PDR [86, 91], SEDs [40, 41, 47], triphasic waves [83, 86], and PDA [50, 83]. Given that none of the patients in the present study had triphasic waves or suppression, these features were excluded from the analysis, thereby reducing the set to 10 EEG features.
Various ML models were employed to assess the individual predictive power of the 10 EEG features for delirium, with the results of the best-performing model for each variable presented in Table 2.
Table 2 Performance metrics from the tenfold cross-validation of individual EEG feature-based models for delirium prediction in critically ill patients. EEG variables were selected and ranked according to their predictive value using the Information Gain scoring method. The reported metrics include AUC, accuracy, precision, sensitivity, and specificity for each EEG variable analyzed. Abbreviations: AUC, area under the curve; EEG, electroencephalography; PDR, posterior dominant rhythm; PDA, polymorphic delta activity; RPPs, rhythmic or periodic patterns; SEDs, sporadic epileptiform discharges; SVM, support vector machineThe model using a predominant background frequency of 4 to 7 Hz (increased theta activity) as a predictor achieved the highest AUC (0.667) among the individual EEG feature models. However, it is unbalanced by standard performance metric definitions, strongly favoring sensitivity (0.839)—indicating it captured most actual delirium cases—over specificity (0.487), which increased the rate of false positives. While this trade-off represents an improvement compared to the other models in this study, it highlights a limitation that must be carefully managed in clinical applications. Additionally, the model correctly classified 64.3% of cases, achieving an accuracy of 0.643, and had a precision of 0.565, meaning that 56.5% of its positive predictions were correct.
In comparison, the second-best model, corresponding to a predominant background frequency of less than 4 Hz, had a lower AUC (0.600), accuracy (0.614), and sensitivity (0.419) but a higher specificity (0.769), making it more suitable for minimizing false positives. Although imbalanced, according to the standard performance metric, this variation may be acceptable in applications prioritizing the reduction of false positives.
The other individual models demonstrated notably lower performance metrics. For instance, the model using absent reactivity as a predictor feature had an AUC of 0.488, accuracy of 0.543, precision of 0.000, sensitivity of 0.000, and specificity of 0.974. Despite its high specificity, these poor metrics—particularly the near-random AUC and complete inability to identify true positive cases—reflect the limited predictive power of this individual feature.
Additionally, a considerable number of individual EEG models (i.e., absent reactivity, reduction in alpha activity, burst-suppression/burst-attenuation, PDA, SEDs, low voltage, and RPPs) displayed high specificity, correctly identifying most negative cases, but their sensitivity was low, failing to detect more than half of the true positive cases. Even models with moderate AUCs, such as low voltage or RPPs, had sensitivity below 0.5, limiting their reliability in identifying delirium. This pattern highlights the inherent challenges of using single EEG variables to capture the complexity of this condition and underscores their limited practicality for clinical use, particularly in ICU settings where identifying delirium cases is critical.
Overall, the analysis highlights the difficulty in optimizing both sensitivity and specificity for most EEG features. Although several variables demonstrate high specificity, effectively avoiding false positives, they often lack sensitivity, failing to detect many true delirium cases. In addition, most models’ AUCs fall within the poor-to-fair range, further emphasizing the limited predictive power of individual features. A multivariable approach or integration of these features into a more complex predictive model could improve diagnostic accuracy and reliability, reducing both false positives and false negatives.
To further assess the predictive performance of the selected literature-supported EEG variables for delirium, a combined model was developed by incorporating all 10 identified EEG features. The features were then ranked, and only those that significantly enhanced the model’s accuracy were retained (Table 3).
Table 3 Performance metrics from the tenfold cross-validation of the Logistic Regression combined EEG model for delirium prediction in critically ill patients. EEG variables were ranked based on their predictive contribution using the Information Gain scoring method. The reported metrics include AUC, accuracy, precision, sensitivity, and specificity. Abbreviations: AUC, area under the curve; EEG, electroencephalography; PDR, posterior dominant rhythm; RPPs, rhythmic or periodic patternsThe combined model, developed using Logistic Regression, achieved an AUC of 0.700. Although slightly higher than the best individual AUC (0.667, achieved by the model using predominant background frequency of 4 to 7 Hz), this difference does not represent a substantial improvement.
This inclusive approach prioritized five EEG features: (1) predominant background frequency of 4 to 7 Hz, (2) RPPs, (3) predominant background frequency of less than 4 Hz, (4) low voltage, and (5) PDR, specifically its absence (Figure S1). By incorporating these features, the combined model demonstrated an accuracy of 0.643, matching the best-performing individual model and outperforming others, such as low voltage (0.586) and predominant background frequency of less than 4 Hz (0.614). It achieved a precision of 0.615, specificity of 0.744, and sensitivity of 0.516. While its sensitivity was lower than that of the best-performing individual model (0.839), it exceeded most others and offered a modest improvement in specificity compared with the best individual model (0.487), although it remained below features with exceptionally high specificity, such as absent reactivity (0.974) and low voltage (0.949). Overall, the combined model demonstrated a better balance between sensitivity and specificity than the individual models, which can be useful in settings where false positives can be tolerated to reduce false negatives.
The confusion matrix (Table S4) provides further insight into the model’s predictive performance and highlights its limitations. Among the 39 negative cases, 29 were true negatives and 10 were false positives, contributing to a specificity of 0.744. Similarly, out of the 31 positive cases, 16 were true positives and 15 were false negatives, resulting in a sensitivity of 0.516. Although the model reduced the overprediction of delirium compared with the individual models, it failed to identify a significant proportion of true delirium cases, which could result in underdiagnosis in ICU scenarios where early detection of delirium is vital for patient outcomes.
In conclusion, although the combined EEG features model demonstrated a modestly better overall performance compared with the individual models, the combination of EEG-specific variables alone still provided limited diagnostic accuracy.
Delirium prediction model using comprehensive EEG variablesSubsequently, an advanced model leveraging all 32 collected EEG variables (Table S1) was developed to identify differences in EEG recordings between critically ill COVID-19 patients with and without delirium. The same two groups of patients, with EEGs recorded at ICU admission, were used as in previous models.
After the feature selection process, categorical variables with low variability, low frequency, or absence in one group, as well as continuous variables with > 30% missing values or low variance, were removed, leaving 22 of the original set of 32 features for model development.
Five key EEG features were identified based on their predictive contribution, as determined by the Information Gain scoring method, namely: a predominant background frequency of 4 to 7 Hz (increased theta activity), absence of state changes, absence of normal voltage, absence of a predominant background frequency of 8 to 13 Hz, and presence of RPPs (Table 4).
Table 4 Performance metrics from the tenfold cross-validation of the Naïve Bayes comprehensive EEG model for delirium prediction in critically ill patients. EEG variables were ranked based on their predictive contribution using the Information Gain scoring method. The reported metrics include AUC, accuracy, precision, sensitivity, and specificity. Abbreviations: AUC, area under the curve; EEG, electroencephalography; RPPs, rhythmic or periodic patternsBy integrating all the collected EEG features, the model achieved an AUC of 0.733, which was the highest value obtained among all models relying exclusively on EEG data. The model also reached an accuracy of 0.671, correctly classifying 67.1% of the cases, which is only slightly better than models with fewer EEG features, such as the combined Logistic Regression model (accuracy of 0.643). Although this represents an improvement over previous models, the difference is modest and highlights the challenges of achieving significant predictive gains by merely expanding the set of EEG features.
From the confusion matrix (Table S5), 27 of the 39 actual negative cases were correctly classified as negatives (true negatives), while 12 were misclassified as positives (false positives). Among the 31 actual positive cases, the model correctly identified 20 true positives but missed 11 false negatives. Compared with the combined Logistic Regression model (with sensitivity of 0.516, and specificity of 0.744), this model demonstrated better sensitivity at the cost of reduced specificity. This trade-off reflects an improved ability to detect true delirium cases, but the increased false positives may pose challenges in clinical settings.
While the model showed improved predictive performance, particularly in sensitivity, the modest gains in AUC and accuracy highlight the limitations of relying solely on EEG features for delirium prediction. These results suggest diminishing returns from adding more features to the model, emphasizing the need for further refinement, such as integrating EEG data with clinical variables, to achieve more meaningful improvements in diagnostic accuracy and reliability.
A nomogram was developed to visually represent the importance of the five key EEG findings in predicting delirium in critically ill patients (Fig. 2).
Fig. 2
Nomogram of the delirium prediction model using comprehensive EEG variables. The variables were categorized as follows: predominant background frequency of 4 to 7 Hz, EEG state changes, low voltage (< 20 µV), predominant background frequency of 8 to 13 Hz, and RPPs were indicated by 1 for present and 0 for absent. Abbreviations: EEG, electroencephalography; RPPs, rhythmic or periodic patterns
To use the nomogram, each feature is given a value based on its presence or level, and the blue markers indicate the values or categories associated with delirium development in this study cohort. For instance, a patient with an EEG with a predominant background frequency of 4 to 7 Hz (1), absence of state changes (0), absence of normal voltage (0), absence of a predominant background frequency of 8 to 13 Hz (0), and presence of RPPs (1) would have a predicted probability of approximately 93% for developing delirium. Ultimately, by integrating multiple EEG features into a single visual tool, this nomogram offers an accessible and practical method for clinicians to identify patients at a higher risk of developing delirium.
Delirium prediction model based on EEG, demographic, clinical and laboratory variablesTo explore the impact of including additional variables, demographic, clinical, and laboratory factors (665 features) were combined with the 32 initially collected EEG variables. This approach aimed to determine whether these additions would influence the model’s performance.
After data refinement, the feature set was reduced to 127 variables (22 EEG features and 105 demographic, clinical or laboratory features—Table S6) by removing those with low variability, frequency, or high missing data.
As in the previously developed models, two patient groups were used, each consisting of 31 delirium patients and 39 non-delirium patients with EEGs recorded at ICU admission.
From the refined feature set, the algorithm identified five key factors associated with delirium development at ICU admission: predominant background frequency of 4 to 7 Hz (increased theta activity), male sex, non-administration of COVID-19 vaccination, administration of sodium chloride, and absence of EEG state changes (Table 5).
Table 5 Performance metrics from the tenfold cross-validation of the Logistic Regression model incorporating EEG, demographic, clinical, and laboratory variables for delirium prediction in critically ill patients. EEG, demographic, clinical, and laboratory variables were ranked based on their predictive contribution using the Information Gain scoring method. The reported metrics include AUC, accuracy, precision, sensitivity, and specificity. Abbreviations: AUC, area under the curve; COVID-19, Coronavirus Disease 2019; EEG, electroencephalographyThe updated model achieved an AUC of 0.835, which is the highest among all tested models. This represents an improvement over the best individual EEG model (AUC = 0.667, Table 2), the combined Logistic Regression EEG model (AUC = 0.700, Table 3), and the comprehensive Naïve Bayes EEG model (AUC = 0.733, Table 4). The accuracy of 0.714 also surpasses the previous combined and comprehensive models (Tables 3 and 4: 0.643 and 0.671, respectively), demonstrating the value of demographic, clinical, and laboratory variables.
The model exhibited a specificity of 0.795, reflecting a stronger ability to avoid false positives while maintaining a sensitivity of 0.613, which was competitive with the comprehensive EEG model (sensitivity = 0.645, Table 4). This balance between sensitivity and specificity makes the updated model a more practical tool for ICU settings, where false positives may be less concerning than missing true delirium cases.
According to the confusion matrix (Table S7), the model correctly classified 31 out of 39 non-delirium cases (true negatives) and 19 out of 31 delirium cases (true positives), resulting in 8 false positives and 12 false negatives. Although the slight decrease in sensitivity compared with the best individual EEG model may increase the risk of missed delirium cases, the improvement in specificity suggests fewer unnecessary interventions.
By integrating EEG data with demographic, clinical, and laboratory variables, this model offers a more practical and enhanced approach to delirium prediction. The inclusion of factors such as sex, COVID-19 vaccination status, and sodium chloride administration expands the model’s predictive scope beyond EEG features alone, while also addressing potential confounding factors to prevent bias from underlying patient characteristics. This approach highlights the importance of combining multimodal data sources to enhance predictive accuracy and clinical applicability.
A nomogram was developed to visually represent the importance of the five key EEG and demographic, clinical, or laboratory features in predicting delirium in critically ill patients (Fig. 3).
Fig. 3
Nomogram for the delirium prediction model using EEG, demographic, clinical, and laboratory variables. The variables were categorized as follows: predominant background frequency of 4 to 7 Hz, COVID-19 vaccination, administration of sodium chloride, and EEG state changes were indicated by 1 for present and 0 for absent; sex was categorized as 1 for female and 0 for male. Abbreviations: COVID-19, Coronavirus Disease 2019; EEG, electroencephalography
To use the nomogram, each feature is given a value based on its presence or level, and the blue markers indicate the values or categories associated with delirium development in this study cohort. For instance, a patient with an EEG with a predominant background frequency of 4 to 7 Hz (1), male sex (0), no COVID-19 vaccine administration (0), administration of sodium chloride (1), and absence of state changes in EEG (0) would have a predicted probability of approximately 95% for developing delirium.
Delirium prediction model based on temporal EEG changesA final model was developed to identify differences in the EEG features before and after delirium diagnosis. This study involved 22 EEGs from 11 male patients with delirium, each having EEGs recorded before (at ICU admission) and after delirium diagnosis. The interval between the first and last EEG ranged from 4 to 54 days, with an average of 15.82 ± 13.05 days. The median patient age was 46.82 ± 15.55 years.
After the feature selection process, categorical variables with low variability, infrequent occurrences, or absence in one group, as well as continuous variables with 30% missing values or low variance, were excluded. This reduced the initial set of 32 EEG features to 7 for model development.
Among all the ML models tested, a Naïve Bayes model prioritizing five key EEG variables, namely PDR, predominant background frequency of 8 to 13 Hz, AP gradient, continuous EEG, and predominant background frequency of 4 to 7 Hz, demonstrated the best performance. The model achieved an AUC of 0.950 and an accuracy, sensitivity, precision, and specificity of 0.818, indicating highly accurate discrimination between pre- and post-diagnosis states (Table 6).
Table 6 Performance metrics from the tenfold cross-validation of the Naïve Bayes model for delirium prediction using temporal EEG changes in critically ill patients. EEG features were ranked based on their predictive value using the Information Gain scoring method. The reported metrics include AUC, accuracy, precision, sensitivity, and specificity. Abbreviations: AP, anterior–posterior; AUC, area under the curve; EEG, electroencephalography; PDR, posterior dominant rhythmThe confusion matrix (Table S8) revealed that of the 11 EEGs recorded after the delirium diagnosis, 9 were correctly classified as “after” (true positives), while two were misclassified as “before” (false negative). Similarly, among the 11 EEGs recorded before the diagnosis, 9 were correctly classified as “before” (true negatives), while two were misclassified as “after” (false positives).
The interval between the delirium diagnosis and the post-EEG evaluation ranged from 1 to 29 days, with an average of 7.45 ± 7.24 days. EEGs conducted before the diagnosis of delirium revealed that its development was associated with the absence of PDR, predominant background frequency of 8 to 13 Hz, AP gradient, and continuous EEG activity. Additionally, it was linked to the presence of a predominant background frequency of 4 to 7 Hz (Fig. 4). EEG analysis after delirium diagnosis revealed significant shifts in brain activity, including the re-emergence of PDR, acceleration of predominant background frequencies, restoration of the AP gradient, and reappearance of continuous EEG activity (Figure S2). These findings suggest partial restoration of cortical activity as delirium begins to resolve or is treated, supporting previous knowledge that EEG patterns typically normalize as the condition subsides [40, 83, 92,93,94].
Fig. 4
Nomogram for the delirium prediction model based on temporal EEG changes targeting EEG changes before delirium diagnosis. The variables were categorized as follows: PDR, predominant background frequency of 8 to 13 Hz; AP gradient, continuous EEG; and predominant background frequency of 4 to 7 Hz were indicated by 1 for present and 0 for absent. Abbreviations: AP, anterior–posterior; EEG, electroencephalography; PDR, posterior dominant rhythm
This model highlights the value of the temporal EEG analysis in monitoring delirium progression and recovery. Compared with earlier models relying on static EEG, demographic, clinical, and laboratory variables, the incorporation of temporal dynamics enabled superior predictive performance and provided a deeper understanding of EEG changes associated with delirium.
Nevertheless, although this model demonstrates strong predictive performance in distinguishing pre- and post-diagnosis EEG states, its primary utility lies in monitoring temporal changes in patients already diagnosed with delirium. Its focus complements the primary models developed in this study, which aimed to predict the risk of delirium at ICU admission.
A nomogram was developed specifically to illustrate the importance of these EEG features recorded before delirium onset, highlighting their role in distinguishing between EEG recordings before and after delirium diagnosis (Fig. 4).
To use it, each EEG feature is assigned a value based on its presence or level, with blue markers indicating the values or categories associated with delirium development in this study cohort. For example, if a patient has absent PDR (0), absent predominant background frequency of 8 to 13 Hz (0), absent AP gradient (0), absent continuous EEG (0), and predominant background frequency of 4 to 7 Hz (1), the nomogram predicts an approximate 96% probability that these EEG findings frequently precede delirium diagnosis, indicating a higher likelihood.
Overall, this pre- and post-diagnosis model adds a temporal dimension and is adaptable to changes in patient status. Integrating the nomogram into clinical practice may facilitate better monitoring and intervention strategies for delirium by helping clinicians understand and quantify changes in EEG features over time, thereby enhancing the assessment of delirium progression.
Comments (0)