
Remember me


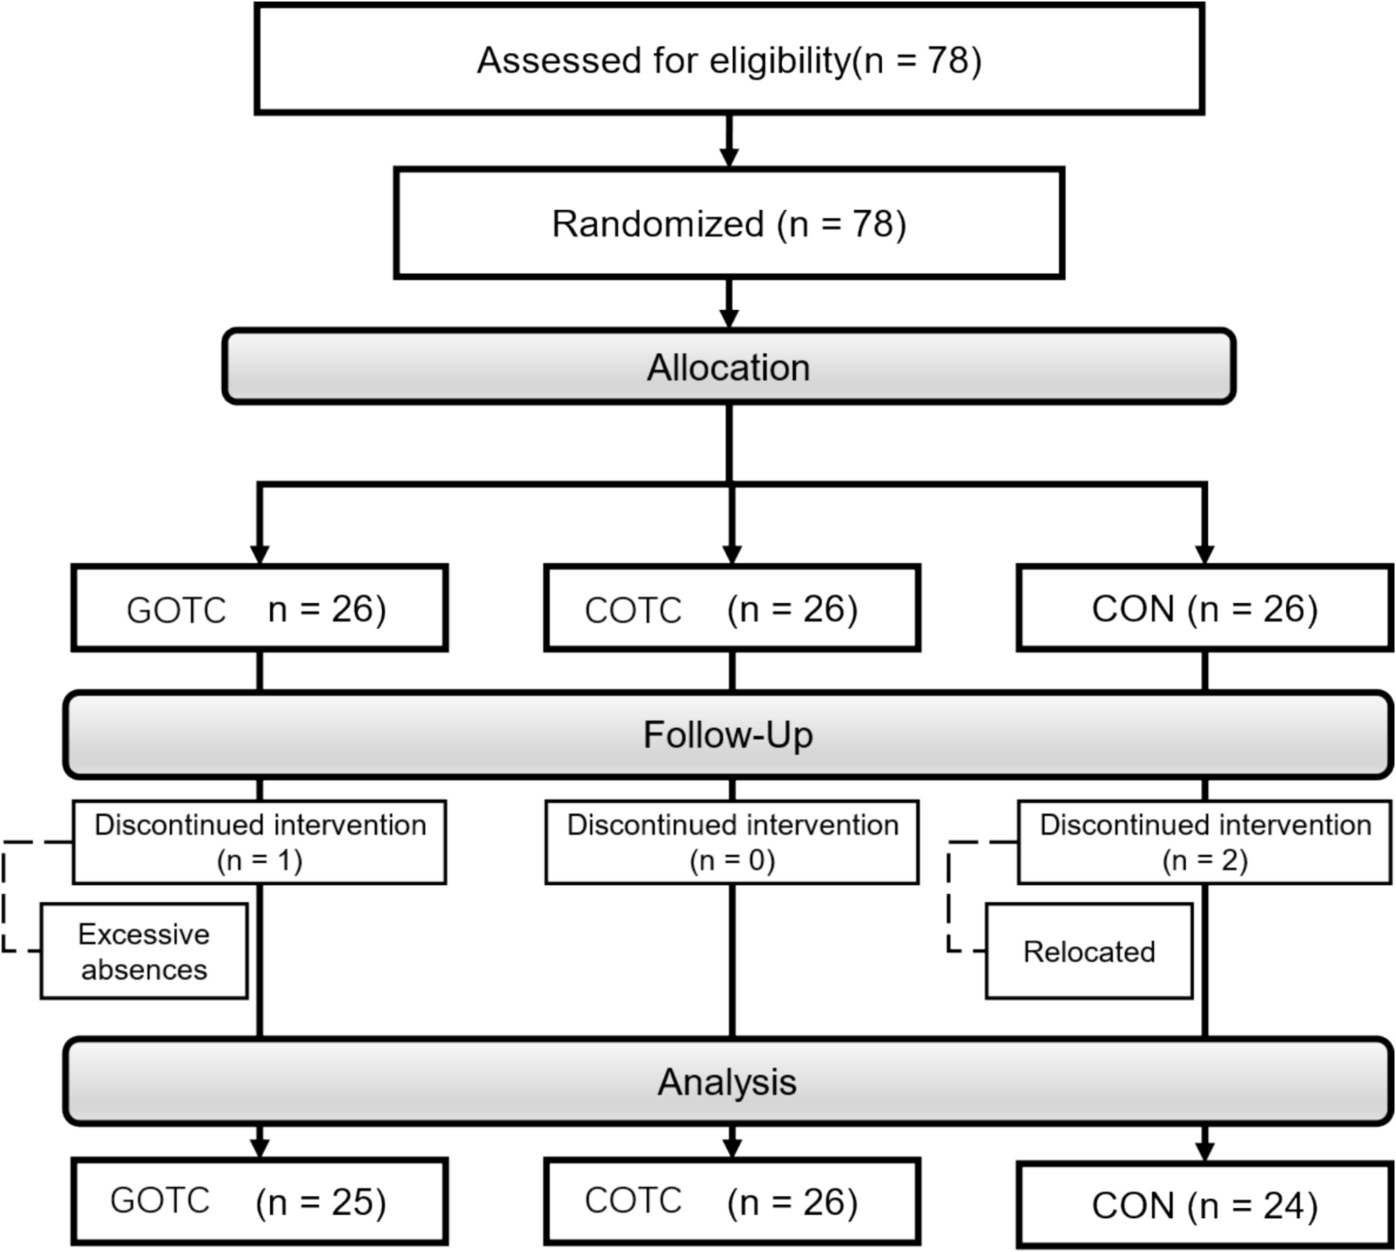
Figure 1 shows the study flow. From 2017 to 2021, annual respondents ranged from 5126 to 6580. Among them, 4701 individuals responded at least three times. After excluding 658 with missing SF-8 MCS or PCS data, 4043 participants were included in the final analysis. Table 1 shows the characteristics of the 4043 participants included in the analysis; a total of 4043 participants were included in the analysis. The median (IQR) age at baseline was 78.8 years (75.8–82.5), and 2254 participants (56%) were women. The median (IQR) MCS and PCS scores at baseline were 52.9 (48.4–55.0) and 50.0 (44.0–54.0), respectively. At baseline, 3777 participants (93%) were classified as independent. The characteristics and outcome occurrences of ineligible patients are presented in Supplemental Tables 5 and 6. No remarkable differences in baseline covariates were observed between eligible and ineligible participants; however, the incidence of outcomes was relatively higher among ineligible participants.
Fig. 1
Study flow diagram. MCS, mental component scale; PCS, physical component scale
Table 1 Baseline characteristics of the participantsHRQOL trajectory groupingFigure 2 illustrates the trajectories of MCS, PCS, and their change scores. MCS trajectory patterns were classified into three groups: decline (n = 376, 9.3%), high-stable (n = 3160, 78.2%), and increase (n = 507, 12.5%). PCS trajectory patterns were also categorized into three groups: low-stable (n = 434, 10.7%), high-stable (n = 3265, 80.8%), and decline (n = 344, 8.5%). For MCS change score trajectories, participants were grouped into decline (n = 475, 11.7%), stable (n = 3276, 81.0%), and increase (n = 292, 7.2%). Similarly, PCS change score trajectories were categorized as decline (n = 442, 10.9%), stable (n = 3292, 81.4%), and increase (n = 309, 7.6%). Supplementary Tables 7–10 present participants’ characteristics according to these trajectory classifications.
Fig. 2
Trajectories of MCS, PCS, and change score of those MCS, mental component scale; PCS, physical component scale
Outcome occurrenceDuring the follow-up period, 850 composite outcome events were identified, comprising 518 cases of LOI and 522 deaths. The incidence rates (95% CI) per 1000 person-years for the composite outcome, LOI, and death were 42.5 (39.8–45.2), 25.9 (23.9–28.1), and 24.8 (22.8–26.8), respectively. The median (IQR) follow-up duration was 66.4 (48.0–73.0) months.
Association of outcomes with HRQOL-component-stratified trajectoriesSupplementary Figs. 5–8 show Kaplan–Meier survival estimates for the trajectory-stratified composite outcome–free survival. In both MCS and PCS, the decline group had shorter LOI-free survival. The MCS trajectories were not associated with the risk of composite outcome. However, the MCS trajectories were associated with LOI (Table 2). Relative to the high-stable group in MCS, the decline group was associated with a higher risk of LOI (adjusted HR, 1.90; 95% CI, 1.18–3.07). The PCS trajectories were associated with the risk of composite outcome, LOI, and death. Relative to the high-stable group in PCS, the decline group was associated with higher risks of composite outcome (adjusted HR, 1.68; 95% CI, 1.14–2.47), LOI (adjusted HR, 1.70; 95% CI, 1.04–2.77), and death (adjusted HR, 2.01; 95% CI, 1.22–3.33). The MCS change score trajectories were associated with the risk of composite outcome and LOI. Relative to the stable group in MCS change score, the decline group was associated with higher risks of composite outcome (adjusted HR, 1.51; 95% CI, 1.04–2.18) and LOI (adjusted HR, 1.84; 95% CI, 1.15–2.97); the increase group was associated with lower risks of composite outcome (adjusted HR, 0.26; 95% CI, 0.11–0.57) and LOI (adjusted HR, 0.25; 95% CI, 0.10–0.65). The PCS change score trajectories were associated with the risk of composite outcome and death. Relative to the stable group in PCS change score, the decline group was associated with higher risks of composite outcome (adjusted HR, 1.66; 95% CI, 1.17–2.37) and death (adjusted HR, 1.96; 95% CI, 1.26–3.06). However, compared with the stable group in PCS change score, the increase group in PCS change score was not associated with lower risks of composite outcome (adjusted HR, 1.07; 95% CI, 0.61–1.89) and LOI (adjusted HR, 1.22; 95% CI, 0.60–2.49) (Table 2).
Table 2 Association of outcomes according to trajectories of each component of HRQOLAssociation of outcomes with nine MCS- and PCS (change score)-trajectory-stratified classesSupplementary Figs. 9 and 10 show Kaplan–Meier survival estimates for MCS- and PCS-simultaneously stratified composite outcome–free survival, as well as those based on change scores. The MCS- and PCS-stratified trajectories were significantly associated with the risks of composite outcome, LOI, and death (Table 3). The decline trajectory in MCS and PCS (class 9), compared with the high-stable trajectory in MCS and PCS (class 1), was associated with higher risks of composite outcome (adjusted HR, 2.90; 95% CI, 1.73–4.87), LOI (adjusted HR, 3.76; 95% CI, 2.00–7.09), and death (adjusted HR, 2.68; 95% CI, 1.33–5.39). The MCS and PCS change-score trajectory-stratified nine groups were associated with the risks of composite outcome, LOI, and death. The decline trajectory in MCS and PCS change score (class 9), compared with the stable trajectory in MCS and PCS change score (class 1), was associated with higher risks of composite outcome (adjusted HR, 3.06; 95% CI, 1.84–5.09), LOI (adjusted HR, 3.76; 95% CI, 2.01–7.03), and death (adjusted HR, 3.13; 95% CI, 1.66–5.90). The increase trajectory in MCS change score and stable trajectory in PCS change score (class 4), compared with the stable trajectory in MCS and PCS change score (class 1), was associated with lower risks of composite outcome (adjusted HR, 0.11; 95% CI, 0.03–0.48), LOI (adjusted HR, 0.08; 95% CI, 0.01–0.59), and death (adjusted HR, 0.13; 95% CI, 0.02–0.96) (Table 3).
Table 3 Association of outcomes according to 9 classes stratified by MCS and PCS (change score) trajectoriesSensitivity analysisThe results of the sensitivity analyses were generally consistent with those of the main analyses. Supplementary Table 11 shows the association between trajectory patterns of each component of HRQOL and outcomes occurring after 60 months. The MCS trajectories were associated with the risk of composite outcome and LOI, all occurring after 60 months. Relative to the high-stable group in MCS, the decline group was associated with higher risks of composite outcome (adjusted HR, 1.63; 95% CI, 1.06–2.51), and LOI (adjusted HR, 2.15; 95% CI, 1.25–3.69), all occurring after 60 months. The PCS trajectories were associated with the risks of composite outcome, LOI, and death. Relative to the high-stable group in PCS, the decline group was associated with higher risks of composite outcome (adjusted HR, 2.32; 95% CI, 1.57–3.45), LOI (adjusted HR, 2.34; 95% CI, 1.38–3.96), and death (adjusted HR, 3.06; 95% CI, 1.94–4.82), all occurring after 60 months. The MCS change score trajectories were associated with the risks of composite outcome, LOI, and death, all occurring after 60 months. Relative to the stable group in MCS change scores, the increase group was associated with lower risks of composite outcome (adjusted HR, 0.32; 95% CI, 0.13–0.78), LOI (adjusted HR, 0.30; 95% CI, 0.10–0.91), and death (adjusted HR, 0.36; 95% CI, 0.14–0.98); and the decline group was associated with a higher risk of composite outcome (adjusted HR, 1.51; 95% CI, 1.00–2.28), all occurring after 60 months. The PCS change score trajectories were associated with the risks of composite outcome, LOI, and death. Relative to the stable group in PCS change score, the decline group was associated with higher risks of composite outcome (adjusted HR, 2.25; 95% CI, 1.57–3.23), LOI (adjusted HR, 2.11; 95% CI, 1.28–3.46), and death (adjusted HR, 2.58; 95% CI, 1.71–3.90), all occurring after 60 months.
Supplementary Table 12 shows the association of outcomes according to trajectories of each component of HRQOL among participants who were independent at baseline. The MCS trajectories were associated with the risks of composite outcome and LOI among the population. Relative to the high-stable group in MCS, the decline group was associated with higher risks of composite outcome (adjusted HR, 1.50; 95% CI, 1.00–2.25), and LOI (adjusted HR, 2.03; 95% CI, 1.24–3.33) among the independent population. The PCS trajectories were associated with the risks of composite outcome, LOI, and death. Relative to the high-stable group in PCS, the decline group was associated with higher risks of composite outcome (adjusted HR, 1.78; 95% CI, 1.19–2.66), LOI (adjusted HR, 1.87; 95% CI, 1.12–3.10), and death (adjusted HR, 1.98; 95% CI, 1.18–3.32). The MCS change score trajectories were associated with the risks of composite outcome and LOI among the population. Relative to the stable group in MCS change score, the increase group was associated with lower risks of composite outcome (adjusted HR, 0.20; 95% CI, 0.08–0.52), and LOI (adjusted HR, 0.23; 95% CI, 0.08–0.66), while the decline group was associated with a higher risk of LOI (adjusted HR, 1.73; 95% CI, 1.05–2.84) among participants who were independent at baseline. The PCS change score trajectories were associated with the risks of composite outcome, LOI, and death among the population. Relative to the stable group in PCS change score, the decline group was associated with higher risks of composite outcome (adjusted HR, 1.75; 95% CI, 1.21–2.51), LOI (adjusted HR, 1.64; 95% CI, 1.02–2.65), and death (adjusted HR, 1.93; 95% CI, 1.22–3.06) among participants who were independent at baseline.
Comments (0)