
Remember me


In a prior investigation, the mbSUS was employed as an in vivo method to screen for proteins from a cDNA plasmid library that could potentially interact with hOCT [17]. Notably, the study identified CD63 as a potential interaction partner of hOCT3. To validate this interaction, we conducted further experiments using the mbSUS technique. In these experiments, bait-expressing yeast (specifically, THY.AP4) was used, which expressed hOCT3 cloned in-frame into the expression vector pMETYCgate. This vector contains the C-terminal half of ubiquitin (Cub) and the transcription factor protA-LexA-VP16 (PLV), forming the construct hOCT3-Cub-PLV. These bait yeast strains were then mated with prey-expressing yeast (THY.AP5) that carried the N-terminal half of ubiquitin (Nub) fused with a prey protein, specifically CD63, in the pNXgate33 vector, resulting in the construct CD63-Nub. As a negative control, we utilized the pNXgate33 vector alone. For positive control purposes, the pNubWTXgate vector, expressing the wild-type Nub without mutation, was employed as it reconstitutes ubiquitin without interaction. Successful mating led to the formation of diploid cells harboring two plasmids with their respective Cub and Nub fusions. The selection of diploid forms containing both plasmids was achieved through media that lacked leucine (Leu, for Cub vector selection) and tryptophan (Trp, for NubG vector selection). The assessment of interaction was subsequently conducted by observing the growth on media that also lacked adenine (Ade) and histidine (His).
Cell culture, transfection, and pull-down experimentsHEK293 cells (CRL-1573; American Type Culture Collection, Manassas, VA, USA) were cultured under standard conditions. The wild-type (WT) HEK293 cells and HEK293 cells stably expressing hOCT3 were maintained at 37 °C in Dulbecco's Modified Eagle Medium (DMEM) supplemented with 3.7 g/L NaHCO3, 1.0 g/l D-glucose, and 2.0 mM L-glutamine (Biochrom, Berlin, Germany). The culture medium was equilibrated with 8% CO2 and further supplemented with 100 U/ml of penicillin, 100 mg/l of streptomycin (both from Biochrom), 10% fetal bovine serum, and, for hOCT3 cells, 0.8 mg/ml of geneticin (PAA Laboratories, Coelbe, Germany). HEK293 WT and hOCT3-expressing cells were transiently transfected with either control vector pcDNA3.1 or CD63 in the pcDNA6.F9 vector containing a FLAG and 6xHis-Tag [26] using the Turbofect method, as recommended by the manufacturer (Fermentas, St. Leon-Rot, Germany). Relative gene expression values were determined with the 2-ΔΔCt method using GAPDH as housekeeping gene [27]. Transient transfection of CD63 increased CD63 mRNA expression (mean ± SEM Ct values of mRNA for CD63 and GAPDH before and after CD63 transient transfection, respectively: 23.2 ± 0.2 and 18.5 ± 0.1 for CD63 and 17.4 ± 0.1 and 19.1 ± 0.3 for GAPDH, N = 4–5, Suppl. Figure 1). Transient transfection of CD63 did not change the hOCT3 mRNA expression (Ct values of mRNA for hOCT3 before and after CD63 transient transfection, respectively: 21.8 ± 0.1 and 22.2 ± 0.2, N = 4–5, Suppl. Figure 1).
For pull-down experiments, HEK293 cells were transfected with pcDNA6.F9 CD63 or the control vector. Following transfection, the cells were washed with ice-cold phosphate-buffered saline (PBS) and subsequently collected in 0.5 ml of lysis buffer. This lysis buffer consisted of 1% Triton X-100 (v/v), 30% glycerin (v/v), a complete proteinase inhibitor cocktail (1 minipill per 10 ml; Roche, Basel, Switzerland), as well as the following mM concentrations: 150 NaCl, 50 Tris, 1 EDTA, 1 EGTA, and 10 NaVO3. The lysates were allowed to incubate overnight on ice at 4 °C. On the following day, the lysates were centrifuged for 1 min at 10000 g to remove insoluble cellular debris. The CD63 lysates were then immobilized on Talon Sepharose beads (Clontech Laboratories, Takara Bio, San Jose, CA, USA) and subsequently exposed to total lysates from HEK293 cells stably expressing hOCT3 for a duration of 2 h. Following this incubation, the beads were washed five times with 0.5 ml of washing buffer, which was composed of the following mM concentrations: 50 Na3PO4, 30 NaCl, and 4 imidazole. Proteins were eluted through centrifugation at 9000 g for 2 min using 50 μl of elution buffer, which contained the following mM concentrations: 50 Na3PO4, 30 NaCl, and 150 imidazole. Negative control samples were obtained by incubating lysates from hOCT3-expressing cells with beads lacking CD63. For Western blot analysis, cells were lysed as previously described and subsequently heated in sample buffer for 15 min at 60 °C. After this, the proteins were separated by SDS-PAGE and transferred onto PVDF membranes for Western blot analysis. Immunoblotting was carried out using anti-hOCT3 antibody (sc-18515, Santa Cruz Biotechnology, Santa Cruz, CA, USA) and anti-CD63 antibody (Developmental Studies Hybridoma Bank, Iowa City, IA, USA). Immunoreactive bands were visualized using horseradish peroxidase-conjugated secondary antibodies (Dako, Glostrup, Denmark) and enhanced chemiluminescence.
Isolation of basophilsPeripheral blood mononuclear cells (PBMC) were isolated from Buffy coats (German Red Cross) of six healthy volunteers with a Ficoll density gradient assay and used for experiments within 6 h. The ethics committee of the University of Münster approved all experiments (2013-286-f-S). PBMCs were isolated using a Ficoll density gradient assay and basophil isolation was carried out using the Basophil Isolation Kit II according to the instructions of the manufacturer (Miltenyi Biotech, Bergisch Gladbach, Germany). The Basophil Isolation Kit II is based on an indirect, immunomagnetic method for the isolation of basophilic granulocytes from human PBMCs. Non-basophils, i.e. T cells, NK cells, B cells, monocytes, dendritic cells, erythroid cells, platelets, neutrophil granulocytes and eosinophil granulocytes are labelled with a cocktail of biotinylated antibodies against CD3, CD4, CD7, CD14, CD15, CD16, CD36, CD45RA, HLA-DR and CD235a. Iron-loaded antibodies are then used against the biotinylated antibodies, which subsequently ensure that the labelled cells remain in the magnetic field of the magnetic cell separation (MACS)-LS column and only unlabelled cells, the basophilic granulocytes, can pass through the LS column. The purity and vitality of the isolated basophils were measured by flow cytometry as described in detail in the supplementary materials (Suppl. Figure 2 and 3). Basophils were cultured in Gibco RPMI 1640 medium (Fisher Scientific, Schwerte, Germany) containing 100 U/ml penicillin/streptomycin (Biochrom), 2 mM L-glutamine, and 10% fetal calf serum (FCS, Biochrom). Expression of mRNA for hOCT1-3, CD63, and GAPDH was investigated by PCR analysis using the primer pairs listed in Suppl. Table 1. To induce release of histamine, human basophils (200,000 cells/ml) were incubated 24 h with 20 ng/ml human IL-3 (Miltenyi Biotech), similarly to what described in [28, 29]. Incubation with IL-3 was performed in the presence or absence of 1 mM 1-methyl-4-phenylpyridinium (MPP+). MPP+ is a substrate of OCT3 [30] and a 1 mM concentration is much higher than its IC50 (146 µM) for inhibition of transport of the well-known model substrate 4-(4-(dimethylamino)styryl)-N-methylpyridinium (ASP+) by OCT3 (Suppl. Figure 4). Histamine was measured using an ELISA test according to the instructions of the manufacturer (Histamin ELISA, IBL International, Hamburg, Germany).
Further experiments were performed in the KU812 cell line (ATCC CRL-2099). The KU812 cell line was established from the peripheral blood of a patient in blast crisis of chronic myelogenous leukemia and has some characteristics of basophilic leukocytes (high-affinity IgE receptors, the FcεRI receptors, basophilic granules, histamine production) [31, 32]. KU812 cells were cultured in RPMI 1640 medium (Sigma-Aldrich, Taufkirchen, Germany) containing 100 U/ml penicillin/streptomycin (Biochrom), and 10% FCS (Biochrom) at 37 °C and 5% CO2. Expression of mRNA for hOCT1-3, hOCTN1-2, MATE1 and 2 K, CD63, CD9, and GAPDH was investigated by PCR analysis using the primer pairs listed in Suppl. Table 1. For studies on histamine release by KU812 cells, cells were first counted using Scepter™ Automated Cell Counter (EMD Millipore Life Science, Merck Millipore, Darmstadt, Germany). 500.000 cells/ml were then seeded into 24-well plates and the FcεRI-receptors on KU812 cells were sensitized by incubation with 5 µg/ml IgE (Calbiochem, Merck Millipore) for 24 h at 37 °C. After this step, cells were stimulated for 20 min with 0.2 µg/ml anti-IgE (Beckmann Coulter, Brea, CA, USA) in the presence or absence of 1 mM MPP+ or of the non-transported inhibitor corticosterone. At the end of incubation, pellet and supernatant were separated by centrifugation at 151 g for 5 min. Histamine concentration in supernatants and in cell pellets was measured using the commercial ELISA kit (IBL International). For measurement of histamine concentration in the pellet, it was subjected to hypo-osmotic lysis with 300 µl distilled water.
Immunofluorescence analysis of KU812 cells. KU812 cells stimulated or not with IgE/anti-IgE as described above or 24 h after stimulation, were centrifuged at 151 g for 5 min and afterwards incubated for 15 min on ice to stop a possible activation of the cells. Supernatants were removed and the cell pellets were plated on microscope slides. The microscope slides were dried at room temperature and each sample was circled with a delimiting DAKO fat pen. The samples on the microscope slides were first fixed for 5 min with 4% paraformaldehyde (PFA) at room temperature, PFA was washed off 3 times for 5 min each using physiological buffered saline (PBS: 137 mM NaCl, 2.7 mM KCl, 2 mM KH2PO4, and 10 mM Na2HPO4). Then cells were permeabilized by 5 min incubation with 0.2% Triton in PBS at room temperature. After this step the slides were washed again 3 times for 5 min with PBS. Unspecific binding sites were blocked by 90 min incubation at room temperature with 10% bovine serum albumin (BSA). In the meanwhile, the primary antibodies against CD63 (H5C6, Developmental Studies Hybridoma Bank) and against hOCT3 (ab124826, Abcam, Cambridge, UK) were diluted 1:25 and 1:50, respectively, in 1% BSA. The microscope slides were incubated at 4 °C overnight with the primary antibodies. The following day the slides were first washed 3 times in 1 × PBS buffer for 5 min each and then incubated in the appropriate secondary antibodies (Goat anti-Mouse IgG (H + L) Secondary Antibody, Alexa Fluor® 647 conjugate and Donkey anti-Rabbit IgG (H + L) Secondary Antibody, Alexa Fluor® 488 conjugate (both from Thermo Fisher, Waltham, Massachusetts, USA)) and 4′,6-diamidino-2-phenylindole (DAPI) for 45 min. All the secondary antibodies were diluted 1:1000 in 1% BSA. Fluorescence photographs were taken with Observer Z1 with Apotome (Carl Zeiss, Göttingen, Germany) using ZEN software. Some pictures were taken as a Z-stack with 10 levels and pictures obtained by maximum intensity Z-projection are shown.
ASP+ uptake in hOCT3-HEK293 cells. The fluorescent organic cation ASP+ was employed at a concentration of 1 μM as a substrate for OCTs, in line with established protocols in our laboratory [10]. Microfluometric detection of ASP+ uptake was achieved using a fluorescence plate reader (Infinity M200; Tecan, Crailsheim, Germany) equipped with a monochromator system (excitation at 450 nm and emission at 590 nm), following the procedures described for cells stably transfected with OCT [10]. The emission shift between ASP+ in the solution and after it traversed the cell membrane enabled the monitoring of cellular ASP+ accumulation [10]. The dynamics of organic cation transport were measured at 37 °C, focusing on the initial rate of fluorescence increase during the first approximately 100 s [10]. The slopes of fluorescence changes were subjected to linear fitting and used as the parameter for assessing ASP+ uptake. Using this technique, the inhibitory potential of histamine, MPP+, tetrapentylammonium (TPA+), and corticosterone on the initial uptake of ASP+ was assessed (Suppl. Figure 4). A Ringer-like solution (145 mM NaCl, 1.6 mM K2HPO4, 0.4 mM KH2PO4, 5 mM glucose, 1 mM MgCl2, 1.3 mM Calcium D-gluconate) with pH 7.4 was used as uptake buffer. Changes of ASP+ uptake rate were measured in hOCT3-HEK293 cells and after transient transfection of an empty vector (EV, pcDNA6.F9) or of CD63 cloned into pcDNA6.F9 [26] via MluI and NotI sites.
Mice. C57BL/6 mice (obtained from the Animal facilities of the Medical Faculty of Münster University) designated as wild-type (WT), OCT3−/−, and CD63−/− mice, all bred on a C57BL/6 background, aged up to 1 year and weighing between 25 and 30 g, were utilized in this study. The OCT3−/− mice were generously provided by Dr. Gautron [33], while the CD63−/− mice were acquired through Dr. Saftig [17]. The mouse colonies underwent rejuvenation every 10 generations to ensure the preservation of their genetic fidelity. All experiments conducted in this study were ethically approved by the North Rhine Westphalia State Environment Agency (LANUV, approval 81-02.04.2018.A387) and adhered strictly to national guidelines concerning animal welfare and protection. Focussing on OCT3−/− mice, since OCT3 is involved in the transport of important neurotransmitters and their metabolites, a metabolomic analysis was performed to compare the serum metabolome of male and female WT and OCT3−/− animals. Moreover, the phenotypic consequences of OCT3 genetic deletion were investigated by comparing the complete blood count and the differential of white blood cell in male WT and OCT3−/−mice.
Isolation of bone marrow cells. The mice were anesthetized using isoflurane and euthanized by cervical dislocation. Subsequently, tubular bones were collected in a 50 ml centrifuge tube and kept on ice during the process. A one-ml syringe filled with RPMI medium was introduced into the initial region of the bone marrow canal, and gentle pressure was applied to collect bone marrow cells (BMCs) at the lower end of the tubular bone. Subsequently, the collected solution was resuspended using a glass pipette until any clumps dissolved, resulting in a uniformly cloudy solution. The suspension was then passed through a filter two times and then subjected to centrifugation at 138 × g for 10 min. Following centrifugation, the supernatant was carefully removed, and the cellular residue was resuspended in 5–8 ml of medium. This centrifugation and resuspension process was repeated a total of three times. For the final resuspension, only 3 ml of RPMI medium was added. The entire mixture was then transferred through a filter into a new centrifuge tube. Following this, the cells were counted and subsequently diluted with RPMI-1640 medium to achieve a cell count of 250,000 cells/ml. To initiate cell culture, 1 ml of the cell suspension was pipetted into each well of a 12-well plate.
For the experiment, the BMCs were divided into two groups: one to be stimulated and the other to serve as a control. The BMCs were stimulated by 24 h incubation with 1 ng/ml recombinant murine IL-3 (Peprotech, Thermo Fisher Scientific, Waltham, MA, USA) and further addition after 24 h incubation of 5 µg/ml monoclonal anti-dinitrophenyl mouse IgE isotype (Sigma). After further 24 h incubation, stimulation was completed by 20 min incubation with 2 µg/ml dinitrophenylated BSA (DNP-BSA) (Molecular Probes, Thermo Fisher Scientific). The control group received the same volumes of sterile PBS at the same time intervals. Subsequently, the contents of each well were transferred to reaction tubes, which were centrifuged at 63 × g for 5 min at 4 °C. The resulting supernatants were carefully pipetted into new reaction tubes, while the cell pellets were resuspended in 250 µl of distilled water to induce a hypoosmotic cell lysis. After a 15-min incubation, the reaction vessels containing the cell pellets were placed in an ultrasonic bath for an additional 15 min to ensure complete cell lysis. Finally, the supernatants and cell lysates were frozen at −20 °C for further use. Supernatants and pellets of BMCs from WT and OCT3−/− mice ± IL-3/IgE/anti-IgE incubation were analyzed by an untargeted metabolomic assay (s. below).
Surface biotinylation. To quantitatively assess OCT3 surface expression, surface biotinylation was performed on BMCs derived from WT and CD63⁻/⁻ mice. Cells were stimulated with IL-3, IgE, and anti-IgE antibodies to induce basophil maturation and histamine release. In selected experiments, stimulated cells were further cultured for an additional 24 h in standard medium (Minimum essential medium α, with 10% fetal bovine serum, 2% Na-Pyruvate, and 1% penicillin/streptomycin, Thermo Fisher, Rockford, IL, USA). Non-stimulated BMCs maintained in standard medium served as controls. After incubation, surface proteins were labeled with biotin, quenched, sonicated, lysed, and clarified by centrifugation, following the protocol provided with the Pierce Cell Surface Protein Isolation Kit (Thermo Scientific, Rockford, IL, USA). Biotinylated proteins were isolated by incubating lysates with immobilized NeutrAvidin gel, ensuring equal protein loading across samples. The gel was washed and incubated for 1 h with SDS-PAGE sample buffer containing 50 mM dithiothreitol. Eluates, along with whole-cell lysates, were analyzed for OCT3 expression via immunoblotting. Equal amounts of protein were loaded onto the gels, and signal intensities were quantified as percentages relative to the corresponding control samples (whole lysate or biotinylated fractions), which were set at 100%.
Sequencing/RNAseq Analysis Methods. To elucidate which pathways are regulated by stimulation of degranulation in BMCs from WT and OCT3−/− mice, a RNAseq analysis was performed. BMC-RNA was isolated by GenElute™ Mammalian Total RNA Miniprep Kit (Merck) with additional DNase I (Merck) digestion. For measurements, only RNA with integrity number equal or higher than 7 was used. The library preparation of the total RNA was performed with NEBNext Ultra™ II Directional RNA Library Prep Kit for Illumina and NEBNext Poly(A) mRNA Magnetic Isolation Module. Single-end read sequencing was performed using a NextSeq 2000 System with a read length of 72 bp. The samples were demultiplexed with the Illumina DRAGEN Bio-IT Platform. Quality control was done using FastQC version 0.12.1 [34], Trimmomatic version 0.39, parameter: trimmomatic-0.39.jar SE -phred33 $input $output1 ILLUMINACLIP: NEB-SE.fa:2:30:10 LEADING:3 TRAILING:3 MINLEN:15 [35] was used for adapter and low quality end trimming as well as for general quality trimming utilizing a sliding window of 4 bp with a minimal average base quality of 15. Reads below a minimum read length of 15 bp were discarded. The resulting reads were aligned to the Ensembl GRCm39 reference genome, using HISAT2 version 2.2.1. release 6/8/2017 [36] (parameter: hisat2-q-rna-strandness RF -S $ -x $ -U $ -p $) and sorted using SAMtools version 1.16.1. parameter: samtools view -bS $ > $ [37]. Gene based read counting was done using HTSeq version 2.0.3 [38] with the Ensembl annotation version 111. Differential expression analysis was performed using the R package DESeq2 version 1.40.1 [39]. The R package org.Mm.eg.db version 3.17.0 [40] was used to convert Ensembl IDs to mgi symbols. Plots were created using the R packages gplots version 3.1.3 [41], ggplot2 version 3.4.2 [42] and pcaExplorer version 2.26.1 [43].
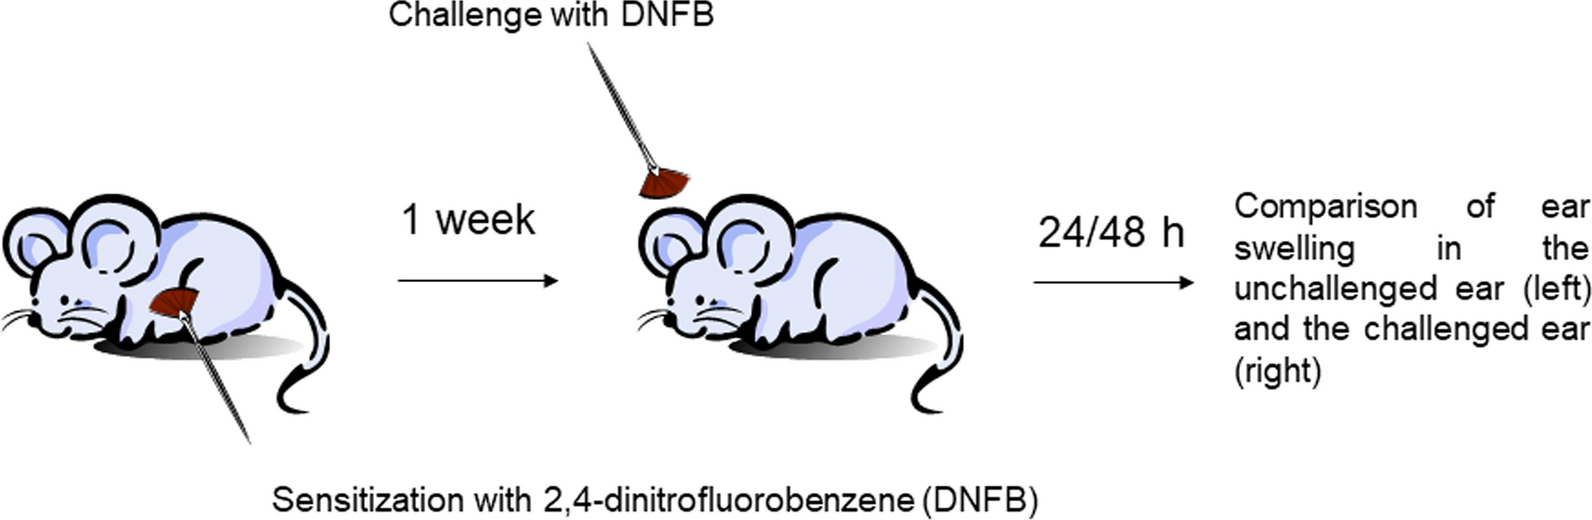
Contact-allergy model. Histamine is considered to participate in the formation of ear edema in the contact-allergy model with 2,4-dinitrofluorobenzene (DNFB), which is IgE-dependent and involves activation of both basophils and mast cells [44, 45]. To investigate whether OCT3 plays a role in this process, a DNFB contact allergy has been induced in WT, CD63−/−, and OCT3−/− mice. Mice were first sensitized on the shaved belly with 100 μl 0.4% (w/v) DNFB in acetone/olive oil (4:1) and challenged 6 days later on the ear with 20 μl 0.4% DNFB (10 μl each side of the ear). Ear swelling has been compared to what observed 24 and 48 h after challenge with DNFB in the contralateral ear treated only with solvent (Fig. 1). At the end of the experiments, ears and blood were collected for histochemical analysis and determination of serum histamine, respectively.
Fig. 1
Schematic representation of contact allergy experiments with DNFB as performed in WT, CD63−/−, and OCT3−/− mice
Toluidine blue staining. Toluidine blue is a very common tissue staining for granulocytes, which especially visualizes their granules due to the presence of heparin and histamine [46, 47]. The staining was performed in mouse ear tissue cut under cryostatic conditions. Frozen (−20 °C) microscope slides were dried at room temperature for 10 min. Afterwards, they were placed in the glass basin with 1 × Toluidine Blue for 1 min. The microscope slides were then dipped three times into distilled water, four times in 70% ethanol and three times in 96% ethanol. To dehydrate the slides, they were placed for 1 min in 96% ethanol, 1 min in 100% ethanol and incubated for 10 min in Xylol before being prepared for microscopy. Microscopy analysis was performed using a Leica DM2500 microscope (Leica, Wetzlar, Germany) and the Pannoramic Viewer software (3D Histech, Budapest, Hungary).
PCR-analysis. For PCR analysis, total RNAs were isolated using the Qiagen RNeasy Minikit (Qiagen, Gilden, Germany) and reverse transcription was performed using the Superscript II system (Invitrogen, Carlsbad, CA, United States), both according to the manufacturer’s recommendations. Standard PCR was performed using specific primer pairs as listed in Suppl. Table 1. The PCR products were separated using agarose gel electrophoresis. The bands were sequenced for confirmation of amplification product identity.
Untargeted metabolome analysisAnalysis of mouse serum: serum samples from male and female WT and OCT3−/− mice in age of 1 year were isolated and immediately snap-frozen using liquid nitrogen. 100 µl of each serum sample were transferred into a 1.5 ml reaction tube, and an additional 50 µl of each sample were aliquoted in a screw cap tube to prepare pooled quality control samples. From this pooled quality control samples, three 100 µl aliquots were treated equivalent to the samples as follows. To every sample, 400 µl 80% methanol were added and mixed thoroughly. After a centrifugation step of 11000 × g for 10 min at 4 °C, supernatants of each sample were divided in two parts, each 200 µl, whereby one aliquot was used for hydrophilic interaction liquid chromatography (HILIC) for the detection of polar compounds and the other one for the reverse phased chromatography (RP) for the detection of non-polar compounds. All samples were dried using a vacuum concentrator (Labconco Corporation, Kansas City, MO, USA) at -4 °C and kept at −80 °C until analysis. Before analysis, the dried sample were reconstituted in 50 µl eluent for analysis.
Analysis of BMCs. Preparation of supernatants and pellets of BMCs: isolated BMCs from male (male were used to avoid variations due to oestrus cyclus phase) WT and OCT3−/− mice in age of 1 year were used. BMCS were treated as described above and were technical replicates of pooled BMCs from at least 3 different mice/genotype and treatment. All samples were centrifuged by 150 × g for 5 min and the supernatants were collected. Cell pellets were resuspended in Dulbecco’s PBS and centrifuged again. Supernatants and pellets were snap-frozen using liquid nitrogen.
For metabolomic measurement of supernatants, 200 µl of each supernatant were pooled and split into three 500 µl aliquots for quality control. 500 µl of all samples and of the quality controls were centrifuged by 11000 × g for 10 min at 4 °C. Afterwards, 600 µl of solvent mixture (methanol/chloroform 1:1) was added. All mixtures were vortexed for 1 min and centrifuged again for 15 min using the same conditions. After this, 200 µl H2O was added and the mixture was vortexed for 1 min. After centrifugation, organic and aqueous phases were transferred individually into HPLC vials, whereby the aqueous phase was used for HILIC, and the organic phase for RP analysis. All samples were dried with a vacuum concentrator at −4 °C and kept at −80 °C until analysis. For analysis, all samples were reconstituted in 200 µl of the respective eluent (HILIC or RP).
For metabolomic measurement of cell lysates, 1 ml of 80% methanol was added to each pellet. After thorough vortexing, every sample was centrifuged at 11000 × g for 5 min at 4 °C. From each cell lysate 350 µl supernatant were transferred into two separate vials (one for HILIC and one for RP). For quality control, 230 µl of each sample were pooled and three aliquots of 350 µl taken from the mixture. All samples were dried with a vacuum concentrator at −4 °C and kept at −80 °C until analysis. Prior to the analysis, every sample was reconstituted in 200 µl eluent for HILIC and RP measurements.
HPLC and mass spectrometry: Chromatographic separation was achieved using an Agilent 1260 HPLC system equipped with an Acquity UPLC BEH C18, 1.7 µm, 2.1 × 100 mm column for RP mode and an Acquity UPLC BEH Amide, 1.7 µm, 2.1 × 100 mm column for HILIC mode. For both columns, associated guard columns were used to prolong column lifetime. During analysis, the column temperature was held at 40 °C and the flow rate was 250 µl/min. For both modi, a gradient elution program was used. For RP, it consisted of mobile phase A: (0.1% (v/v) formic acid in H2O) and mobile phase B: (0.1% (v/v) formic acid in methanol). The gradient was as follows: 0–20 min, 0.5–98% B; 20–22.5 min, 98% B, followed by a column re-calibration step using 0.5% B until 30 min. For HILIC, mobile phase A (10 mM ammonium formate in H2O containing 0.1% (v/v) formic acid) and mobile phase B (10 mM ammonium formate in acetonitrile/H2O (95:5) containing 0.1% (v/v) formic acid) was used. The gradient was applied with the setting: 0–2 min 98% B, 2–14 min from 98 to 30% B, 14–17.5 min 30% B, followed by a column re-calibration step using 98% B until 30 min.
The Q Exactive Plus mass spectrometer was operated using Xcalibur™ 2.13 software (Thermo Fisher Scientific) and equipped with a HESI source (Thermo Fisher Scientific). The source temperature was 320 °C. Each sample was analyzed in HILIC and RP mode and both in negative and positive polarization. For positive polarization, capillary voltage was set to 3500 V, whereas for negative polarization it was set to −3000 V. For both polarizations, sheath and aux gas were set to 30 and 20 respectively. The full scan range was 80–800 atomic mass units with a resolution of 70000 with the automatic gain control (AGC) target set at 1*106 and the maximum injection time set to auto mode. The MS2 acquisition was data dependent with a resolution of 35000 with an AGC target of 5*104 and the maximum injection time also set to auto, whereby the ten most abundant ions were fragmented.
Data processing: The acquired MS data sets were processed with Compound Discoverer 3.3 (Thermo Fisher Scientific). Metabolites were annotated using mzcloud and ChemSpider databases. All annotated metabolites were categorized in annotation levels (AL) 1–4. AL 1 defines metabolites identified using reference standards. AL 2 was used for annotated metabolites with MS2 and mzcloud best match > 80. AL 3 was used for annotated metabolites with MS2 and mzcloud best match 60–80. The lowest level, AL 4, was attributed to metabolites with either MS2 and mzcloud best match below 60 or only MS1. After preprocessing, metabolite lists were further filtered by excluding metabolites without or with divergent annotation and retention within the void volume. In case of supernatants and cell lysates, peak areas were normalized using cell count. Peak lists of the four modes were finally merged, whereby for metabolites detected in multiple modi, the entry with the highest abundancy was used. Pathway analyses were performed with metabolites with AL 2 and 3 by MetaboAnalyst 6.0 [48].
Comments (0)