
Remember me


The SP-A1 showed statistically different at different time points (P = 0.002). SP-A1 increased significantly after the operation (Fig. 2A). Compared with the preoperative value (36.17 ± 4.70), SP-A1 at 1 month (56.28 ± 7.30, P = 0.011), 3 months (52.21 ± 5.38, P = 0.008), and 6 months (53.47 ± 3.55, P = 0.008) were all significantly increased. No significant difference was found in SP-A1 during the postoperative follow-ups (P = 0.459). There was no statistical difference in DAR-2 mm during preoperative and 1, 3, and 6 postoperative time points (P = 0.651) (Fig. 2B).
Fig. 2
A-E Changes in corneal biomechanics before and after the surgery; F–H Changes in keratometry, anterior central corneal elevation and posterior central corneal elevation before and after the surgery; I Changes in central corneal thickness before and after the surgery; J Aberrations before and after the surgery
The ARTh showed statistically different at different time points (P = 0.003). ARTh increased significantly after the operation (Fig. 2C). Compared with the preoperative value (129.19 ± 8.63), ARTh at 1 month (310.34 ± 54.43, P = 0.008), 3 months (324.65 ± 56.96, P = 0.008), and 6 months (320.61 ± 54.47, P = 0.015) were all significantly increased. No significant difference was found in ARTh during the postoperative follow-ups (P = 0.717). The integrated radius showed statistically different at different time points (P = 0.003). The integrated radius decreased significantly after the operation (Fig. 2D). Compared with the preoperative value (17.18 ± 3.26), the integrated radius at 1 month (14.68 ± 1.67, P = 0.015), 3 months (14.71 ± 1.67, P = 0.008), and 6 months (13.36 ± 2.64, P = 0.015) were all significantly decreased. No significant difference was found in the integrated radius during the postoperative follow-ups (P = 0.121). There was no statistical difference in A1 velocity during preoperative and 1, 3, and 6 postoperative time points (P = 0.397) (Fig. 2E).
Visual outcomes after Combined FILI and CXLTable 2 presents the visual changes from preoperatively to 6 months postoperatively. Some patients were unable to obtain preoperative and postoperative optometry results due to irregular corneal morphology, resulting in"Error"or"Over"displayed on the optometer, which is showed “/” in Table 2. The postoperative LogMAR UDVA (1.04 ± 0.21) did not exhibit statistical significance (P = 0.268) compared to the preoperative LogMAR UDVA (1.13 ± 0.35), indicating that the degree of myopia induced by stromal lenses did not lead to significant overall vision loss. Six eyes from five patients wore RGPs six months after surgery, and the average LogMAR BCVA reached 0.08 ± 0.07.
Some patients refused to use RGPs or cannot tolerate RGPs during the trial wearing, and ultimately, these patients did not get visual improvement.
Keratometry and corneal elevationThe Km showed statistically different at different time points (P = 0.016). The mean central anterior keratometry readings (Km) increased from the preoperative value of 56.99 ± 2.17D to 59.61 ± 2.12D at 1 month postoperatively, and then declined slightly in the later period, which were 59.07D at the 3rd month and 58.31D at the 6 th month. However, the paired comparison between preoperative Km and 6-month-postoperative Km showed no statistical significance (P = 0.139) (Fig. 2F). The anterior central corneal elevation showed statistically different at different time points (P < 0.001). The anterior central corneal elevation significantly increased at 1 month postoperatively (83.89 ± 7.20 μm) compared to before surgery (54.56 ± 55.25 μm) (P = 0.008). It then decreased from 1 to 6 months, reaching 74.22 ± 7.77 μm at 6 months postoperatively, which was statistically lower than the elevation at 1 month postoperatively (P = 0.012), but still higher than the preoperative elevation (P = 0.008) (Fig. 2G). The posterior central corneal elevation appeared to decrease slightly after surgery compared to before operation, but there was no statistical difference during preoperative and 1,3,6 postoperative time points (P = 0.500) (Fig. 2H).
Central corneal thickness(CCT)The CCT showed statistically different at different time points (P < 0.001). The thinnest point of corneal thickness was measured by AS-OCT, revealing a significant increase in postoperative thickness at 1 month (487.00 ± 8.23 μm, P = 0.008), 3 months (485.56 ± 8.27 μm, P = 0.008), and 6 months (482.67 ± 12.08 μm, P = 0.008) compared to preoperative measurements (392.67 ± 6.46 μm). However, no significant difference was observed in the thinnest point of corneal thickness during the postoperative follow-ups (P = 0.236). The thickness variation of the thinnest point of the cornea is depicted in Fig. 2I.
AberrationsThe mean root mean square (RMS) values of higher-order aberrations were 4.77 ± 0.30 preoperatively, and 4.39 ± 0.38, 4.21 ± 0.42, and 4.06 ± 0.36 at the 1, 3 and 6 months after surgery, respectively. Higher-order aberrations appeared to decrease after the operation, but the overall comparison was not statistically significant (P = 0.053). The spherical aberrations showed statistically different at different time points (P = 0.026), and the mean RMS values of the spherical aberrations were −2.45 ± 0.41 preoperatively, and −2.21 ± 0.42, −2.15 ± 0.48, and −1.82 ± 0.39 at the 1, 3 and 6 months after surgery, respectively. The absolute value of spherical aberration in the 6 th month decreased than that before the surgery, which was statistically significant(P = 0.028). For coma aberrations in 90°, the mean RMS values were −2.10 ± 0.82 preoperatively, and −1.87 ± 0.73, −1.86 ± 0.65, and −1.88 ± 0.58 at the 1, 3 and 6 months after surgery, respectively(P = 0.145). For coma aberrations in 0°, the mean RMS values were −0.140 ± 0.49 preoperatively, and 0.004 ± 0.46, −0.092 ± 0.46, and −0.030 ± 0.44 at the 1, 3 and 6 months after surgery, respectively(P = 0.706). The mean RMS values of coma aberrations in both 90° and 0° appeared to decrease after the operation, but no significant difference was observed in the comparison during the preoperative and postoperative follow-up, which may be attributed to the small sample size (Fig. 2J).
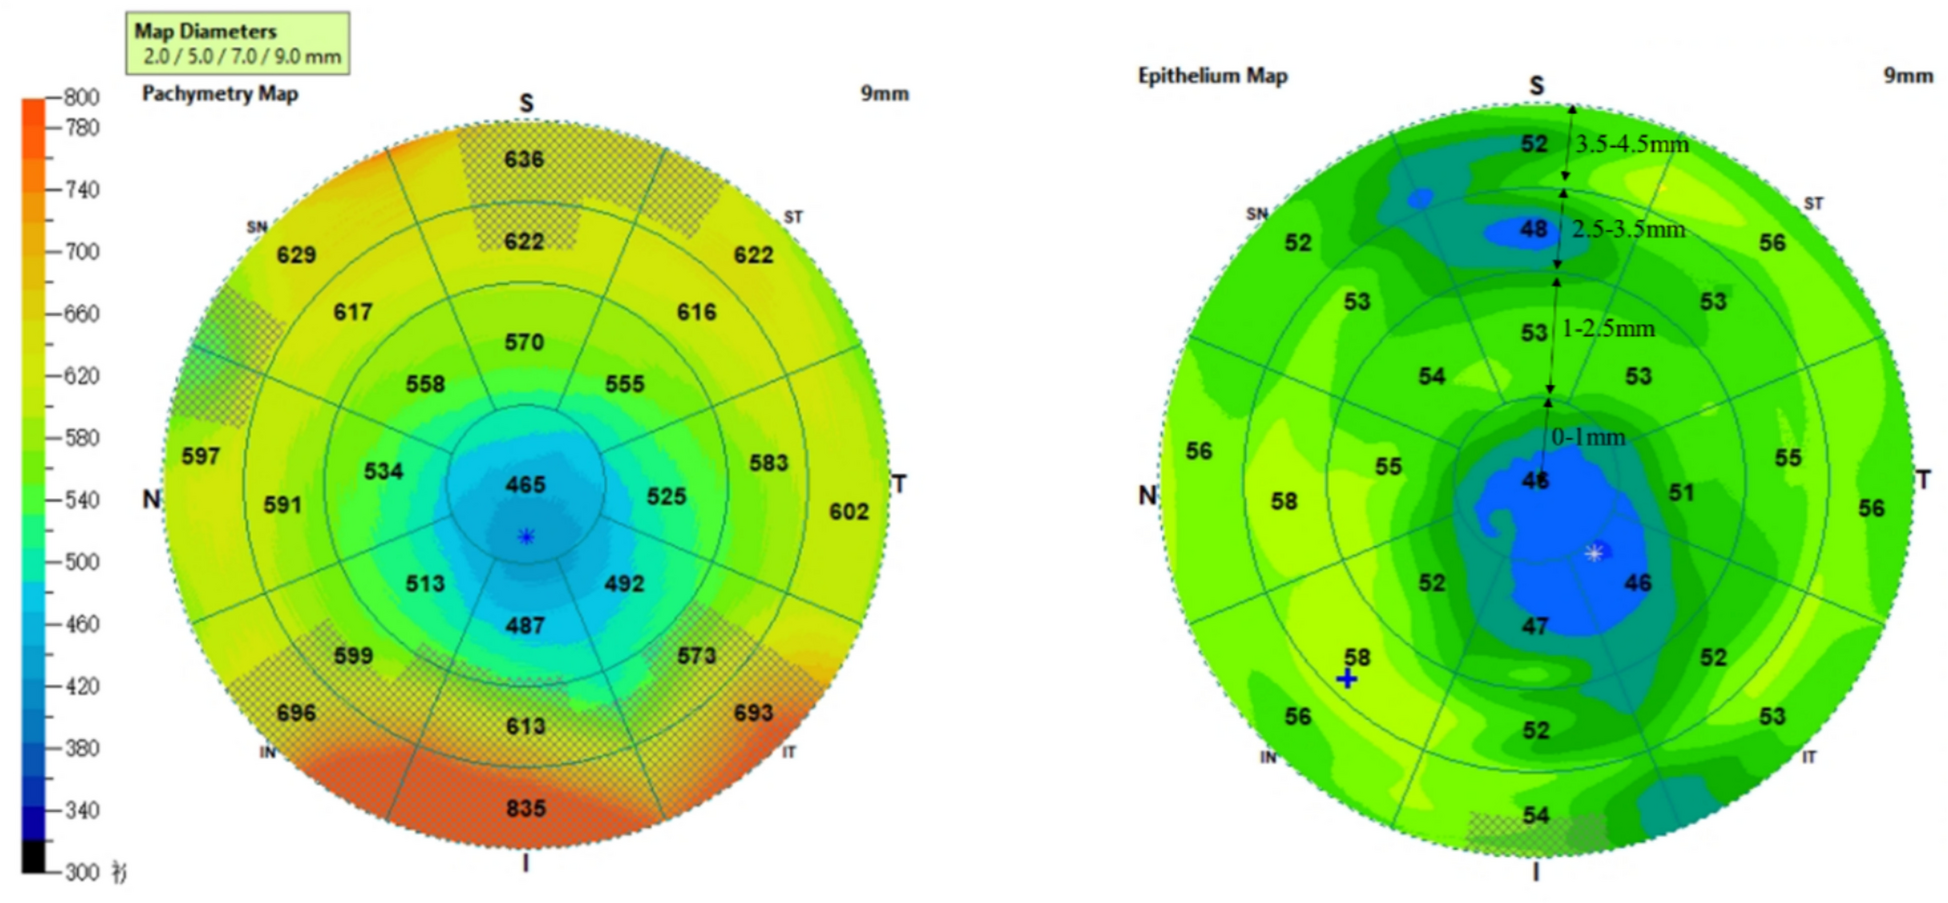
Corneal epithelial thickness(CET) remodeling after Combined FILI and CXLWe conducted a comparative analysis of CET preoperatively and at 6 th month postoperatively (refer to Table 4). In the central 0–1 mm zone of the cornea, there was a notable increase in CET from 44.78 ± 4.06 μm preoperatively to 49.78 ± 4.09 μm at the 6 th month postoperatively, demonstrating statistical significance (P = 0.004). Conversely, within the paracentral 1–2.5 mm and 2.5–3.5 mm regions, no significant disparities were observed between the preoperative and six-month postoperative periods. However, in the peripheral 3.5–4.5 mm zone of the cornea, the CET measurements for the IN SN, N, IN, T, and ST regions at 6 months postoperatively exhibited increased thickness compared to preoperative values, showing statistical significance (as indicated in bold in Table 4). Subsequently, we generated a simulated CET map model using AS-OCT, illustrating the CET variations across the four time points through distinct colour gradations (refer to Fig. 3). Upon juxtaposing Table 4 with Fig. 3, it became evident that the CET profile transitioned from notable central thinning and paracentral thickening, akin to a doughnut-like shape before surgery, to significant thickening within the central 0–1 mm and peripheral 3.5–4.5 mm zones postoperatively. Consequently, there was a more uniform distribution of CET across the cornea.
Table 4 CET in regions with different radii from the corneal center in preoperative and postoperative keratoconus patientFig. 3
The average CET changes in regions with different radii from the corneal center indicated by different color levels preoperatively and 1,3,6 months postoperatively, measured by AS-OCT
The belin ABCD keratoconus staging before and 6 months after surgeryAs showed in Table 1, there was no significant change in stage A and B compared to pre-operation, Stage C is significantly improved. That means the anterior and posterior radius of curvature from a 3.0 mm optical zone centered on the thinnest point didn’t improve through the combined surgery, but the minimal corneal thickness got a significant thickening. The D parameter of the ABCD Belin’s classification derives from the best corrected spectacle visual acuity-CDVA in this research, while BCVA means corrected visual acuity with RGPs. We are sorry that we missed some postoperative spectacle plane CDVA tests.
Visual outcomes of the donors followed SMILEAmong the 8 donors, 2 donors did not come to the hospital for a follow-up visit. Through a phone call, it was learned that they had the follow-up visit at a local hospital in their hometown and they have no discomfort. As to the other 6 donors(7 eyes), Fig. 4A shows the cumulative percentage of UDVA in the 1 month follow-up visit. A total of 7 eyes had postoperative UDVA equal to or better than preoperative CDVA. Figure 4B shows the change in the snellen lines of CDVA, a total of 7 eyes had postoperative UDVA equal to or better than preoperative CDVA. Figure 4C and D show that the patients have achieved a good refractive state after surgery.
Fig. 4
Visual analyses of the donors followed SMILE. A Postoperative uncorrected distance visual acuity (UDVA). B Comparison of uncorrected to preoperative corrected distance visual acuity. C Accuracy of spherical equivalent refraction. D Amplitude of refractive cylinder
Comments (0)