Chemicals
Lovastatin (analytical standard) were obtained Sigma-Aldrich (St. Louis, MO, USA) and Citrinin (analytical standard) was purchased from Fujifilm Wako Pure Chemical Corporation (Osaka, Japan). A methanol solution of citrinin (10 mg/mL) was prepared as a stock and diluted with methyl alcohol to prepare working standards with required concentrations. All stock solutions were stored at – 20 ℃ prior to use. For HPLC analysis, solvents with a purity of at least 99.9% HPLC grade were used, while solvents for proximate analysis were of Guaranteed Reagent grade or higher.
Test material
The RYR used in this experiment was prepared by fermenting white rice (Oryza sativa) with a 5% (v/w) inoculum of Monascus pilosus. For the control group, white rice sourced from Ganghwa-gun, which was identical to the rice used for RYR production, was utilized. The products were purchased from a local market in Korea. All samples were stored at – 80 ℃ immediately after purchase, freeze-dried, and subsequently analysed for monacolin K and citrinin content using HPLC.
Test diet
Test diets were prepared by replacing the corn starch of the AIN 93G with RYR and/or white rice. For the control diet, the whole corn starch of AIN 93G was replaced by white rice. The diet was replaced by a 1:1 mixture of RYR and white rice for the low-dose group and by RYR alone for the high-dose group. Therefore, the rats were fed with diets containing 0%, 20%, and 40% RYR, respectively. The compositions of the diets are shown in Table 1. All diets stored at 4 ℃ prior to use. And dietary nutrition, stability, and citrinin concentration of diet were confirmed analytically, as described later.
Table 1 The composition of test feedsProximate analysis
The moisture and ash contents (gravimetric) were determined based on methods outlined by the Association of Official Agricultural Chemists (AOAC) [24]. The auto-Kjeldahl method was used to determine the crude protein content. The crude lipid was extracted with dimethyl ether using the Soxhlet method [24]. The crude fiber was determined by AOAC 978.10 [24]. The total carbohydrate content (%) was obtained by subtracting all other components from 100% (calculated as 100-(moisture + ash + crude protein + crude lipid + crude fiber)).
Stability
Monacolin K, the marker compound of RYR, was quantified to verify the stability of the RYR contained in the feed [5]. The feed was stored at 4 ℃ throughout the experiment. The analytical samples were taken at the start and end of the feeding experiment. The experimental feed (0.5 g) was extracted with 10 ml of 75% ethanol using a sonicator (Ultrasonicator, Wisd, Gangwon, Korea) for 1 h at 60 ℃. The extract was centrifuged at 3000 rpm for 10 min at 25 ℃. The supernatant was filtered with a 0.2 μm pore size filter into a 1 ml vial, and monacolin K was quantified by HPLC coupled with a UV–Vis Detector (Ultimate 3000, Thermo Fisher Scientific, Waltham, MA, USA). The analytical column was a C18 HPLC column (VDSpher OptiAqua C18, 5 μm, 4.6 × 250 mm, VDS optilab, Berlin, Germany). The elution conditions involved a gradient of binary mobile phases: solvent A (phosphoric acid/water, 2/998, v/v) and B (acetonitrile). The gradient elution program was as follows: 0–30 min: solvent A from 65–35%, solvent B from 35–65%; 30–31 min: solvent A from 35–0%, solvent B from 65–100%, then holding for 14 min; 45–46 min: solvent A from 0–65%, solvent B from 100–35%, then holding until 60 min. The mobile-phase flow rate was 1.00 mL/min, and the oven temperature was 40 ℃. The chromatogram was detected by UV at 237 nm.
Citrinin estimation in diet
The test feed (2.5 g) was extracted with 25 ml of 70% ethanol by shaking it with a rotating shaker (SI-600R, Lab Companion, Jeiotech, Seoul, Korea) at 200 rpm for 1 h at 40 ℃. The extract was centrifuged with 3000 rpm for 5 min at 25 ℃. The supernatant was collected and concentrated under reduced pressure (Multivapor P-12, Buchi, Flawil, Switzerland) at 50 ℃. The concentrated sample was dissolved in 1 ml of methanol. Subsequently, the solution was filtered with a 0.2 μm pore size filter into a 1 ml vial, and citrinin was analyzed by high performance liquid chromatography (HPLC; Ultimate 3000, Thermo Fisher Scientific, Waltham, MA, USA) coupled with a fluorescence detector (FLD; Ultimate 3000, Thermo Fisher Scientific, Waltham, MA, USA). The analytical column was a C18 HPLC column (VDSpher OptiAqua C18, 5 μm, 4.6 × 250 mm, VDS optilab, Berlin, Germany). The elution conditions involved a gradient of binary mobile phases: solvent A (phosphoric acid/water, pH was adjusted to 2.25) and B (acetonitrile). The gradient elution program was as follows: 0–9.45 min: solvent A from 50–20%, solvent B from 50–80%; 9.45–9.50 min: solvent A from 20–0%, solvent B from 80–100%, then holding for 10.5 min; 20–20.1 min: solvent A from 0–50%, solvent B from 100–50%, then holding until 30 min. The mobile-phase flow rate was 1.00 mL/min, and the oven temperature was 20 ℃. The excitation and emission wavelength were set at 331 nm and 500 nm, respectively.
Animals and maintenance
Male Sprague–Dawley rats (five weeks old) were obtained from Dooyeol Biotech Co., Ltd. (Seoul, Korea). The experiment was conducted in accordance with ethical guidelines approved by the Institutional Animal Care and Use Committee (IACUC) of Seoul National University (approval number SNU-200721–3). The animals were housed in a room maintained at 22 ± 2 ºC with a relative humidity of 60–70% and exposed to a light and dark cycle of 12 h duration. During the experimental periods, drinking water and feed were provided ad libitum.
Sub-chronic toxicity study
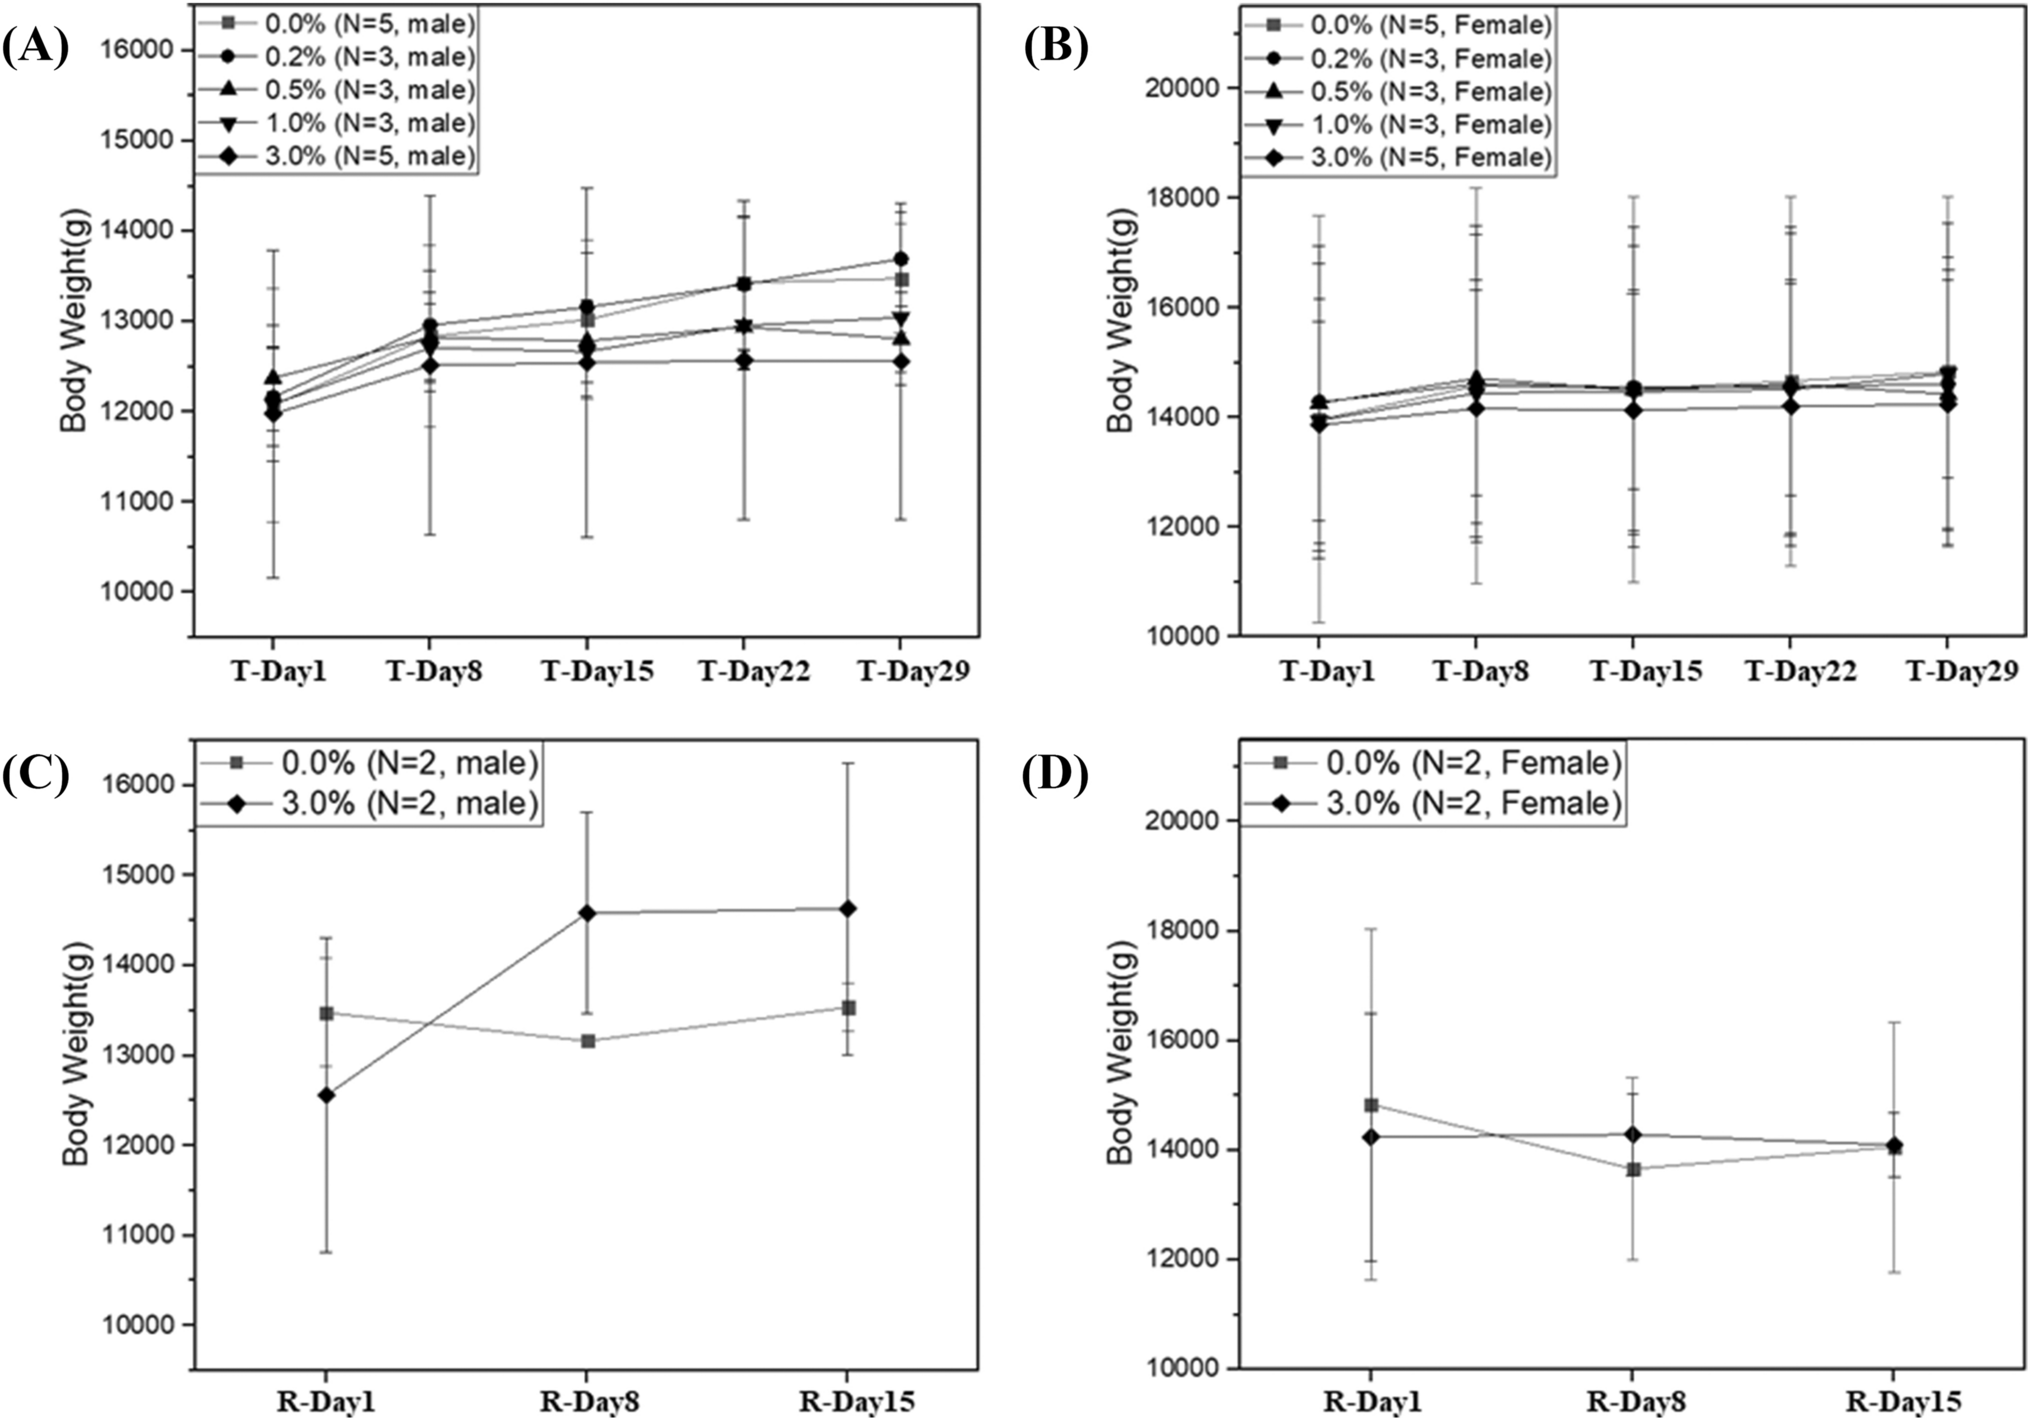
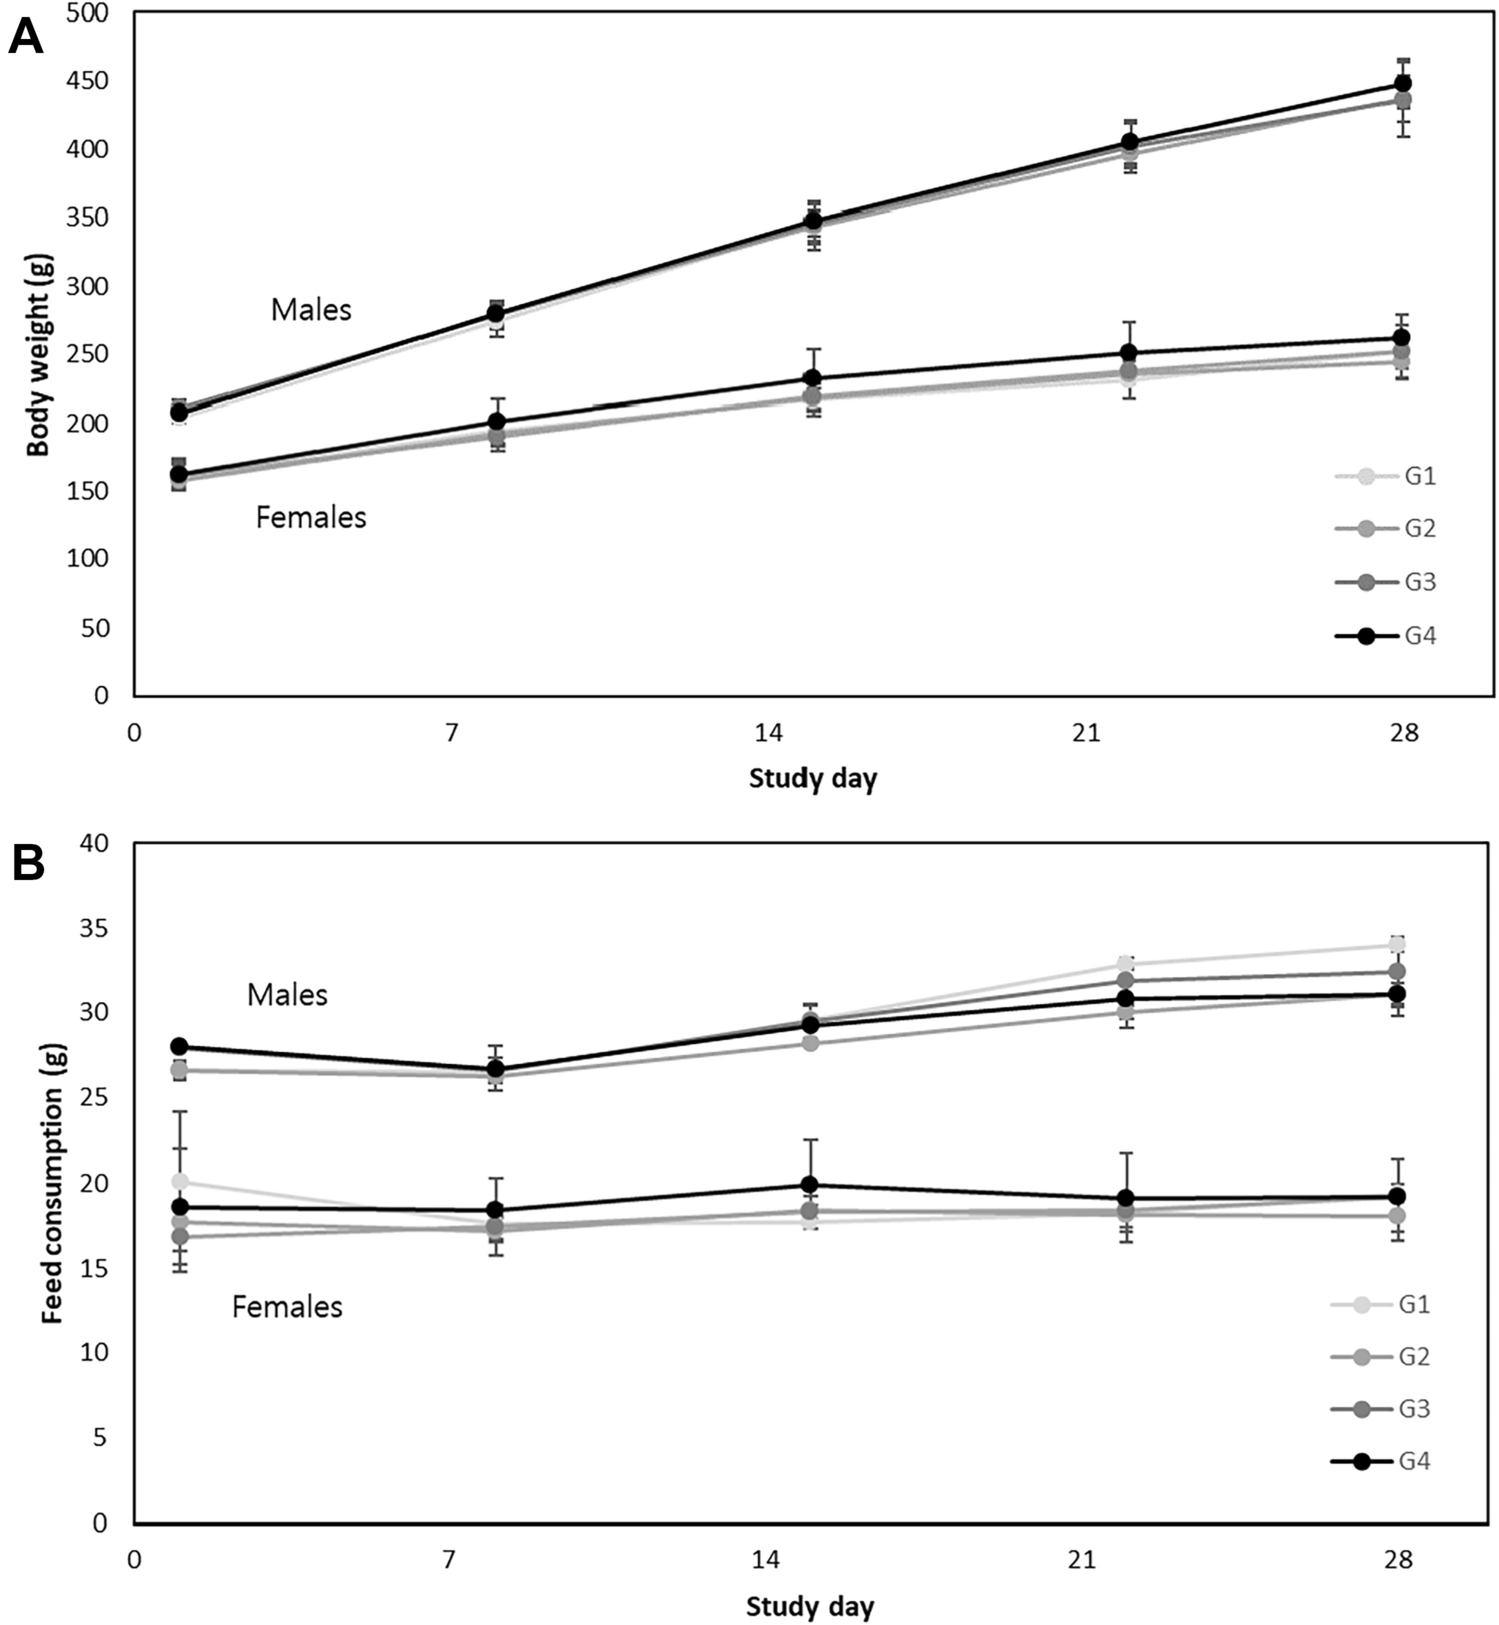
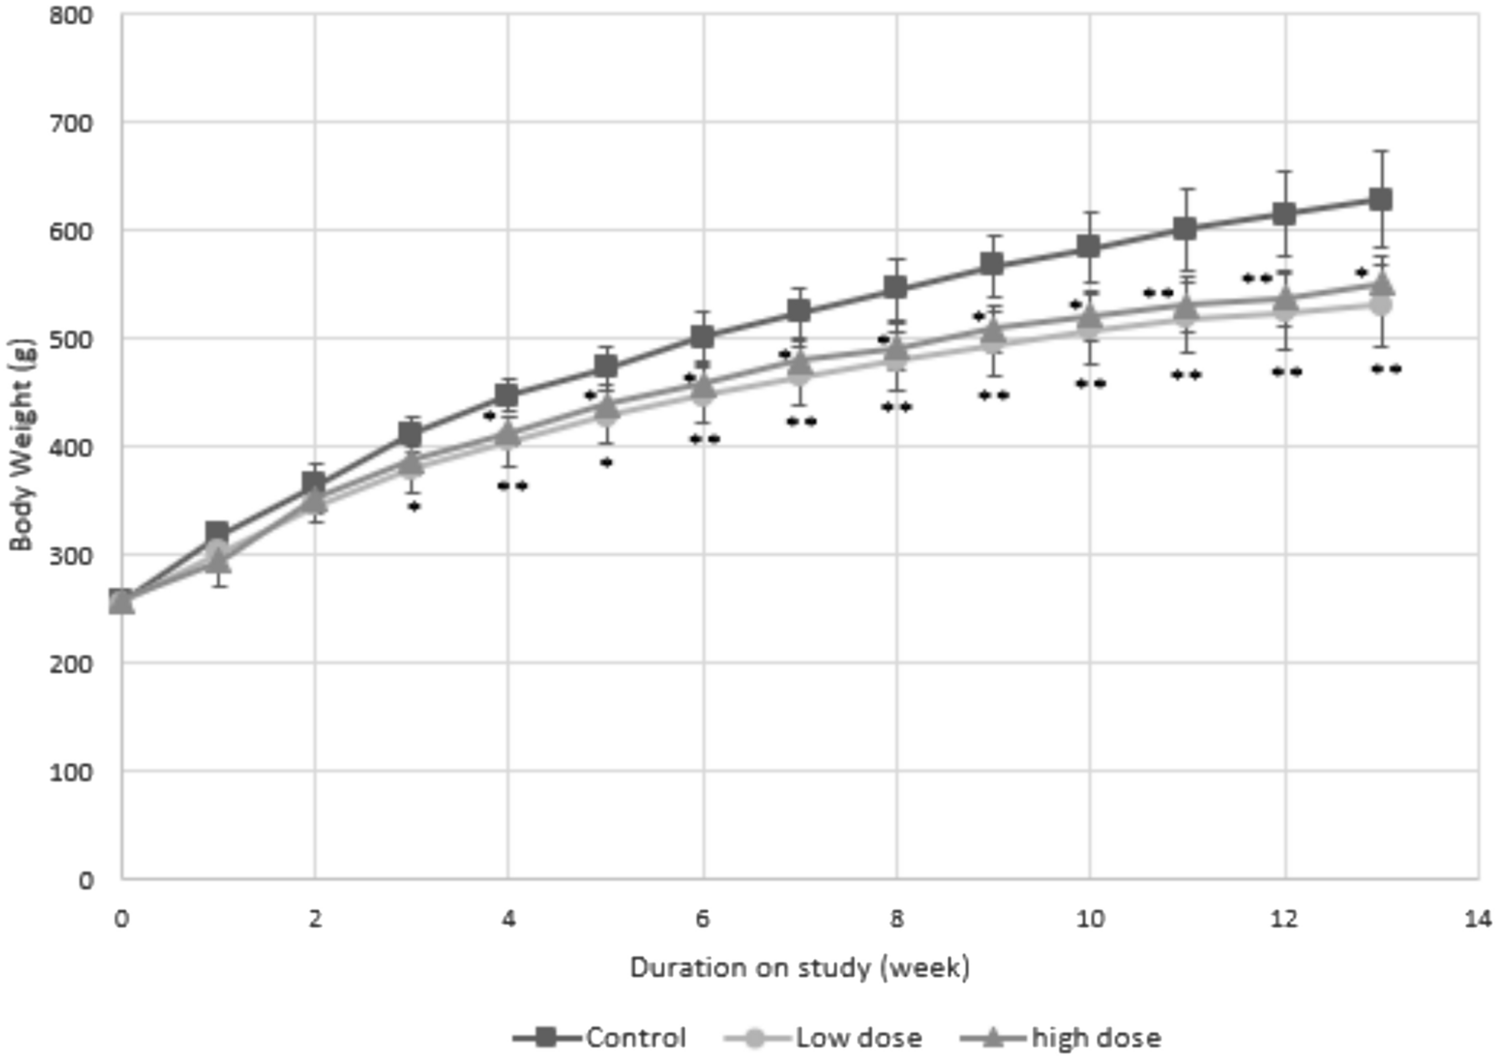
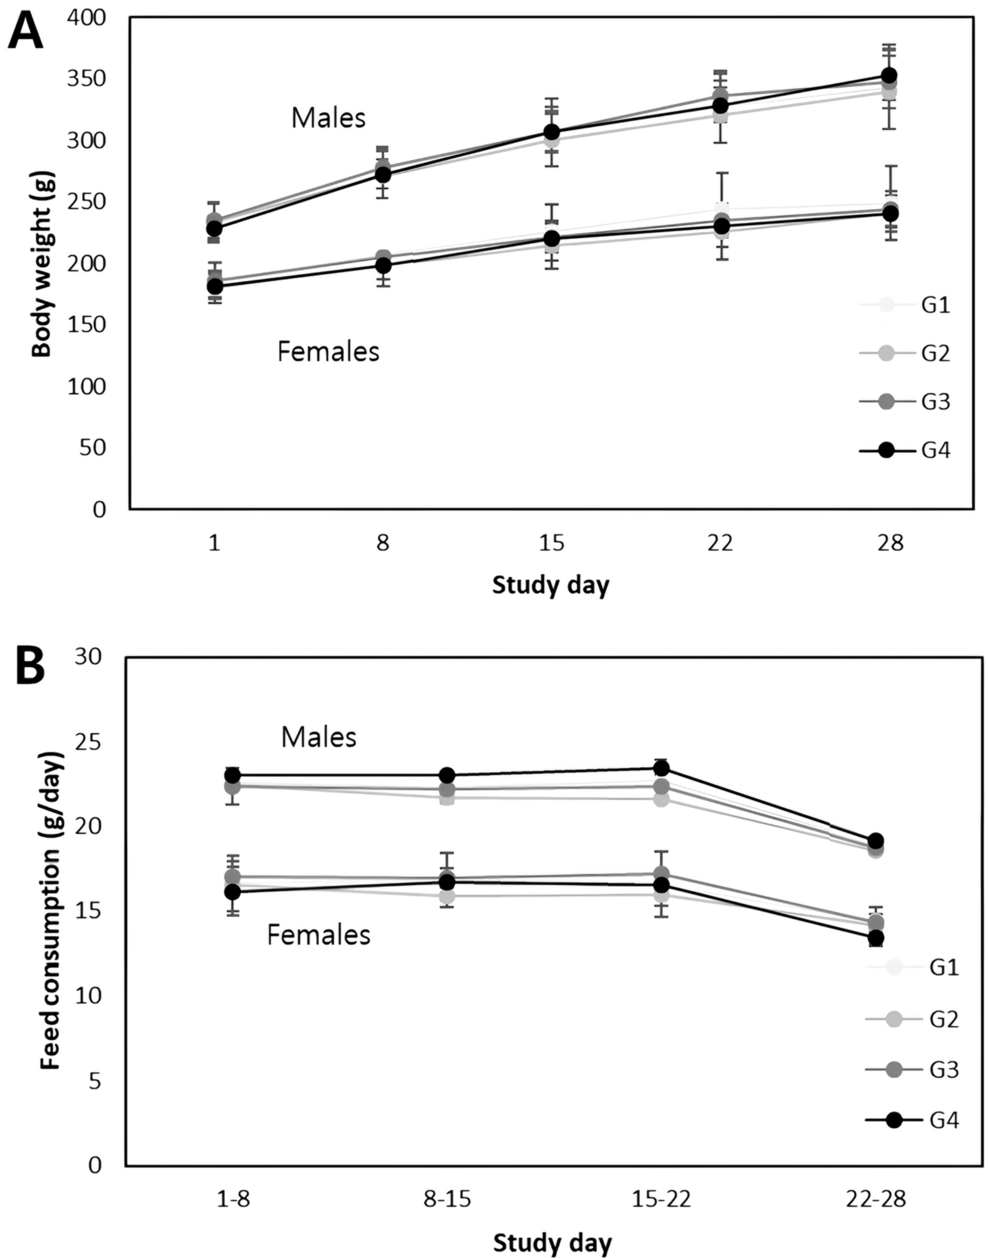
Rats were randomly divided into three groups: Control (0% RYR; n = 5), low-dose (20% RYR; n = 5); and high-dose (40% RYR; n = 5). Feed and water were given for 90 days. Food intake and body weight were measured weekly, and all animals were closely monitored for any clinical signs. At the end of the experimental period, animals were euthanized by cardiac puncture under isoflurane anesthesia and blood sample was collected. In addition, Organ weight measurements and gross pathological and histopathological examinations were conducted.
Clinical chemistry
Blood was allowed to stand at room temperature for 30 min and then was centrifuged with 3000 rpm for 20 min at 4 ℃ to obtain the serum. The serum was stored at – 20 ℃ until analysis. A chemistry analyzer (DRI-CHEM 3500 s, FUJI Photo Film Co, Tokyo, Japan) was used to measure clinical parameters for GGT, ALT, AST, alkaline phosphatase (ALP), glucose (GLU), blood urea nitrogen (BUN), creatinine, total protein (TP), albumin (ALB), total bilirubin (T-BIL), calcium (Ca), inorganic phosphorus (IP), creatinine phosphokinase (CPK), triglyceride (TG), total cholesterol (T-CHOL), high-density lipoprotein cholesterol (HDL-C), and lactate dehydrogenase (LDH). Clinical parameters for sodium (Na), potassium (K), chloride (Cl), low-density lipoprotein cholesterol (LDL-C), thyroid stimulating hormone (TSH), thyroxine (T4), and triiodothyronine (T3) were commissioned to the Dooyeol Biotech (Seoul, Korea) for a clinical chemistry test.
Organ weight and histopathological studies
The brain, heart, prostate, gastrocnemius, adrenal, thymus, spleen, pancreas, testis, epididymis, urinary bladder, seminal vesicle, liver, lungs, kidney, stomach, and thyroid were removed and weighed. The ratio of organ to brain weight was calculated. For all animals in the control and high-dose groups, the liver, lungs, kidney, brain, stomach, thyroid, urinary bladder, and gastrocnemius tissues were fixed in 10% formalin, and the fixed tissues were commissioned to the Wonkwang University of Health for a histopathology test. They were embedded in paraffin, stained with hematoxylin and eosin (H&E), and observed for any histological changes. A histopathological examination was also performed in one rat of the low-dose group for an epididymis in which visual findings were observed during autopsy.
Statistical analysis
Body weight, organ weight (absolute and relative), and clinical chemistry parameters were compared via one-way ANOVAs. When an ANOVA yielded a significant result (p < 0.05), Dunnett’s t-test was used for comparisons between each treatment group and the control group. No further testing was performed for non-significant ANOVA results. Pearson's correlation coefficient (r) was used to determine the correlation between RYR contents and food or energy efficiency.


Comments (0)