
Remember me

Land cover classification results (Fig. 3, Table 3) reveal some changes on the distribution and surfaces. Regarding agricultural and herbaceous vegetation, which is the dominant class on the basin, is distributed along the whole basin, including Serra do Cando and Serra do Candán, which are mostly covered by shrubby vegetation. Furthermore, it has experienced a decrease of 7.41% in relation to the whole basin. On the other hand, with regard to the forest area, it has experienced a general increase in 6.13% considering the three classes. These results match with several studies that have observed that, it has experienced an increase in the European continent and the Iberian Peninsula over the last decades (Velázquez et al., 2022; MA, 2005). Moreover, changes in both classes could be related with rural abandonment, a particularly worrisome phenomenon in Galicia, by which the rural population abandons the countryside and moves to urban areas (Pazo & Moragón, 2017). In addition, it is necessary to highlight the increase in the area of hardwood forest (2.16%). The increase could not only be related to rural abandonment, but also the administration recognize the value of native hardwoods and it enhance them promoting its plantation (Xunta de Galicia, 2021; BOE, 2012). Furthermore, hardwood forest is mainly located around the riverbend and the east, close to the mountains of the protected areas Serra do Cando and Serra de Candán, influence of protection measures, soil and hydrological riverbends conditions would be affecting the expansion of this vegetation (King & Keim, 2019).
Fig. 3
Comparison of spatial distribution of land cover classification results in 2013 a and 2023 b on the River Lérez Basin
Table 3 Cover surface (km2) relative frequency (%) and relative change (%) of land cover classificationMoreover, eucalyptus, which tends to be near to the sea and population centers has a notable surface as well and was increased by 0.88%. The eucalyptus class was added to the reclassified classes (Table 1, Appendix S1), even though it does not appear as a class in SIOSE reclassification, due to we are aware about the large area occupied by eucalyptus trees (mainly Eucalyptus globulus), in addition to being a non-native species with a highly invasive character (Deus et al., 2022). Eucalyptus is a controversial crop highly extended on the Atlantic biogeographic region of Iberian Peninsula (Deus et al., 2022). Despite being valuable on the local forestry industry is also associated with environmental troubles such as water consumption (Lara et al., 2021), ecosystem services reduction (Castro-Díez et al., 2021), fire hazard (Fernandes et al., 2011) or biodiversity impacts (Castro-Díez et al., 2021) between others. Even habitat fragmentation as an indirect impact as a consequence of the expansion (Calviño-Cancela et al., 2012) which can lead to connectivity reduction. This situation is particularly worrying in Galicia, as the trend on the Iberian Peninsula, according to the different climate scenarios, is for the niche to move northwards (Deus et al., 2022), making this autonomous community an even more propitious place for its expansion. Then the proximity of eucalyptus crops to protected areas is concerning, since it implies a colonization risk (Deus et al., 2022). These situation has led the local government to become aware of it with the ban on new eucalyptus plantations to stop their expansion (BOE, 2021) until end of 2025, although it could be extended. For the concerns of this study, several authors agree that the presence of small mammals and specifically mustelids is reduced in eucalyptus forests (Pereira et al., 2012; Cruz et al., 2015), lowering landscape permeability (Fig. 4, Table 2) compared with others forest surfaces. This means that growing eucalyptus in detriment of conifers or hardwoods surface would be weakening ecological connectivity.
Fig. 4
Comparative spatial distribution of ease of movement between 2013 a and 2023 b
In relation to conifer forest is not very widespread in the basin, although has been significantly increased covering a 3.09% more respect the whole basin by 2023. Regarding artificial class, despite not fill a large are area, it has increased significantly (1.29%), artificial surfaces are one of those implies graters environmental impacts and is undergoing a general increase (Lin et al., 2019). This surface is located mainly in the in the lower places, matching with the river mouth and close to the sea, where Pontevedra city is located, with 82.592 permanent inhabitants which increase during the summer is the main population center. Regarding water surfaces, although in no case it cover a significant area of the basin, as the riparian forest closes in, detection becomes impossible due to tree cover above the stream and a pixel size larger than the river width (Bolick et al., 2021), so its underestimation is inevitable.
In addition, it should be noted that the study area has the presence of Acacia dealbata and Acacia melanoxylon, both cataloged as invasive species (BOE, 2013). These species, which are scattered in small areas throughout the basin have a high flammability index (Toy-Opazo et al., 2024). The presence of these species, in an area which is the most fire-prone region in Europe (Daminatis et al., 2021) implies serious human and environmental risks. Together, these factors can lead to habitat reduction and fragmentation, increasing the risk of isolation (Driscoll et al., 2021). Moreover, in the current global change context, empty niches are often colonized by fast-growing non-native species, such as eucalyptus and acacias. These species, adapted to fire-prone environments, regenerate quickly and can outcompete native pioneer vegetation (Driscoll et al., 2021), feedback on the problem. Combined with alterations in the soil chemistry (Castro-Díez et al., 2021) and seed bank (Hernán & Bejarano, 2012) make these exotic trees a threat to native forest and local fauna.
Land Cover ValidationWith respect to validation results obtained for the year 2013 (Table 2, Appendix S1), it shows a good performance in the classification, 93.92% of the compared pixels matched. Furthermore Kappa index obtained a good score as well (0.88), that indicates a highly higher agreement than expected by a random classification and is in line with other studies (Foody, 2020). Nevertheless, not all classes behaved in the same way, agricultural and herbaceous vegetation, artificial and hardwoods were highly accurate, with low commission and omission errors. Among them, artificial class was also correctly classified with few commission and omission errors (0.02 and 0.05), although some confusion with agricultural and herbaceous surfaces was observed. Rural areas tend to have a high mosaicism between artificial and agricultural surfaces in semi-urban areas, this implies the presence of many pixels between the boundaries of both classes and surfaces whose spectral signature has characteristics of both surfaces, which could explain this confusion. In contrast, conifers and eucalyptus have a lower precision, actually 30% of pixels belonged to other classes were not correctly classified as conifers and 235 of eucalyptus pixels were classified as other classes. This confusion between eucalyptus could be affecting connectivity results considering the lower value of eucalyptus regarding other classes as conifers and hardwoods.
A solid performance in the 2023 validation results was obtained as well (Table 3, Appendix S1), 92.64% of the compared pixels matched. The Kappa index, at 0.87, also indicates a strong agreement beyond random. As in the previous classification, the agricultural and herbaceous classes obtained good accuracy and the artificial class shows confusion with the agricultural and herbaceous class, again there are discontinuous rural areas where artificial cover is in interspersed with agricultural lands where a greater confusion between these classes would be expected. Hardwoods class showed a moderate commission error (0.11) but a low omission error (0.05). In contrast to the previous classification, eucalyptus performed in a better way, maybe the training sample selected for 2023 was more representative of its spectral signature. Finally, as in 2013 conifers shows a significant commission error (0.35) with confusion with other forest classes, there is also a relevant omission mistake (0.25). Particularly some of the eucalyptus pixels belonged to conifers affecting the obtained results.
Both classifications show some errors among the three classes of tree surfaces, which is logical considering that forest surfaces are more prone to confusion among themselves than among other classes, as their spectral signatures are closer to one another (Mallinis et al., 2023).
Ecological Connectivity and FragmentationThe layer of resistance to movement created, shows how east resistance areas have increased by 2023 (Fig. 4), especially in the east of the basin, which suggests a permeability increase, so movement paths would be improving as a consequence of hardwood forest expansion.
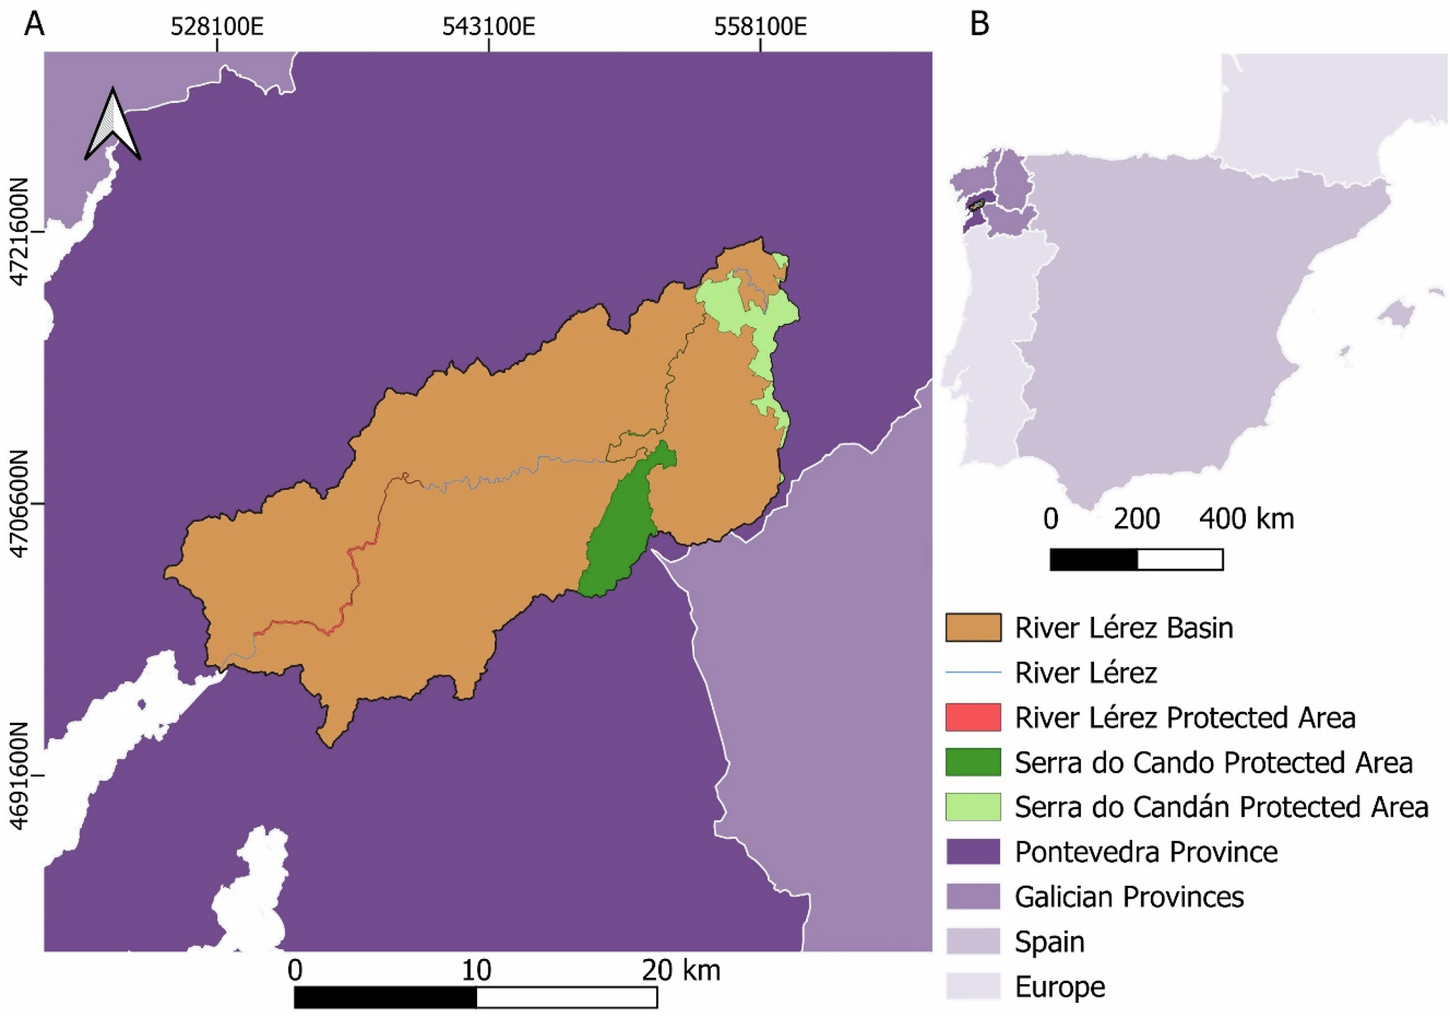
In 2013, 44 habitat patches have been identified (Fig. 5a), ranging between 0.21 km2 and 6.35 km2 with an average size of 1.01 km2 a median size of 0.59 km2 (Fig. 2, Appendix S1) and 44.71 km2 as total potential habitat. Most of the potential habitat patches, are around the center and west, where effective distance of the paths tends to be smaller, in addition there are some patches on the western zone, close to the river mouth an artificial area, this patches and patches leading from them follow a similar pattern with the riparian forest of River Lérez protected area (Fig. 1). On the other hand, by 2023 46 potential habitat patches were obtained (Fig. 5b), with sizes between 0.20 km2 and 4.75 km2, an average of 1.14, a median of 0.56 km2 and a total area 51.27 km2 (Fig. 2, Appendix S1). Results do not show some pathways that were present in 2013, although the maximum effective distance was lower. Again, most of the patches are in the central and eastern region where are the shortest paths with some more in the west which follow the river course. Furthermore, the corridors identified represent the cost distance, although this is also related to longitudinal distance and the shortest paths tend to be the strongest links.
Fig. 5
Comparative habitat patches and path pattern by effective distance and equal intervals between 2013 a and 2023 b
There was found a similar pattern for both years, although some paths have been lost in 2023. These were some of the largest and weakest ones, in fact the maximum effective distance on the path network has been greatly reduced in 2023. Path pattern have strong coincidences with the main riverbend, including the riparian forest ZEC of the River Lérez protected area as the riparian forest also included in Serra do Cando that connects with Serra do Candán. Given the strong literature supporting the importance of rivers as ecological corridors (Rinaldo et al., 2018), it is not an unexpected outcome. Despite this, rivers and riparian areas are some of the ecosystems which are under a higher degradation and reduction of ecosystem services (EME, 2012), therefore its conservation must be a priority. With the exception of riparian zones, there are not too many paths in the protected areas of Serra do Cando and Serra do Candán as these are covered mainly by shrubs, and it is not common to find hardwoods forest there. These emphasize the importance of riparian forests in connectivity even when we talk about terrestrial connectivity, the riparian forests conservation favors connectivity between protected areas that have a common fluvial network.
Despite the importance of rivers and riparian forests as ecological corridors and their relevance for biodiversity, in the city of Pontevedra, part of the Gafos River, an affluent of River Lérez, was buried for the urban development of the city (García-Alén et al., 2022). The Gafos River is recognized as a local interest natural area (Xunta de Galicia, 2019), for which there are citizens’ initiatives calling for the recovery of its urban section. It is an urban stretch of about 525 m in length. While nature-based solutions, such as urban river restoration encourage urban biodiversity, recover ecosystem services from rivers, make urban environments friendlier for local wildlife and improve urban green infrastructure. If these types of measures were implemented in the study area, it would be possible to improve the ecological connectivity between such unique and nearby protected areas.
In addition, although this study is focused on terrestrial connectivity, some species with mainly aquatic behaviors such as Lutra lutra, which are linked to riparian forest could colonize some of them as well. Even non-native fauna as Neovison vison which occupies a similar niche and it is present in Galicia where there is fur farms that pose a risk to its expansion (Martínez-Rondán et al., 2017) could colonize this patches as well.
Galicia is characterized by a high landscape fragmentation (Franco, 2011). However, the relationship between fragmentation and ecological connectivity is complex, a fragmented habitat does not always mean a low potential habitat surface (Fahrig, 2003). While some species prefer highly cohesive habitats, others are able to live in border zones and even enjoy landscape mosaicism. For border species with low surface patch requirements, fragmentation is not a drawback in case the patches are not isolated, and the area of potential habitat is not reduced (Marchesan & Kolasa, 2024). The analysis of this study considers surface and distance criteria to identify habitat patches, the shape and edge length of the patches was not included. Therefore, it could be carried out in future studies to obtain conclusions in this regard.
Furthermore, the importance of each patch in terms of betweennesses centrality metric was observed (Fig. 6). Central nodes in 2013 obtained grater values than 2023 because of the loss of some paths. Generally, the nodes in the central regions tend to a greater BC. In contrast, western areas, with more isolated patches show a lower BC. Western patches are not only located far away from the center, which is a disadvantageous position for connection with other patches, but also artificial surfaces tend to be mainly on the west side of the basin, hindering animal movement between these patches and the rest of the basin. Largest patches tend to have a higher BC as well although this relationship is not clear (Fig. 3, Appendix S1), and the position is a more relevant issue for the BC.
Fig. 6
Comparative betweennesses centrality weights of habitat patches and links with other patches between 2013 a and 2023 b
This analysis is at basin level and the out-of-basin patches were not considered; however the basin is immersed in a broader landscape matrix, and some patches could be relevant for the connections with others outside of the basin. Another factor to consider is that BC weights are assigned according to the number of paths passing through a patch and their position with respect to others. Not only the position, size or connections concerns the patch relevance. The model trats the entire hardwoods forest as equal, while habitat quality should be relevant as well. There is a possibility that a well-preserved habitat may be more visited and inhabited than a more degraded one, despite its greater isolation, as the quality is related to the probability of occupancy (Santos et al., 2008) being as relevant as patch size and position (Dennis & Eales, 1997). Even a forest area that does not get the requirements to be identified as habitat patch could be chosen and colonized if there is a high quality over others that suit with the size requirements. Could be the case with some sections of the River Lérez protected area and other riparian forests areas well-preserved, which do not occupy a large area and even due to their narrow width they are not easily detectable by remote sensing. A shape criteria was also not taken into account, although patches with the same surface and different shapes would have differences in the occupancy probability according to the species preferences (Keller & Sullivan, 2023). Other authors agree that e relevance of the habitat patches and occupancy probability is in fact due to the combined effect of position, surface, habitat quality and shape (Guttery et al., 2017).
In overall, forest area has increased, resulting in an increase in the potential habitat surface, especially hardwoods. As a result, metrics show an apparent general increase in connectivity and decrease of hardwood fragmentation over the last decade, mainly related to the increase in hardwood area, although it has not resulted in an increase in BC because of the loss of some paths.
Global structural metrics show a general improvement by 2023 regarding 2013 (Table 4). IIC has increased by 20.00%, which indicates an overall connectivity gain. PC and EC both increase with greater dispersal distances and show improvements ranging from 16.67% to 18.98% and from 8.04% to 8.84% respectively.
Table 4 Global metrics by dispersion distanceThe three metrics applied shows an improvement on the structural hardwoods forest connectivity, Saura et al. (2010) studied the European forests and their connectivity and observed a general slight increase in connectivity between 1990 and 2000 arguing that rural abandonment could be one of the causes behind this phenomenon, rural abandonment is becoming more pronounced over the time and is a concern in Galicia (Corbelle-Rico & López-Iglesias, 2024), so this could support our results as well.
Regarding iNaturalist records do not distribute evenly along the basin (Fig. 4, Appendix S1), the main hotspot is close to Serra do Cando, on the west slope. There is also other relevant area located between Serra do Cando and Serra do Candán, which match with the main habitat patch concentration, remaining records have a more dispersal location. The further record from a habitat patch or path was 5501.21 m, the average distance between a record and a habitat patch or path was 406.06 m, the median distance was 208.01 m (Fig. 5, Appendix S1), while the average distance of a random point was 854.12 m.
A shorter average distance to landscape elements, compared to a random distribution, suggests a spatial association between species occurrences and the structure of habitats and pathways. Although a concentration of records is observed in a specific area (Fig. 4, Appendix S1) this may represent both a sampling hotspot and a true presence hotspot. It is well documented that citizen science data often exhibit spatial biases toward accessible locations such as trails (Clemente et al., 2019) and areas near population centers (Van Berkel et al., 2018), which remains a methodological challenge. Nevertheless, in our case, the distribution of iNaturalist records appears more dispersed and is not predominantly clustered around the city of Pontevedra—the only major urban center in the basin. This spatial pattern suggests broader geographic coverage and potentially reduced urban bias. Considering the growing institutional support for citizen science as a tool for biodiversity monitoring, particularly within European frameworks such as the Biodiversa+ Citizen Science Toolkit (European Biodiversity Partnership, 2021) and Horizon Europe initiatives (European Commission, 2021), evaluating the applicability and limitations of these data sources is not only relevant but necessary.
There is also notorious that most of the records belonged to big mammals, and others mesocarnivores (Vulpes vulpes, Genetta genetta and Felis silvestris) with which the mustelids have great niche similarity (Barros et al., 2024) and not mustelids. Which not necessarily mean that they are not present, there is an imperfect detection factor that affects all populations studies. It is possible corroborate the presence of an organism, not at all the absence, there is always the possibility that it has not been detected, besides the fact that no all the species are equally detectable (Mackenzie & Royle, 2005). Bigger mammals leave deeper footprints and more pronounced marks on the ground, so they are easier to detect, consequently, is highly complicated to distinguish mustelids species by the footprints or excrement. In addition, species like Canis lupus have a higher social value and catch more attention. Furthermore, it should be noted that the use of geolocated records implies as well certain located error which could vary according to meteorological conditions or users devices (Koo et al., 2022; Zielstra & Hochmair, 2013).
In line with the results obtained, not only is there an apparent spatial relationship between iNaturalist records and forest habitat patches, but the patch-level metrics also indicate a decrease in fragmentation and an increase in ecological connectivity over the period analyzed (Table 5). The reduction in the SPLIT index (−53.95%) and ED (−9.29%) suggest that habitat patches have become either larger or more aggregated, reflecting a less fragmented landscape. This is further supported by the increase in EM ( + 173.66%), which indicates that patches are more connected and better integrated within the landscape matrix. Although, EL, a metric often associated with fragmentation, increased in 14.21%, this likely reflects an overall expansion of forest habitat rather than increased fragmentation, as evidenced by the decrease in ED. Collectively, these trends suggest reduced fragmentation, lower patch isolation, and a consequent improvement in landscape connectivity—particularly beneficial for hardwood specialist species that are more sensitive to habitat discontinuity.
Table 5 Comparative patch metricsGeneral DiscussionIn order to expand the temporal distance without having to mix images from several satellites and according to studies, it was decided to use Landsat due to its advantage of provide a wider temporal frame (López et al., 2024). Even in the first instance we took into account the use of Landsat 7 images in order to get a wider temporal frame. However, it was not possible to get recent Landsat 7 images without Scan Line Corrector failure (SLC) (Markham et al., 2004), a bug where empty data lines appear in the images. It should be noted that the pixel size of Landsat 8-9 is 30 ×30 m. There are other satellites such as Sentinel-2 with a higher spatial resolution of 10 × 10 m, which could be more convenient considering the fragmentation of the territory. In combination with its better spectral, it resolution could improve the classification. Nevertheless, Sentinel is a more recent satellite and only provides data since 2015 (ESA, 2015), which is the reason why it was not used. But it will certainly be a great source of information for future temporal analysis. On the other hand, the period from 2013 to 2023 could be an insufficient time period to observe significant changes in the land cover considering the surface area. Observed differences could also be explained by the classification’s confusion. Therefore, it would be interesting for future studies to extent the time period, since long-term analysis is convenient for cover changes observation (Zhong et al., 2021), although this implies the inconvenience of mixing different satellite images.
The results obtained for both classifications show good accuracy, however polygons were selected by photo interpretation with orthoimages and Google Street View, since the Landsat images were from 2013 and 2023, while the field study was in 2024, so field validation was not possible. Although fieldwork is always the ideal, the use of orthoimages combined with Google Street View is an alternative tool to reduce fieldwork when it is not possible, saving time and cost (Yeo et al.,
Comments (0)