
Remember me


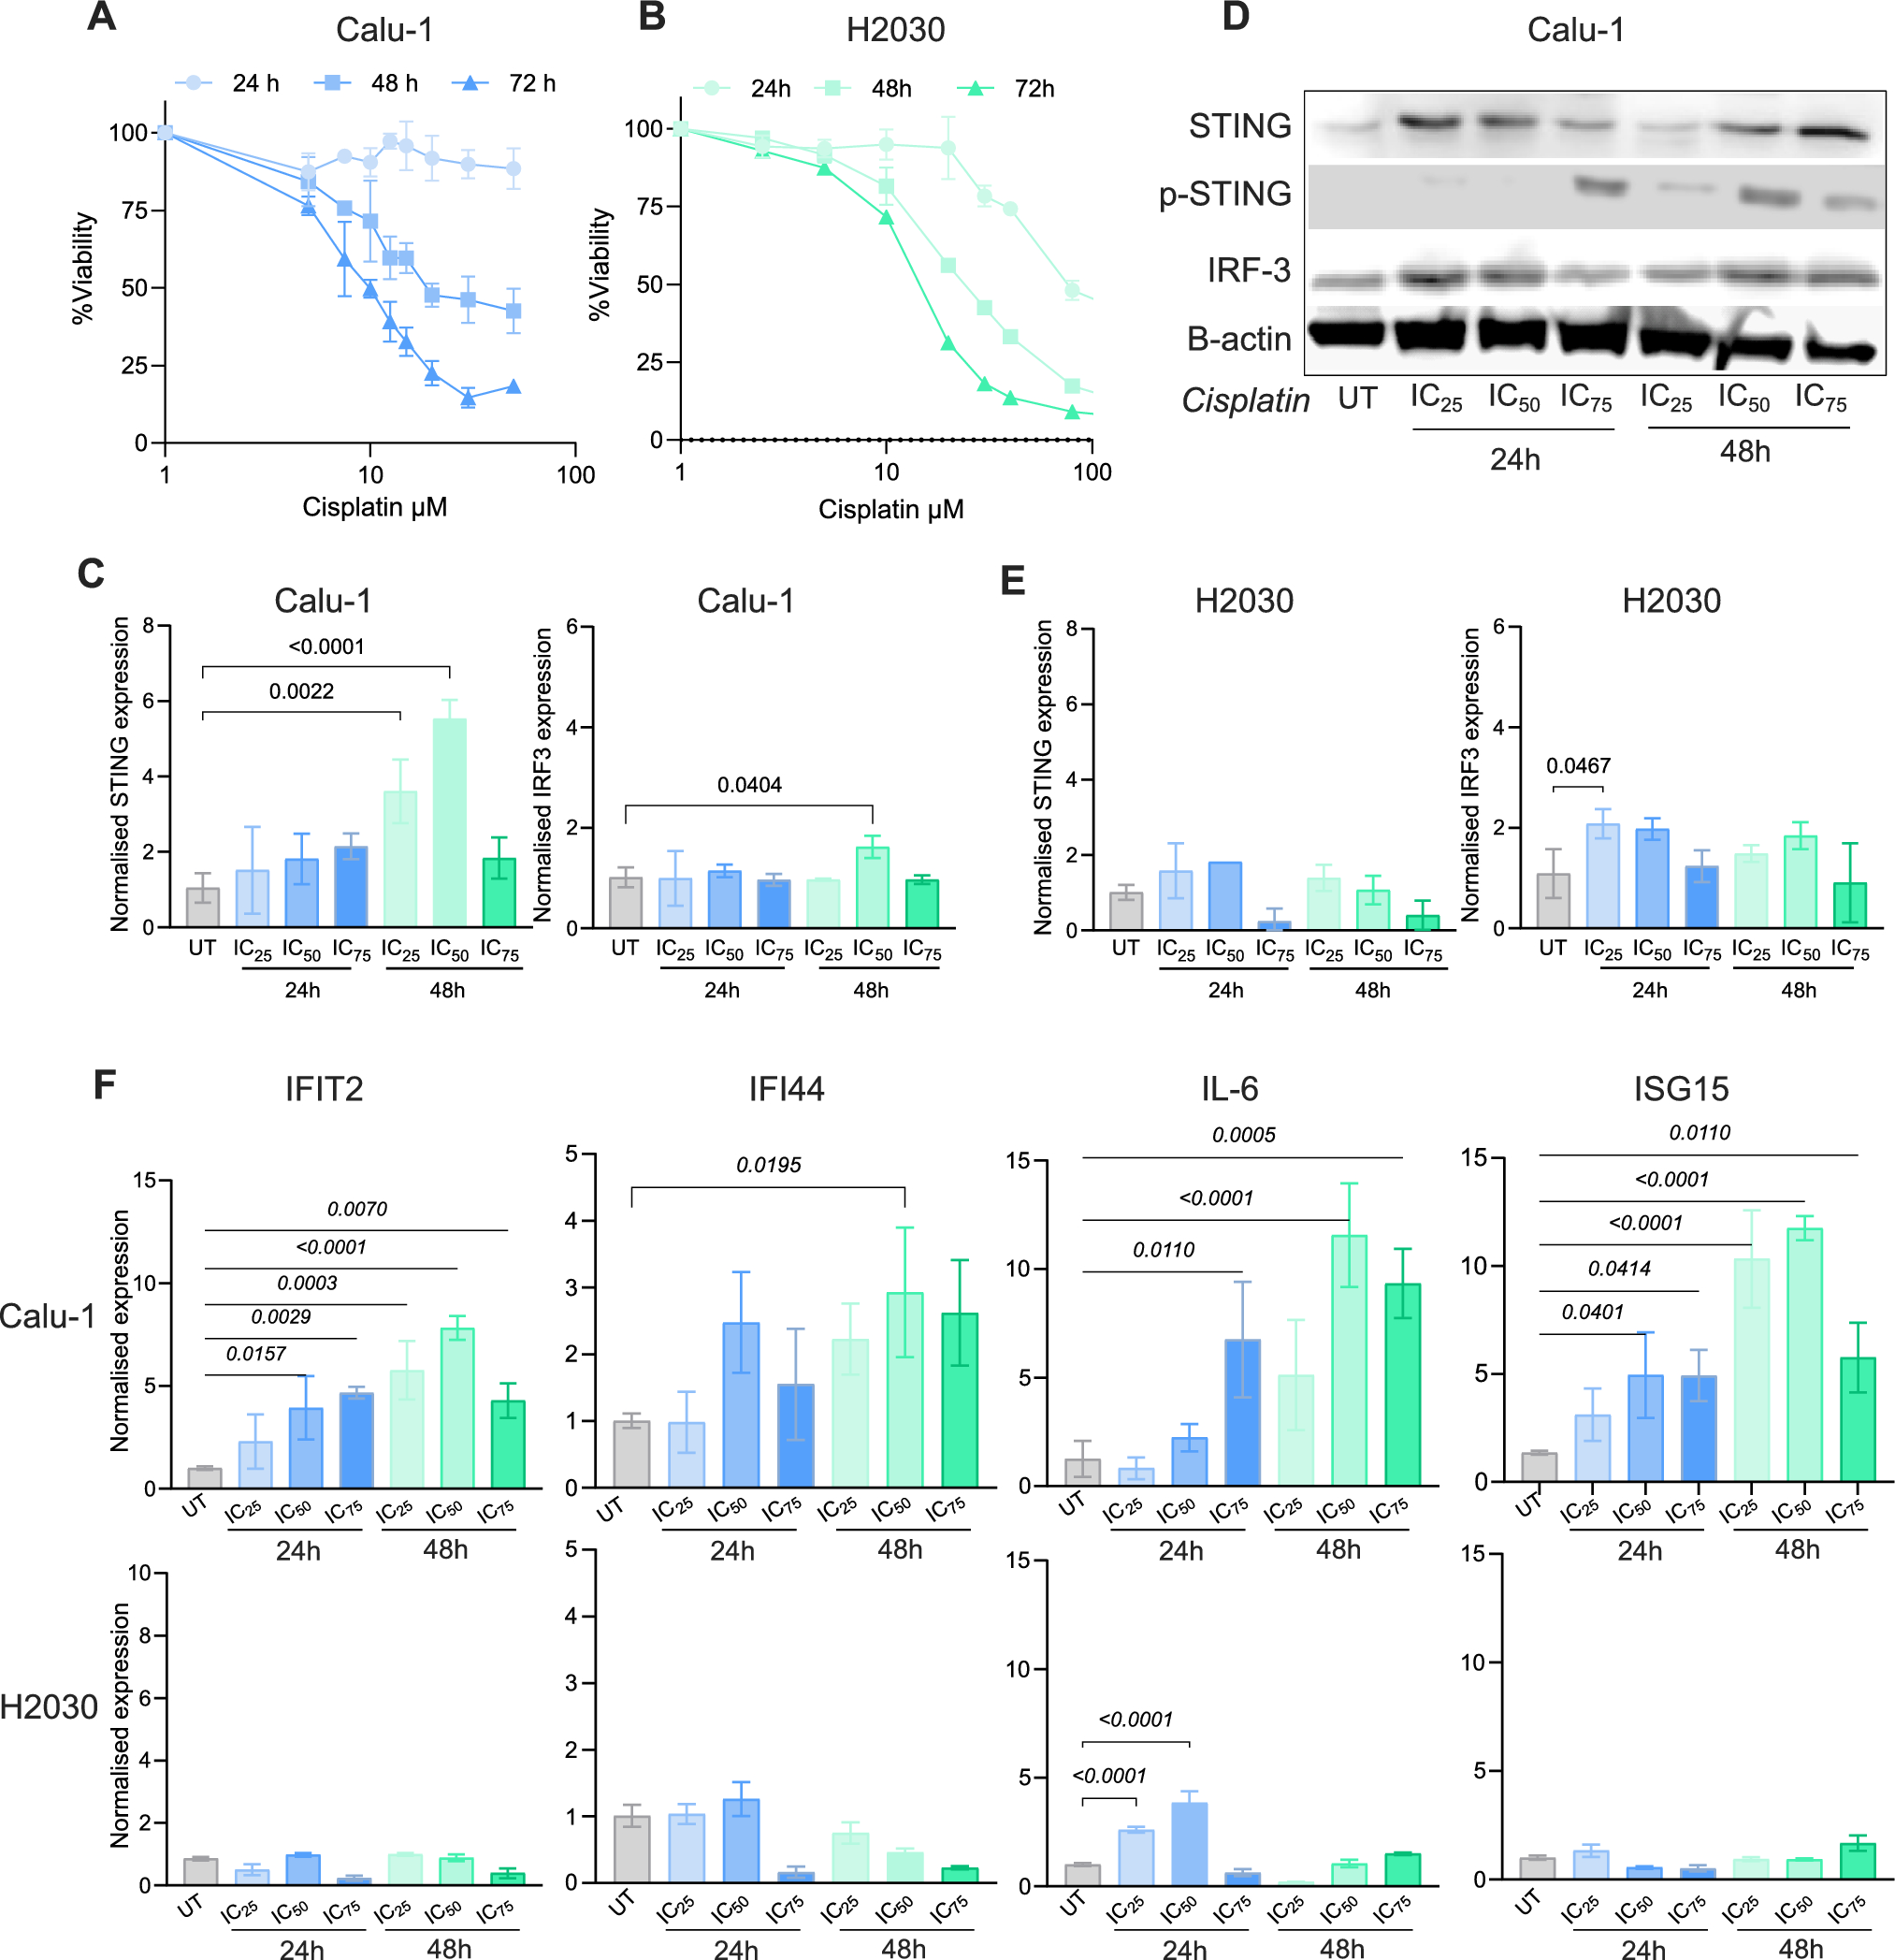

Cisplatin exhibited dose- and time-dependent cytotoxic effects on both Calu-1 and H2030 cell lines, with IC50 values at 72 h were determined as 9.16 µM and 13.52 µM, respectively (Fig. 1A, B). Cells were treated with cisplatin at IC25, IC50, and IC75 concentrations, and the expression of cGAS-STING pathway components and interferon stimulated genes was analysed.
Fig. 1
Cisplatin treatment induces STING expression in epidermoid carcinoma but not adenocarcinoma NSCLC cells. Cytotoxic effects of cisplatin in A Calu-1 and B H2030 cell lines; C mRNA expression results of STING and IRF3 in Calu-1 cells; D Western blot results for STING, p-STING and IRF3 proteins in Calu-1 cells. Β-actin was used as loading control; E mRNA expression results of STING and IRF3 in H2030 cells; F qRT-PCR results for IFIT2, IFI44, IL6, and ISG15 genes in Calu-1 and H2030 cells. The IC25, IC50 and IC75 treatment doses are; 4.58 µM, 9.16 µM and 13.75 µM for Calu-1 cells and 6.76 µM, 13.52 µM and 20.28 for H2030 cells, respectively. p-values of significant comparisons were indicated on the graphs using ANOVA and Dunnett’s multiple comparisons test
In Calu-1 cells, STING mRNA expression significantly increased in a cisplatin concentration-dependent manner, peaking at the 48 h IC50 dose (p < 0.0001). However, started to decline at the 48 h IC75 dose (Fig. 1C). Western blot analyses confirmed these findings, showing altered STING expression in response to cisplatin dose and exposure time as shown in Fig. 1D and Suppl. Figure 1A. Additionally, phosphorylated STING protein was detected at the 24 h IC75 and 48 h IC25-50-75 concentrations confirming the activation of the cGAS-STING pathway (Fig. 1D, Suppl. Figure 1B). A slight increase in IRF3 mRNA and protein expressions were detected in Calu-1 cells (Fig. 1C, D, Suppl. Figure 1C).
In contrast, qRT-PCR results showed that H2030 cells exhibited low STING mRNA levels, and no STING protein was detected via western blot analysis (Fig. 1E and Suppl. Figure 1D). A modest increase in IRF3 mRNA expression was observed at 24 h IC25 group (p = 0.0467) (Fig. 1E).
To assess the interferon response following cisplatin treatment, we analysed IFIT2, IFI44, IL-6, and ISG15 expression. In Calu-1 cells, all four genes were upregulated (Fig. 1F). However, H2030 cells exhibited a limited interferon response, with only IL-6 expression significantly increasing at 24 h IC25 and IC50 (p < 0.0001) (Fig. 1F).
These results confirm that cisplatin treatment induces STING expression and activates the interferon response in Calu-1 epidermoid carcinoma cells. In contrast, H2030 adenocarcinoma cells lack STING protein, and cisplatin does not induce STING expression or a strong interferon response. Given these differences, Calu-1 and H2030 cells serve as suitable models to investigate how autophagy modulation affects cisplatin sensitivity and the interferon response in a STING-dependent manner.
Cisplatin treatment induced autophagy in Calu-1 cellsTo evaluate the effect of cisplatin treatment on autophagy, LC3A, LC3B and ATG13 proteins were analysed by western blot and autophagosome formation was assessed using MDC staining after treating cells with IC25, IC50, and IC75 cisplatin concentrations for 24 and 48 h. In Calu-1 cells, LC3A expression remained unchanged between control and cisplatin-treated groups (Fig. 2A). However, LC3B-II conversion and ATG13 expression increased, particularly at 24 h post-treatment (Fig. 2A), indicating autophagy induction.
Fig. 2
Cisplatin treatment induces autophagy in Calu-1 epidermoid carcinoma cells. Cisplatin was applied to the cells at IC25, IC50, and IC75 concentrations for 24–48 h. A Western Blot results for LC3A, LC3B, ATG13, and B-actin proteins in Calu-1 and H2030 cells. B MDC staining of autophagosomes and bar graph of the autophagosome ratios in B Calu-1 and C H2030 cell line (n = 100). Scale bar = 100 µm. The same β-actin loading control is shown in Figs. 1(D) and 2(A) as the membrane was stripped and re-probed for multiple target proteins
In contrast, H2030 cells showed a decrease in LC3B-II conversion following cisplatin treatment compared to untreated controls, with very low LC3B-II levels detected in cisplatin-treated cells (Fig. 2B). ATG13 expression was not detected at the IC25 and IC50 doses of 48 h treatment in H2030 cells.
MDC selectively accumulates in the autophagic vacuoles, allowing for visualization of autophagosome formation [20]. In Calu-1 cells, autophagosomes significantly increased with cisplatin concentration and exposure time. The highest increase was seen at the 48 h IC75 dose, where a 946.7 ± 72.04-fold increase was observed compared to the control (p < 0.0001) (Fig. 2C). In contrast, H2030 cells exhibited no significant changes in autophagosome formation (Fig. 2D). These findings confirm that cisplatin induces autophagy in Calu-1 cells but not in H2030 cells, suggesting a potential link between STING expression and autophagy induction in response to cisplatin treatment.
Impact of autophagy inhibition on cisplatin sensitivity, STING expression, and interferon responseTo assess the effects of autophagy inhibition on cisplatin sensitivity, STING expression and interferon response, Calu-1 cells were treated with cisplatin combined with chloroquine (CQ). Our results showed that inhibition of autophagy enhanced cisplatin sensitivity (Fig. 3A). Specifically, the IC50 value for cisplatin alone in Calu-1 cells was 9.16 µM, which decreased to 4.36 µM with the addition of CQ, indicating an increased sensitivity to cisplatin.
Fig. 3
Impact of inhibition of autophagy on cisplatin sensitivity, STING expression and interferon response. A Viability curves of cisplatin (Cis.) and Cis. + Chloroquine (CQ) treated Calu-1 cells. Cisplatin doses: 60-50-40-30-20-10-5 μM and CQ dose: 50 µM; B qRT-PCR results of STING and IRF3 gene expression in Calu-1 cells. Cisplatin concentrations: 4.58, 9.16, 13.75 µM for IC25, IC50 and IC75 groups, respectively. CQ dose: 50 μM. C Protein levels of STING, p-STING and IRF3 in Calu-1 cells. β-actin protein used as a loading control. D Protein levels of autophagy markers (LC3A-II, LC3B-II, and ATG13) analysed by Western Blot. 20 μg total protein was loaded for all Western Blot analysis. E MDC staining of autophagosomes, Scale bar = 50 µm and 100 µm. F Bar graph showing the number of autophagosomes (n = 100 cells). G mRNA expression levels of IFIT2, IFI44, IL6, and ISG15 genes. Significant p values were calculated using ANOVA and Dunnett’s multiple comparisons test
Although cisplatin treatment significantly increased STING mRNA levels (Fig. 1C), autophagy inhibition with CQ resulted in a substantial reduction in STING expression in all Cis. + CQ treatment groups (Fig. 3B). Similarly, IRF3 mRNA expression was significantly decreased in the IC50 + CQ and IC75 + CQ treatment groups (Fig. 3B). Compared to the CQ− control, where only autophagy was inhibited, the total STING and IRF3 protein levels were notably reduced in IC75 + CQ group (Fig. 3C, Suppl. Figure 2A, B). However, slight p-STING expression was similar between control and treated cells (Fig. 3C).
LC3A-II accumulation was observed upon CQ treatment, with an approximately 1.6-fold increase detected in the IC25 + CQ group (Fig. 3D, Suppl. Figure 2C.). Inhibition of autophagy with CQ also resulted in LC3B-II accumulation: however, the combination of cisplatin and CQ dramatically increased LC3B-II in all treatment groups (Fig. 3D). Moreover, ATG13 protein expression slightly decreased in the cisplatin and CQ treated groups (Fig. 3D, Suppl. Figure 2D).
While the number of autophagosomes significantly increased following cisplatin treatment (Fig. 2B), the cisplatin + CQ combination led to a marked decrease in autophagosomes, suggesting that suppression of autophagy flux impaired the autophagic process (Fig. 3E, F).
In addition, we investigated the effects of autophagy inhibition on the stimulation of interferon regulated genes. Our qRT-PCR analysis revealed that IFIT2, IL-6 and ISG15 expression were significantly decreased in all Cis. + CQ combine treatment groups (Fig. 3G). For IFI44 mRNA, comparison between IC25 vs IC25 + CQ groups was not significant; however significant decreases were observed for IC50 vs IC50 + CQ (p = 0.0072) and IC75 vs IC75 + CQ (p = 0.0046) comparisons (Fig. 3G). These findings demonstrate that inhibition of autophagy leads to suppression of STING expression and the interferon response following cisplatin treatment.
Impact of induction of autophagyTo examine the effects of stimulated autophagy on cisplatin sensitivity, STING expression, and interferon response, starvation (STR) experiments were performed. In Calu-1 cells, IC50 concentration of cisplatin increased from 9.16 µM to 36.35 μM after starvation (Fig. 4A). In contrast, starvation did not affect IC50 value of cisplatin in H2030 cells (Fig. 4B).
Fig. 4
Impact of induction of autophagy on cisplatin sensitivity and STING expression. Cytotoxic effects of cisplatin in serum-starved A Calu-1, and B H2030 cells. Cisplatin treatments were applied at concentrations of 60-50-40-30-20-10-5 μM for 72 h.; C qRT-PCR results of STING and IRF3 gene expressions. p values for significant comparisons are indicated on the graphs using ANOVA and Dunnett’s multiple comparisons test. (*:p < 0.0001, **:p = 0.0002 for IRF3). The IC50 concentration was used for cisplatin treatments; D Western blot result of LC3A, LC3B, STING, p-STING, IRF3, and ATG13 proteins in Calu-1 and H2030 cell lines; E MDC staining of serum-starved and cisplatin treated cells, Scale bar = 100 µm.; F Bar graphs showing the number of autophagosomes
In Calu-1 cells, compared to untreated controls, cisplatin and starvation both reduced STING and IRF3 mRNA levels after 4 and 6 h of treatment, with expression returning to basal levels by the 8th hour (Fig. 4C). Although MDC staining indicated the presence of autophagosomes after starvation, western blot analysis did not show a significant increase in LC3B-II levels, suggesting limited autophagic flux. Consequently, no significant differences were observed when comparing the STR and Cis. + STR groups. Western blot analysis confirmed STING depletion at 6 h and a decrease in IRF3 protein expression at 8 h in Calu-1 cells (Fig. 4D, Suppl Fig. 3). A slight p-STING expression was observed at 4 and 6 h (Fig. 4D, Suppl Fig. 3).
For H2030 cells, starvation did not induce STING protein expression (Fig. 4D), therefore we did not analyse p-STING in H2030 cells. STING mRNA was detected at very low levels with no differences between the groups (Fig. 4C). Although IRF3 mRNA expression in H2030 cells decreased with starvation and cisplatin compared to control, no significant differences were observed between the groups. Similarly, IRF3 protein expression in H2030 cells exhibited similar patterns across all groups (Fig. 4D, Suppl. Figure 4).
Western blot analysis showed that LC3B-I and LC3B-II levels increased after starvation; however, cisplatin exposure did not affect the expression of LC3B in Calu-1 cells. Over time, LC3B accumulation did not continue (Fig. 4D, Suppl. Figure 3). LC3A-I and LC3A-II expressions were similar between cisplatin-treated and untreated starvation groups for both Calu-1 and H2030 cells (Fig. 4D, Suppl Figs. 3, 4). On the other hand, starvation and cisplatin exposure did not lead to LC3B-II accumulation in H2030 cells. ATG13 protein was re-expressed after being depleted over time in Calu-1 cells; whereas in H2030 cells, ATG13 levels slightly decreased compared to the control group and remained at a stable level (Fig. 4D, Suppl. Figures 3, 4).
MDC staining of autophagosomes revealed that starvation increased the number autophagosomes and cisplatin treatment further increases their number in Calu-1 cells (Fig. 4E, F). In contrast, starvation decreased the number autophagosomes in H2030 cells.
Regarding interferon-stimulated gene (ISG) expression, we observed that cisplatin treatment increased the starvation-inhibited ISG15 expression in Calu-1 cells (Fig. 5A). The expression levels of IFIT2, IFI44, and IL-6 were similar between cisplatin-treated and untreated serum-starved Calu-1 and H2030 cells (Fig. 5).
Fig. 5
Impact of induction of autophagy on interferon response. qRT-PCR results of IFIT2, IFI44, IL-6 and ISG15 gene expressions in serum-starved and cisplatin treated A Calu-1, and B H2030 cells. The IC50 concentration was used for cisplatin treatments. p values for significant comparisons were calculated using ANOVA and Dunnett’s multiple comparisons test
Comments (0)