Cell lines and reagents
Human TNBC cell lines (BT-549, HCC1937 and MDA-MB-231) and non-tumoral human breast epithelial cell line (MCF10A) were obtained from American Type Culture Collection (ATCC), HEK-293T cell line was obtained from GE lifesciences (Buckinghamshire, UK). MCF10A cell lines were cultured in MCF10A cell special medium and other cell lines were separately cultured in RPMI 1640 medium and Dulbecco’s Modified Eagle’s Medium supplemented with 10% fetal bovine serum (FBS), and maintained in an incubator containing 5% CO2 at 37 ℃. The following reagents were commercially obtained: Bafilomycin A1 (BafA1) was from TargetMol (Shanghai, China); GW4869 was from Sigma-Aldrich (MO, USA); Rab27a siRNA and siRNA-mate plus transfection reagent were from GenePharma (Suzhou, China); The eukaryotic expression vector pcDNA3.1 (+) encoding Rab27a was purchased from GENCEFE Biotech (Wuxi, China); EGFP-LC3B and PBABE-puro mcherry-EGFP-LC3B plasmids were from Wuhan Miaoling Biotechnology (Wuhan, China); Lipofectamine 2000 Reagent was from Thermo Fisher (MA, USA); Lyso-Tracker Green was from Beyotime Biotechnology (Shanghai, China). Antibodies against P62, LC3AB, GAPDH and Goat Anti-Rabbit IgG (H + L) (peroxidase/HRP conjugated) were from Elabscience (Houston, USA); Antibodies against CD9, TSG101, ALIX and CD63 were from Abcam (MA, USA); the antibody against Rasal2 was from proteintech (Chicago, USA); the antibodies against calnexin and β-actin were from Cell Signaling Technology (MA, USA); the antibody against HSP70 was from Zenbio (Chengdu, China); the antibody against Rab27a was from Fine Test (Wuhan, China); the antibody against Myc was from Santa Cruz Biotechnology (TX, USA); the antibody against Flag was from Sigma (MO, USA); Animal experiment was authorized by the Animal Ethical Committee of Qingdao University.
Establishment of Rasal2 knockout (KO) cell lines and Rab27a knockdown (KD) cell lines
Rasal2 KO MDA-MB-231 cell lines were established by CRISPR/Cas9 gene-editing technique. gRNA sequences of Rasal2: gRNA-A1: 5ʹ-CATGCTGGGAGGTTTCTTCAAGG-3ʹ; gRNA-A2: 5ʹ-GACCACCTCAGATCTATCAGTGG-3ʹ. The synthesized gRNA (RNP complex) was transfected into MDA-MB-231 cells by electrotransfer technique using Neon™ transfection system device and stable KO cell lines were generated by the selection of monoclonal population of cells.
Rasal2 KO/Rab27a KD (KO + KD) MDA-MB-231 cell lines were established by siRNA-mate plus transfection Reagent. siRNA sequence of Rab27a: 5ʹ-GGAGAGGUUUCGUAGCUUATT-3ʹ. Rab27a siRNA was transfected into Rasal2 KO MDA-MB-231 cell lines by transfection reagent to generate transient (KO + KD) MDA-MB-231 cells.
EVs separation and purification
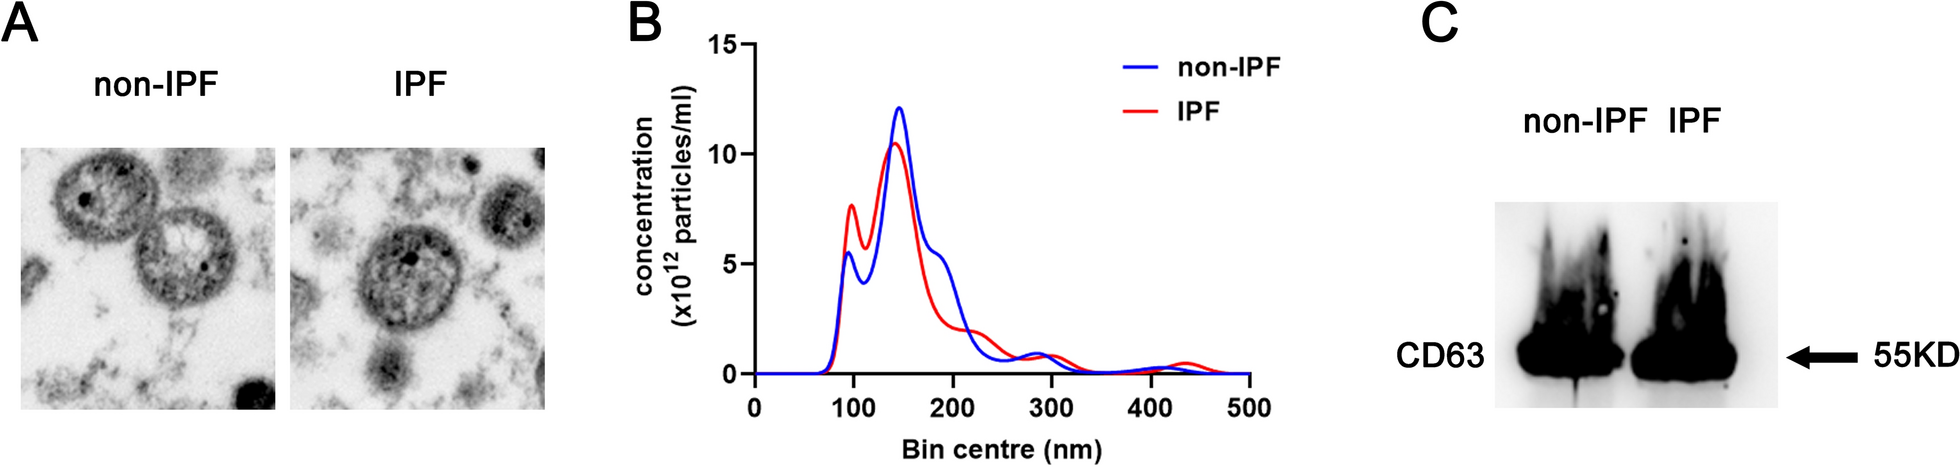
EVs were separated and purified from MDA-MB-231 cell culture supernatant by differential ultracentrifugation (UC) according to the protocol from Théry C et al. [36]. In brief, cells were cultured in DMEM supplemented with 10% exos-depleted FBS for 24 h, then the supernatant was collected and centrifuged at 300×g for 10 min to remove cells, after which the supernatant was subjected to sequential centrifugation at 2,000×g for 10 min and 10,000×g for 20 min to remove dead cells and cell debris, respectively. The resulting supernatants were filtered using a 0.2 μm filter, followed by ultracentrifugation at 100,000×g for 70 min. Again, the pellets were resuspended in PBS and ultracentrifuged at 100,000×g for 70 min. All centrifugations were carried out at 4 °C.
Nanoparticle tracking analysis (NTA)
The size distribution of the purified particles was detected using NanoSight NS300 (Malvern Panalytical Ltd., Malvern, UK) equipped with an NanoSight Software (NTA version 3.3.301). In brief, the purified particles were diluted in PBS to adjust their concentration (30–100 particles/frame) within the linear range of the instrument as recommended by the manufacturer before NTA analysis, then the diluted sample was taken up with a syringe and introduced into the chamber. Then the diameter (nM) and the concentration (particles/mL) of the particles were detected and analyzed.
Transmission electron microscopy (TEM)
TEM was carried out to observe the morphology and the size of the purified samples as previously described [36]. In brief, the samples were adsorbed onto the formvar coated grids and then fixed with 4% glutaraldehyde, after which the samples were stained with 2% uranyl acetate (UA). The grids were finally analyzed and the images were captured by a JEOL JEM-1400 transmission electron microscopy (JEOL, Tokyo, Japan) equipped with a digital photomicrograph ORIUSTM SC1000 CCD camera (GATAN Inc., Pleasanton, California).
Colony formation assay
Cell proliferation capacity was detected by a clonogenic assay as described. Briefly, MDA-MB-231 cells (Control (CT), KO, KO + KD) were trypsinized and seeded into a six-well plate at a density of 800 cells/well in triplicate. After incubation at 37℃ for 14 days, the cells were fixed and stained with 0.1% crystal violet to visualize colonies. Colonies were photographed and colony number was counted manually.
Wound healing assay
Cell migration was evaluated by scratch wound assay as described. Briefly, MDA-MB-231 cells (CT, KO, KO + KD) were inoculated in 6-well plates and cultured into monolayers, then a scratch wound of the monolayers was generated by using a sterile 200 µL pipette tip and the floating cells were removed by washing with PBS. The scratches were photographed under an inverted microscope (Leica microsystems, Wetzlar, Germany) at different times (0, 24 h) after scratching. The scratch gap distance was quantitatively measured by Image J software and the scratch healing rate was calculated.
Transwell assay
Transwell plates coated with or without Matrigel reagent (BD bioscience, SanJose, CA) were used to analyze the ability of cell invasion and migration, separately. Briefly, MDA-MB-231 cells (CT, KO, KO + KD) suspended in serum-free medium were added to the upper compartments and culture medium plus 10% FBS was added to the lower compartments. After cultivation for 24 h, the upper compartments was cleaned with a cotton swab to remove cells, the lower compartments was fixed with 4% paraformaldehyde and stained with 0.5% crystal violet (Sigma). Then the migrated cells were imaged and manually counted under an inverted microscope (Zeiss, Germany). The procedures for the cell invasion were the same as for the cell migration except that the upper compartment was precoated with 100 µl of Matrigel. Transwell assay was conducted three times with three biological repetitions each time.
Western blot analysis
Proteins expression was detected by western blotting. Total proteins were prepared with RIPA buffer (Elabscience) and the concentrations of protein samples were determined using BCA reagent kit (Elabscience). The equal proteins were fractionated by SDS/PAGE gels and transferred to 0.45 μm PVDF membrane (Solarbio). After sealing with 5% skimmed milk, the membrane was incubated with the indicated primary antibodies at 4 °C overnight and then incubated with horseradish-peroxidase-conjugated secondary antibody for 1 h at room temperature. Afterwards, the protein bands were visualized by enhanced chemiluminescence and quantified by the Image J software (National Institutes of Health, Bethesda, MD, USA).
Autophagic flux analysis
Autophagic flux was evaluated by PBABE-puro mcherry-EGFP-LC3B plasmid (Miaoling, Wuhan, China). The plasmid was transfected into MDA-MB-231 cells (CT, KO, KO + KD) by Lipofectamine 2000 (Thermo Fisher) according to the manufacturer’s protocols. After transfection for 18 h, the cells were treated with BafA1 for 6 h and the images acquisition was performed by using STELLARIS 5 confocal microscopy (Leica, Germany). Then autolysosomes (red puncta) and autophagosomes (yellow puncta) per cell were quantified from at least 10 cells in three independent experiments and the proportions of autophagosomes and autolysosomes were calculated respectively to indicate autophagic flux.
Lyso-tracker assay
Lysosomal acidity was detected by acidotropic fluorescent probe Lyso-Tracker Green according to the manufacturer’s instructions (Beyotime, Shanghai, China). Briefly, MDA-MB-231 cells (CT, KO, KO + KD) were seeded and incubated with Lyso-Tracker Green solution (50 nM) at 37℃ for 60 min. The nucleus was dyed with DAPI after staining. Then the cells were observed and the images were acquired by using STELLARIS 5 confocal microscopy (Leica, Germany).
Immunofluorescence analysis
Immunofluorescence analysis was conducted to observe the colocalization of autophagosomes and MVBs as previously described [37]. Briefly, MDA-MB-231 cells (CT, KO, KO + KD) were seeded and transfected with EGFP-LC3 plasmid for 24 h. The medium was removed and the cells were washed with PBS. Subsequently, the cells were fixed with 4% paraformaldehyde for 15 min, permeabilized with 0.1% Trition-X at room temperature for 10 min, blocked with 10% BSA for 1 h, and then incubated with anti-CD63 antibody overnight, followed by incubation with goat anti-Mouse IgG (H + L) for 1 h. The cells were observed under a STELLARIS 5 confocal microscopy (Leica, Germany) and the images were obtained and analyzed using the Image J software.
Co-immunoprecipitation analysis (Co-IP)
Co-IP analysis was conducted as described by the protocol of a standard method [38]. Briefly, the cells were seeded and transfected by Lipofectamine 2000. The cell lysates were extracted with a RIPA buffer and the immunoprecipitates were then formed by binding the target protein with the indicated antibody and incubating with anti-Flag (M2) antibody-conjugated beads or GTP beads overnight at 4 ℃. Finally, the immunoprecipitates were washed and electrophoresed on SDS-PAGE gels, transferred to a PVDF membrane, probed with the antibodies, and visualized with enhanced chemiluminescence.
Immunohistochemical analysis (IHC)
IHC was used to detect the expression of proliferation-associated and autophagy-related proteins in tumor tissues. Briefly, fresh tumor tissues fixed with 4% paraformaldehyde for 24 h was embedded in paraffin and cut into 5 mm paraffin sections. Immunohistochemical staining was performed with the rapid immunohistochemical kit (Elabscience, China). Antibodies used in IHC were P62 (1:100), LC3 (1:100) and Ki67 (1:400). After reacting with biotinylated secondary antibody, DAB staining was performed. Then the sections were observed and imaged under the Panoramic Tissue Cell Scanning Analyzer (Pannoramic MIDI, Hungary).
Xenograft model assay
A total of 18 BALB/c female nude mice were purchased from Vital River Laboratory Animal Technology (Beijing, China). All nude mice were randomly divided into three groups (n = 6) and subcutaneously injected with MDA-MB-231 cells (CT, KO, KO + KD), individually. The dimension (width and length) of tumors and the weight of mice in each group were measured every 6 d and the tumor volume was calculated as (width × width × length)/2. At 42 d, blood was collected by eyeball enucleation before the mice were sacrificed. Then the exos were extracted from the serum separated from blood and the expression of autophagic and exosomal marker proteins in exos was detected by western blot analysis. Additionally, immunohistochemistry (IHC) assay was performed to determin the expression levels of Ki67, P62 and LC3 in tumor tissues after the tumors were photographed and weighed.
Statistical analysis
Data analysis was performed using GraphPad Prism software (La Jolla, CA, USA). The results were presented as means ± standard deviation (SD). Statistical significance between groups was determined by One-way ANOVA or Student’s t-test. A p-value less than 0.05 was considered to be a significant difference.


Comments (0)