Bacteria
Fusobacterium nucleatum (ATCC 25586) was anaerobically cultivated in a 37 °C incubator, utilizing an atmosphere composed of 80% N2, 10% H2, and 10% CO2. The culture medium employed was brain–heart infusion (BHI), sourced from Haibo in Qingdao, China, and supplemented with 5 mg/mL of hemin and 1 mg/mL of menadione. The incubation period ranged from 24 to 48 h.
Cell isolation and culture
Primary osteoblasts were isolated from the calvariae of 24 to 48-hour-old fetal Wistar rats through a sequential enzymatic digestion process. The gender-neutral Wistar rats were sourced from the Shandong University Laboratory Animal Center. The entire experimental protocol was approved by the Animal Ethics Committee of the School and Hospital of Stomatology, Cheeloo College of Medicine, Shandong University, and adhered to the guidelines outlined in the National Institutes of Health Guide for the Care and Use of Laboratory Animals. Calvariae, stripped of all soft tissues, were subjected to digestion in 5 ml of alpha-minimum essential medium (α-MEM, supplied by BasalMedia, Shanghai), which contained 0.1% collagenase II (from Sigma-Aldrich, USA) and 0.25% trypsin (from Invitrogen, USA). This digestion process was carried out at 37 °C for a duration of 20 min. Subsequently, the samples were centrifuged at 300×g for 5 min at 4 °C, and the supernatants were discarded. The resulting precipitates were then digested three more times in 5 ml of 0.1% collagenase II, with each digestion lasting 30 min. Finally, the digested cells were collected by centrifugation at 800×g for 10 min. These cells were cultured in α-MEM supplemented with 20% fetal bovine serum in a 37 °C incubator with 5% CO2. Once the cell monolayer reached 85–90% confluence, the cells were trypsinised and passaged to expand the culture in α-MEM containing 10% fetal bovine serum and no antibiotics.
MC3T3 cells were cultured in DMEM supplemented with 10% fetal bovine serum in a 37 °C incubator with 5% CO2.
Mouse model experiments
The animal experiments conducted in this study were approved by the Ethics Committee of the School and Hospital of Stomatology, Cheeloo College of Medicine, Shandong University (NO. 20211134) and adhered to the National Institutes of Health’s guidelines for the care and use of laboratory animals. C57BL/6J male mice aged 7–8 weeks were obtained from Vital River Laboratory Animal Technology (Beijing, China) and housed at Shandong University’s Model Animal Center. Following a week of acclimatization, mice were randomly divided into two groups, with 10 mice in each group and ligated with 4 − 0 thread on the second molar of the maxillae, while the other group without ligature was set as the negative control. Fn was applied to the silk thread at a dose of 1 × 10⁸ CFU every 3 days for 4 weeks. At the end of the experiment, the rats were sacrificed, and their maxillae were harvested and fixed in 4% paraformaldehyde (Solarbio, Beijing, China).
Micro-CT
The maxillary bones were imaged using a Quantum GX2 micro-CT scanner (PerkinElmer, Japan) at settings of 90 kV, 88 µA, and a voxel size of 18 μm. To evaluate alveolar bone loss, six predefined sites around the maxillary second molars in rats were measured: buccal-mesial, buccal-furcation, buccal-distal, palatal-mesial, palatal-furcation, and palatal-distal. Subsequently, the average distances were computed. The maxillary structures were reconstructed utilizing Mimics software and CT Analyzer, with a rectangular area of approximately 1.6 mm² beneath the root bifurcation of the maxillary second molar designated as the region of interest (ROI). Within these ROIs, parameters pertaining to alveolar bone were quantified, including bone volume fraction (BV/TV), bone mineral density (BMD), and trabecular spacing (Tb.Sp.).
Assessment of histopathology
The mouse maxillae underwent decalcification using a 12.5% EDTA solution with a pH range of 7.2 to 7.4 for a duration of 2 months. Following decalcification, the maxillae were dehydrated and subsequently embedded in paraffin. Tissue sections, measuring 5 micrometers in thickness and embedded in paraffin, were stained with hematoxylin and eosin (H&E) to enable the observation of morphological alterations in both the alveolar bone and periodontal connective tissue.
Cell proliferation assay
Primary osteoblasts pooled from different rats were cultivated in 24-well plates at a density of 5 × 10^4 cells per well, utilizing osteogenic inductive medium comprising α-MEM enriched with 10% fetal bovine serum, 50 mg/L ascorbic acid, and 10 mmol/L β-glycerophosphate (Sigma). Subsequently, suspensions of Fn were introduced to the osteoblast monolayers at optimal multiplicities of infection (MOIs) of 0, 10, 50, and 100 for 24 h, respectively. This process occurred at 37 °C in a 5% CO2 environment. A 5-ethynyl-2’-deoxyuridine (EdU) labeling assay was conducted following the instructions provided by the EdU Apollo DNA in vitro kit (RiboBio, Guangzhou, China) to assess the cell proliferation ratio.
Analysis of cell apoptosis
Primary osteoblasts pooled from different rats were plated in 6-well plates at a density of 2 × 10^5 cells per well and treated with various concentrations of Fn (MOIs of 0, 10, 50, and 100). Apoptosis was evaluated at 24 h using the Annexin V-FITC/PI Kit (Beyotime, Beijing, China). Cells were trypsinised, washed with PBS, stained with a propidium iodide-conjugated anti-Annexin V antibody for 15 min in darkness, and analyzed by flow cytometry using a FACScan (Becton Dickinson, Franklin Lakes, NJ, USA).
Single-cell RNA statistical analysis
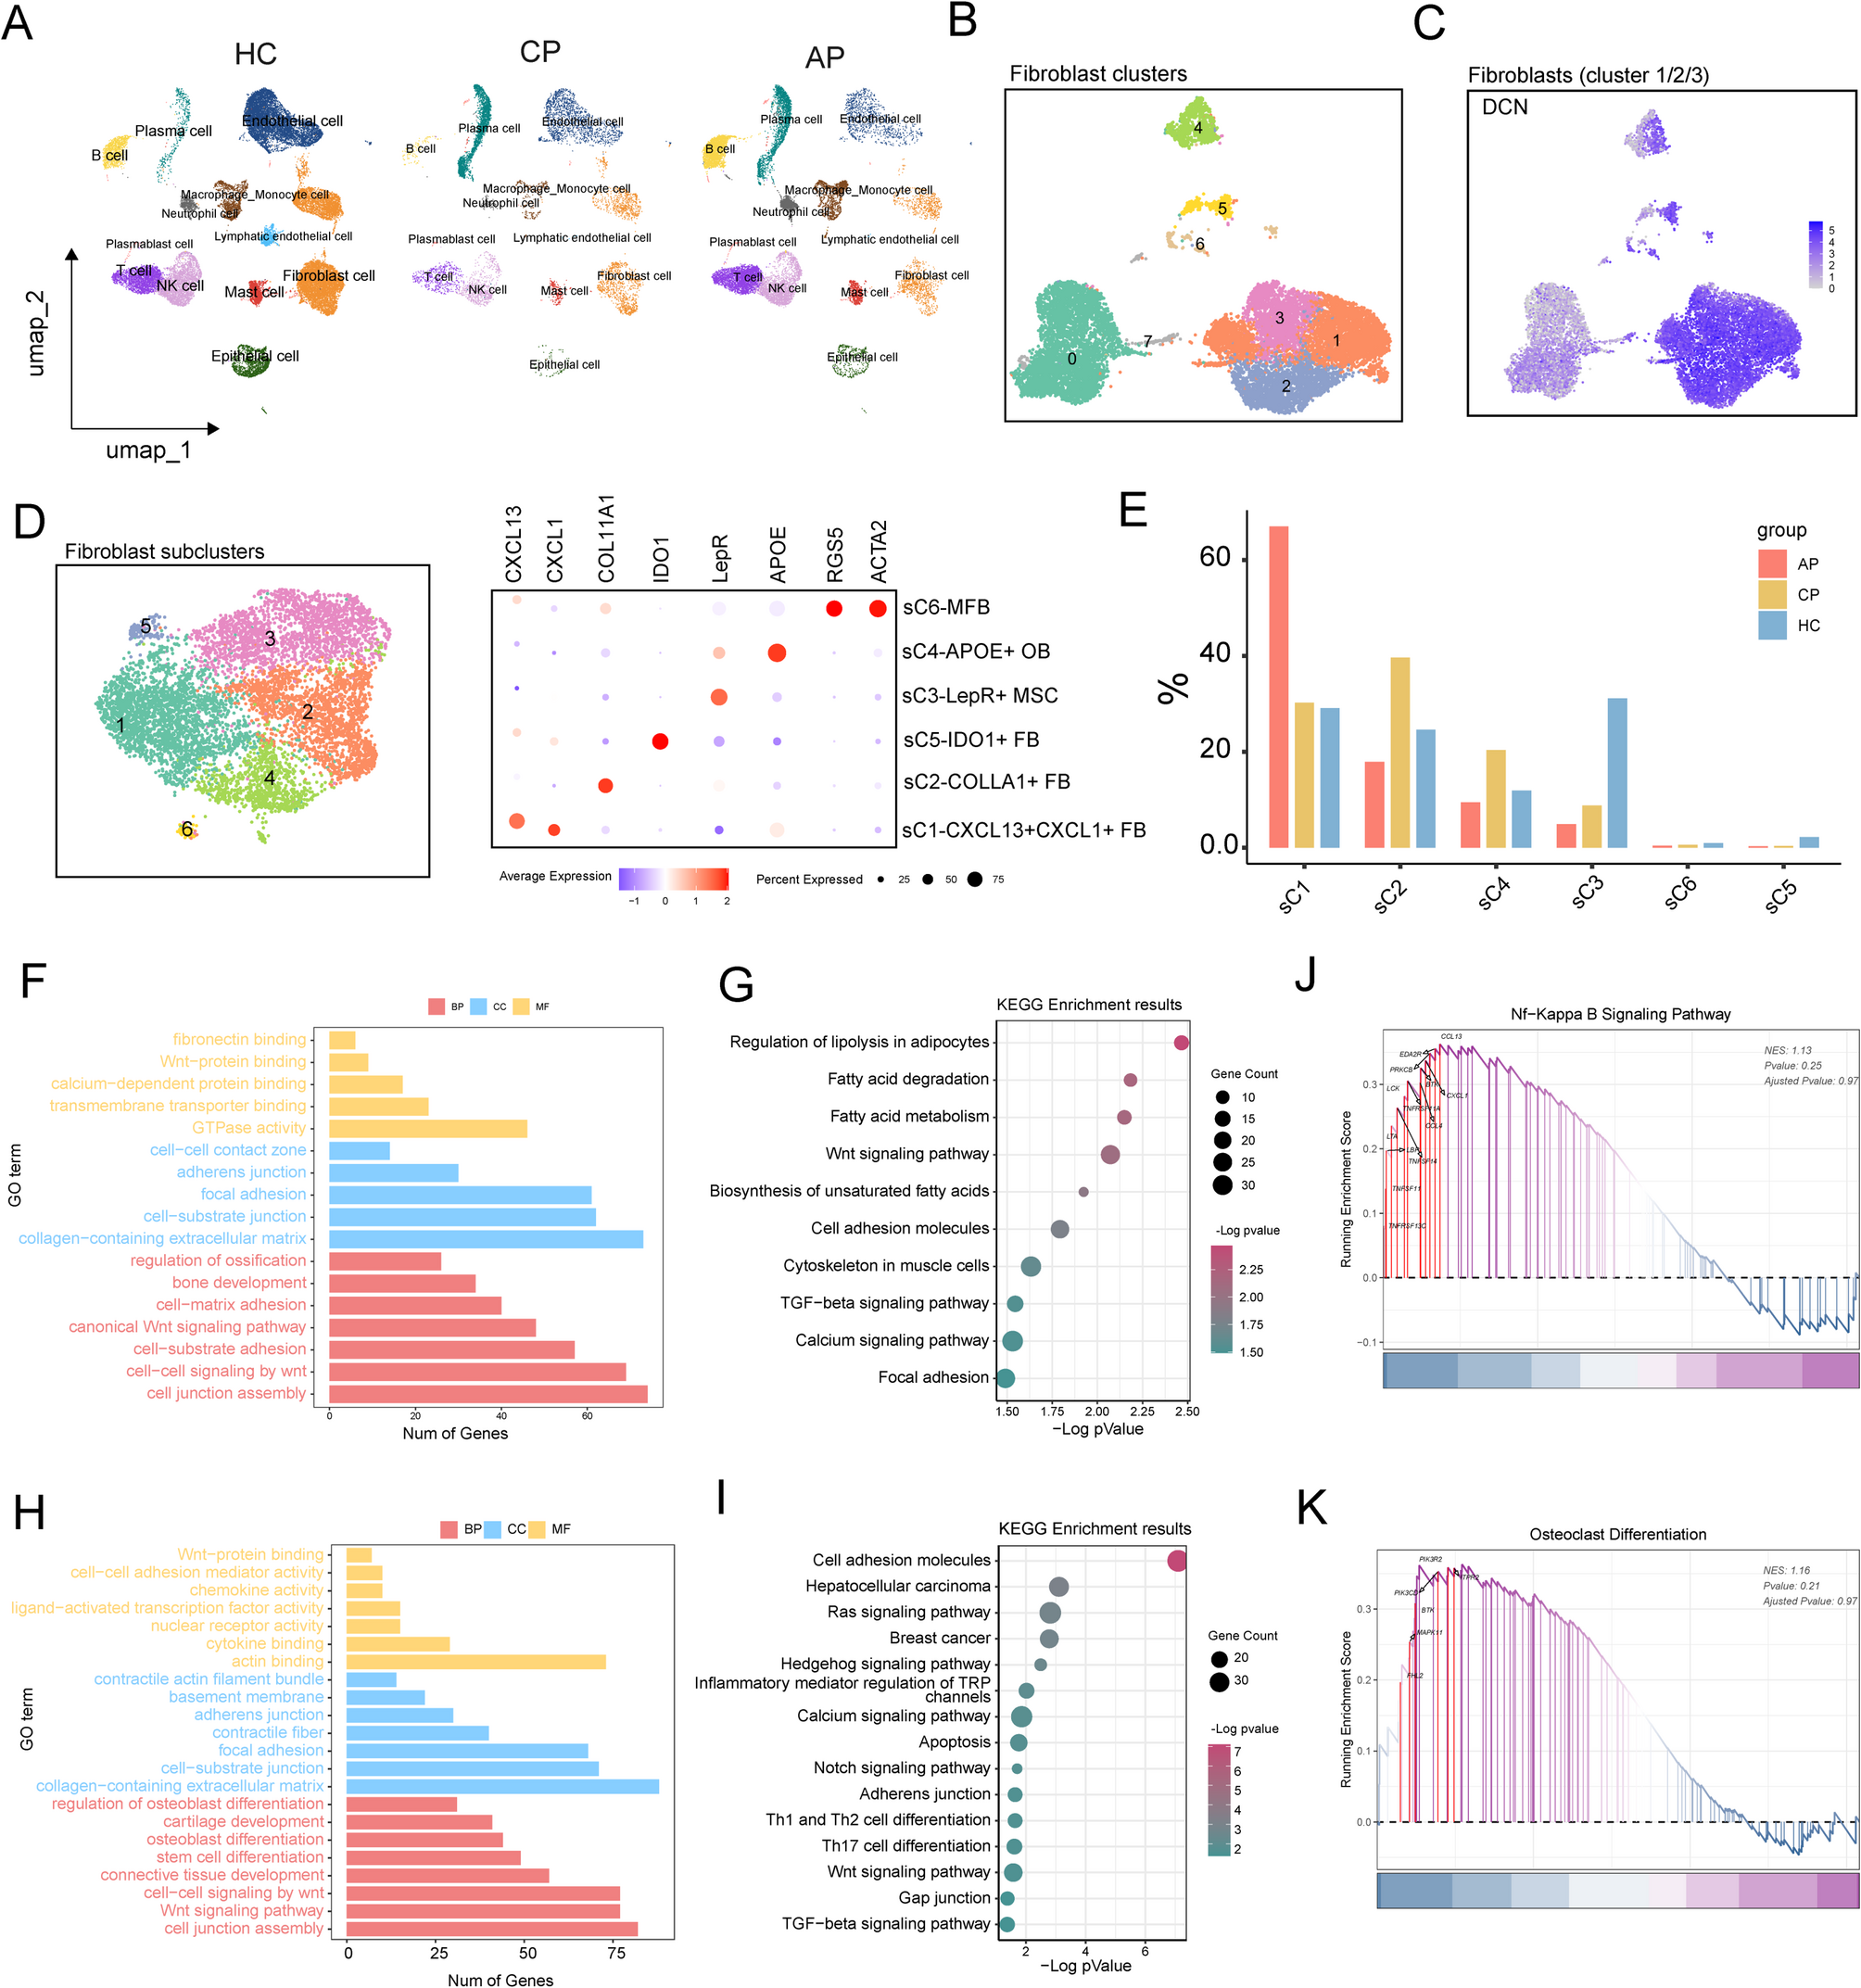
Single-cell sequencing data of human gingiva tissues was used from GEO database (GSE262668, https://www.ncbi.nlm.nih.gov/geo/query/acc.cgi?acc=GSE262668). The scRNA-seq data was mapped with the human genome (GRCh38) and was analyzed using the R package Seurat v5.0.1. Cells that met one of the following criteria were removed: having fewer than 500 unique molecular identifiers (UMIs), expressing fewer than 200 genes, or having more than 25% transcripts of mitochondrial genes. The R package DoubletFinder v2.0.4 was applied to predict and remove doublets. To remove the batch effect, we applied the batch effect correction analysis by the Harmony package (v1.2.0). Cell grouping was carried on “RunUMAP” function, and the clustering results were displayed using the DimPlot function. The “FindAllMarkers” function in the Seurat package was used to analyze the changes in gene expression between clusters, and the highly expressed genes within the cluster were shown in dotplot. Further functional enrichment analysis was performed on the results of differential gene expression analysis using the clusterProfiler v4.10.0 package.
Samtools (version 1.17) was employed to extract unaligned sequences from the GRCh38 reference genome. Microbial signal identification from these unaligned FASTQ data was performed using the SAHMI pipeline, followed by taxonomic classification against a standardized microbiome reference database via Kraken2 (version 2.1.3). To refine microbial sequence identification, a two-step denoising strategy was applied: (1) barcode-level filtering retained only taxonomic assignments supported by k-mer correlations detected in ≥ 3 barcodes with ≥ 1 unique k-mer, and (2) sample-level denoising was conducted using default parameters to eliminate spurious signals. Validated microbial sequences were subsequently derived by integrating k-mer correlation analyses with statistical filtering to ensure species-level resolution. Single-cell data were then analyzed to quantify bacterial species per cell, determine the prevalence of bacterial-positive cells across experimental groups, and identify highly recurrent taxa. Additionally, the relative abundance of Fn was calculated as the proportion of cells annotated to this species relative to all bacterial-positive cells.
RNA sequencing (RNA-seq) analysis
Primary osteoblasts pooled from different rats were stimulated with Fn (MO1 = 100) or Gbp (0.1 mg/mL) for 3, 7, 14, 21 days. Total RNA was extracted and were sent to Novogene Tech for subsequent sequencing. We applied fastp (0.23.4) with default parameter to quality control on raw data and the clean data was obtained. The clean data was aligned to the reference genome Rat_mRatBN7.2 using bowtie2 (2-2.5.1). Quantitative analysis was performed using featureCounts (subread 2.0.6) to obtain the expression profile for each sample. The differential analysis was performed using the limma (version 3.58.1) method. The differentially expressed genes were filtered out based on adjusted p value < 0.05 and foldchange > 1.5, and ploted in volcano and heatmap. Enrichment of GO and KEGG pathways was implemented using filtered differentially expressed genes, and the significant results were showed in bubble plots with p < 0.05. On the other hand, GSEA analysis was performed using all gene sets to compare the pathway changes between the experimental group and the control group, and the significant result (p < 0.05) was shown using GseaVis package (version 0.0.5). The ClusterGVis package (version 0.1.1) was used for time-series transcriptome gene expression pattern analysis, where mfuzz method was used for clustering and the results are visualized in heatmap. The interaction network of genes was generated on the String website (https://cn.string-db.org/) and visualized in Cytoscape (3.9.1) and the key subnets was extracted using MCODE modules.
Alkaline phosphatase (ALP) activity and staining
Primary osteoblasts pooled from different rats or MC3T3 cells, at a density of 5 × 10^4 cells per well, were plated onto 6-well plates and subsequently cultivated in osteogenic inductive medium. During this cultivation, the cells were stimulated with Fn suspensions at MO1 = 50 at intervals of 2 to 3 days. On days 3, 7 and 14, the cells were lysed using RIPA buffer for a duration of 30 min while kept on ice. Subsequently, the protein concentration was determined by following the protocol provided with a bicinchoninic acid protein assay kit (CWBIO, Jiangsu, China). At days 3, 7, and 14, the activity of alkaline phosphatase (ALP), recognized as an early osteogenic marker, was detected following the instructions of an ALP activity assay kit, and the absorbance at a wavelength of 520 nm was measured with a microplate reader.
For ALP staining, the BCIP/NBT alkaline phosphatase chromogenic kit from Beyotime, China, was utilized. At days 7 and 14, the medium was discarded, and the cells were thoroughly washed three times with PBS for 3 to 5 min each. Subsequently, the cells were fixed with 4% paraformaldehyde for 15 min and washed again three times with PBS. Next, 1 mL of the staining working solution was added to each well, and the cells were incubated at room temperature in the dark for 20 min. After removing the working solution, the cells were washed three times with double-distilled water and then visualized under a microscope.
Alizarin red staining and calcium quantification
On days 21, the cells were fixed with 4% paraformaldehyde for 10 min and subsequently washed three times with phosphate-buffered saline. To visualize extracellular matrix calcification nodules, the cells were stained with 2% (weight/volume) alizarin red solution at a pH of 4.3, sourced from Sigma-Aldrich. After rinsing with distilled water, the mineralized nodules were scanned within the six-well plates and examined under a light microscope.
For quantification of cellular matrix calcium content, After staining, dispense 500 µL of a 10% cetylpyridinium chloride solution (prepared by dissolving 1 gram in 10 mL of PBS) into each well. Incubate the wells on a shaker at room temperature for 30 min. Carefully aspirate the liquid from each well into appropriately labeled centrifuge tubes, taking care to avoid pipetting up and down to minimize disturbance. If sediment is present, centrifuge the tubes and aspirate the supernatant. Next, take a 96-well plate and add 100 µL of the aforementioned mineralized matrix solution to each well, repeating this process 3 to 5 times to ensure uniform coverage. Finally, use a microplate reader to measure the optical density (OD) value of each sample at a wavelength of 540 nm.
Quantitative real-time PCR (qRT-PCR)
Cellular RNA was extracted using TRIzol reagent (CWBIO, Beijing, China) and converted to cDNA via the HiFiScript cDNA Synthesis kit (Vazyme). Then, qRT-PCR was conducted with UltraSYBR Mixture (CWBIO) to quantify relative mRNA levels, normalized against β-actin using the 2^(-ΔΔct) method. The primer sequences used in this process are detailed in Table S1.
Western blot analysis
Cells were lysed on ice using a combination of RIPA lysis buffer (Solarbio) and a 1% phosphatase inhibitor (sourced from Boster, Wuhan, China) in a 100:1 ratio. Following sonication, the cells were centrifuged at 12,000 revolutions per minute for 15 min. The supernatant was discarded, and the protein concentration was then determined using a BCA protein detection kit sourced from KeyGEN BioTECH, Nanjing, China. An equal amount of protein (20 micrograms per lane) was subjected to electrophoresis on 10% SDS-PAGE gels and subsequently transferred onto PVDF membranes (Millipore, Billerica, MA, USA). Prior to antibody incubation, the PVDF membranes were soaked in 5% skimmed milk powder for one hour. The membranes were then incubated with primary antibodies (Table S2) overnight at 4 °C. Subsequently, the membranes were incubated with a horseradish peroxidase-conjugated secondary antibody (dilution 1:10,000; Proteintech) for one hour at room temperature. The immunoreactive bands were visualized using enhanced chemiluminescence reagents (Millipore) and scanned using an ultra-sensitive imager (Amersham Imager 600; GE Healthcare Life Sciences, Pittsburgh, PA, USA). The relative protein expressions of bands were provided by the analysis of ImageJ software, which used GAPDH or α-tubulin as the internal control.
Confocal laser scanning microscopy
To observe the cellular localization of Fn, 5 × 10⁴ primary osteoblasts pooled from different rats were plated onto a cell slide within a 12-well plate and allowed to incubate overnight. Subsequently, Fn was stained with CFDA and SE (CFSE) (MCE, Shanghai, China) for 30 min, followed by a PBS wash. The stained Fn was then cocultured with osteoblasts for an hour at 37 °C, and the cells were fixed using 4% Paraformaldehyde. The F-actin and nuclei of Osteoblasts were stained with phalloidin (Abcam, Cambridge, UK) and DAPI (Solarbio, Beijing, China), respectively. The immunofluorescence signals were observed using a confocal laser scanning microscope (Leica, Wetzlar, Germany).
Biotin pull-down assay
The biotin pull-down assay was conducted using the Biotinylated Protein Interaction Pull-Down Kit from Thermo Fisher Scientific (Waltham, USA), following the manufacturer’s instructions. Briefly, 1 × 10⁶ primary osteoblasts were grown in a 10 cm dish and labeled with 1 mM EZ-Link Sulfo-NHS-LC-Biotin at 4 °C for 4 h. Membrane proteins were extracted using a Plasma Membrane Protein Isolation and Cell Fractionation Kit from Invent Biotechnologies (Maryland, USA), while surface proteins of Fn were isolated with 1% Triton X-100 in PBS for 1 h at room temperature. Biotinylated OSTEOBLASTS surface proteins were incubated with streptavidin agarose resin for 4 h at 4 °C, followed by an overnight incubation with Fn surface membrane proteins at 4 °C. After washing, elution was performed using elution buffer, and the eluted proteins were analyzed by SDS-PAGE and silver staining. Protein bands were identified through liquid chromatography and mass spectrometry (LC/MS).
Recombinant protein production and purification
The signal peptide-free Gbp was cloned into the pET28a vector, incorporating an N-terminal His tag. E. coli BL21 cells harboring the Gbp plasmid were cultivated in Luria-Bertani (LB) medium and induced with 0.5 mM IPTG sourced from Aladdin (Shanghai, China). Subsequently, Gbp was purified employing a His-tag protein purification kit from Byotime (Shanghai, China), followed by desalting, filtration, and concentration using an Amicon® Ultra-30 centrifuge filter manufactured by Millipore (MA, USA).
His pull-down assay
To identify Gbp receptors on the primary osteoblasts membrane, a His pull-down assay was performed using the PolyHis-tagged Protein Interaction Pull-Down Kit from Thermo Fisher Scientific (Waltham, USA), according to the manufacturer’s instructions. Cobalt resin was incubated with His-Gbp for 1 h at 4 °C, washed with 10 mM imidazole, and incubated overnight at 4 °C with membrane proteins from osteoblasts. After washing, the resin was eluted with 290 mM imidazole and analyzed by LC/MS to identify osteoblasts membrane proteins.
Coimmunoprecipitation (Co-IP) assay
To perform co-immunoprecipitation (Co-IP) of ANXA2, the anti-ANXA2 antibody was incubated with primary osteoblasts membrane protein, in the presence or absence of recombinant His-Gbp, overnight at 4 °C. Rabbit IgG was used as a negative control. Following this, Protein A/G-magnetic beads (Santa, sc-2003) were added and incubated for an additional 2 h. The beads were then washed thoroughly and boiled in 40 µL of loading dye. The boiled samples were resolved by SDS-PAGE and immunoblotted using either anti-ANXA2 or anti-His antibody.
Gene silencing
In order to achieve better transfection efficiency, MC3T3 cells were used for ANXA2 silencing. MC3T3 cells seeded in 6-well plates and incubated in a culture medium with 10% FBS overnight. Thereafter, the medium was replaced with a fresh medium and siRNAs were transfected into cells via Lipofectamine 3000 transfection reagents (Invitrogen, Carlsbad, California, USA) in opti-MEM (Genom, China). siRNAs sequences: CCUCCAGAAAGUGUUCGAATT.
Statistical analysis
The cytology experiments were independently replicated three times using cells sourced from three distinct donors, and the results were presented as the mean ± standard deviation (SD). For statistical analysis, GraphPad Prism 9.5 software (MacKiev, Boston, MA, USA) was utilized. The data underwent one-way ANOVA, followed by Tukey’s post hoc test or Student’s t test for honest significant difference comparisons. Multiple t-tests were conducted to compare variations between groups across different time points. Statistical significance was deemed at a p-value < 0.05.


Comments (0)