
Remember me

In this article, Table 1 and Fig. 3 appeared incorrectly.
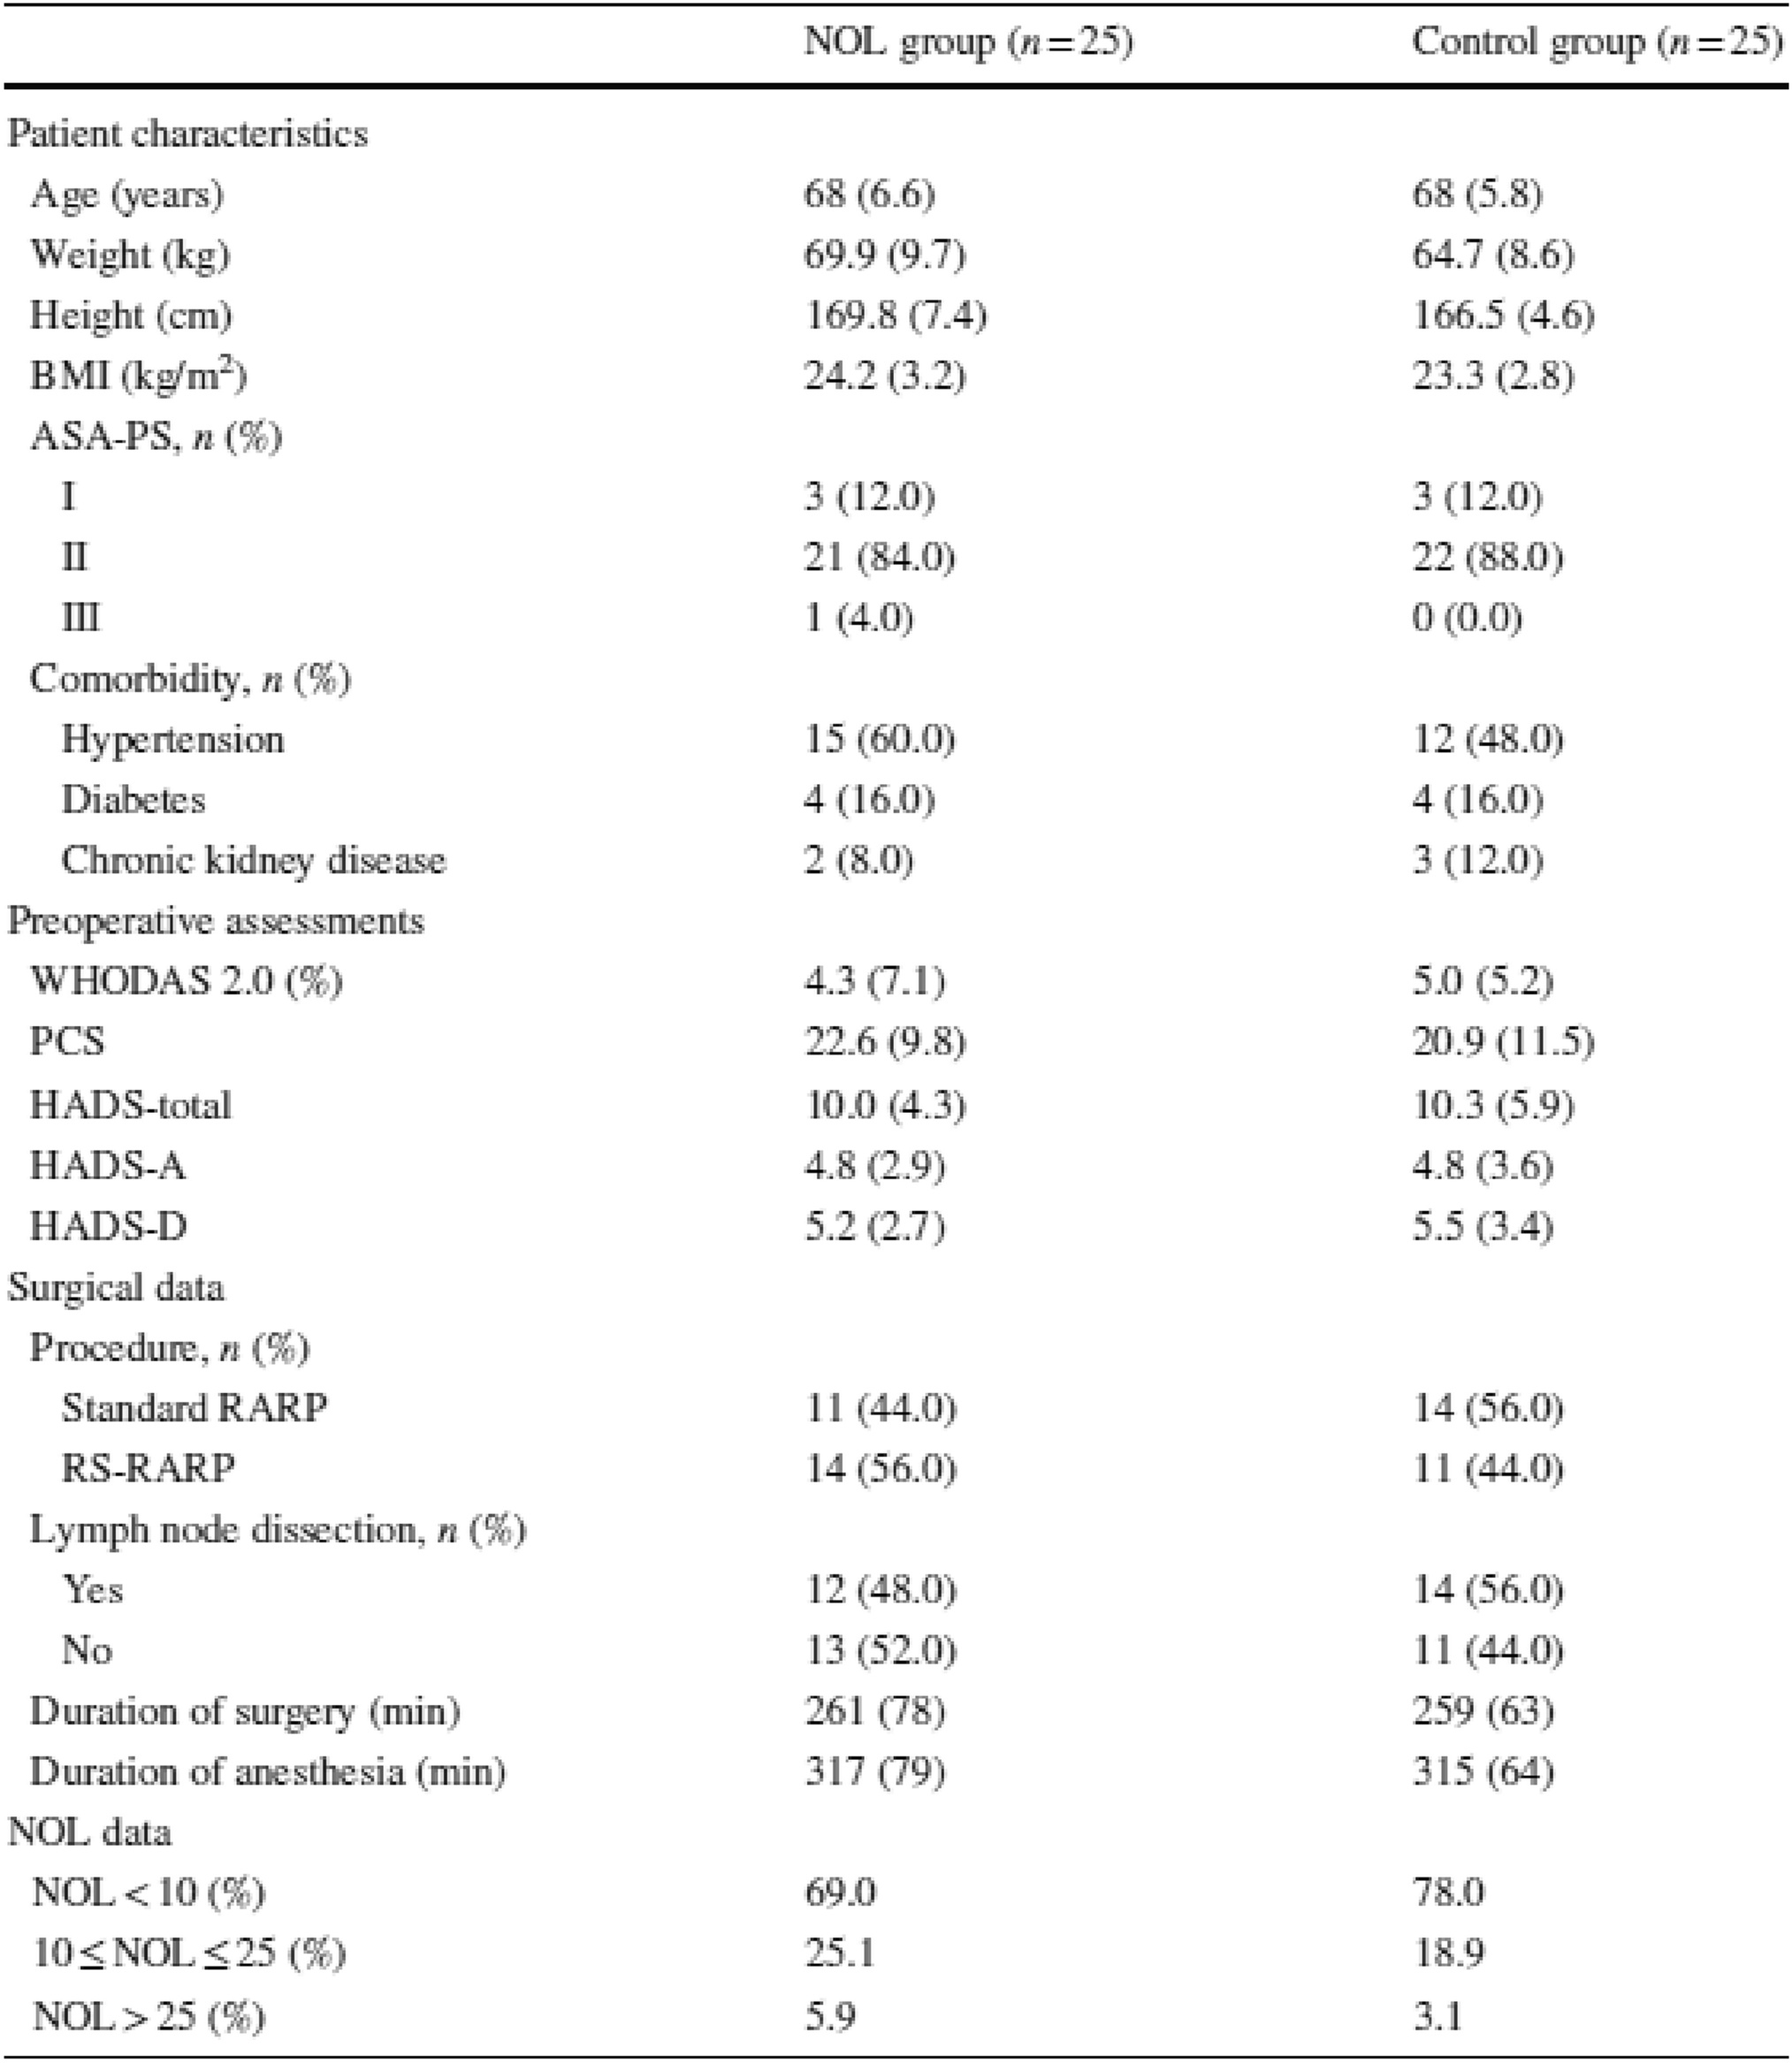
In Table 1, the data in the column ‘NOL group (n = 25)’ and row ‘NOL < 10 (%)’ was incorrectly given as ‘69.0’ but should read as ‘78.0’. The data in the column ‘Control group (n = 25)’ and row ‘NOL < 10 (%)’ was incorrectly given as ‘78.0’ but should read as ‘69.0’.
The data in the column ‘NOL group (n = 25)’ and row ‘10 ≤ NOL ≤ 25 (%)’ was incorrectly given as ‘25.1’ but should read as ‘18.9’. The data in the column ‘Control group (n = 25)’ and row ‘10 ≤ NOL ≤ 25 (%)’ was incorrectly given as ‘18.9’ but should read as ‘25.1’.
The data in the column ‘NOL group (n = 25)’ and row ‘ NOL > 25 (%)’ was incorrectly given as ‘5.9’ but should read as ‘3.1’. The data in the column ‘Control group (n = 25)’ and row ‘ NOL > 25 (%)’was incorrectly given as ‘3.1’ but should read as ‘5.9’.
Inside Fig. 3a and b, the word "remifentanyl" was incorrectly spelled, which should be "remifentanil";
In Fig. 3a, the line colors for control group was represented by a red line, but should be in blue line. Similarly, the NOL group was represented by a blue line, but should be in red line.
For completeness and transparency, the old incorrect and correct versions are displayed below. The original article has been corrected.
Table 1 Patient characteristics

Data are presented as means (standard deviations) or counts with proportions (occupancy)
ASA-PS American Society of Anesthesiologists physical status, HADS Hospital Anxiety and Depression Scale, IL-6 interleukin-6, NOL nociception level, PCS Pain Catastrophizing Scale, RARP robot-assisted radical prostatectomy, RS-RARP Retzius space-sparing robot-assisted radical prostatectomy, SD standard deviation, WHO-DAS2.0 World Health Organization Disability Assessment Schedule 2.0

Fig. 3 Trends in remifentanil flow rates. A The mean remifentanil flow rate in the NOL and control groups. B Spaghetti plot graph representing the change in remifentanil flow rate by individual patient in both groups. The vertical axis represents the mean remifentanil flow rate and the horizontal axis represents the operation time. The blue dotted line shows the change in remifentanil dose flow rate for each patient and the red line shows the mean. In the NOL group, a flow rate of 0.11 μg/kg/min was reached in all the cases. The total number of remifentanil flow rate changes (median [interquartile range]) in the NOL and control groups was 5 [3–7.5] and 5 [4–8] times, respectively. No significant differences were observed (P = 0.271). The number of times (median [interquartile range]) the remifentanil flow rate was increased according to increasing NOL (median [interquartile range]) was 1 [0–3] in the NOL group. NOL nociception level
Table 1 Patient characteristics
NOL group (n = 25)
Control group (n = 25)
Patient characteristics
Age (years)
68 (6.6)
68 (5.8)
Weight (kg)
69.9 (9.7)
64.7 (8.6)
Height (cm)
169.8 (7.4)
166.5 (4.6)
BMI (kg/m2)
24.2 (3.2)
23.3 (2.8)
ASA-PS, n (%)
I
3 (12.0)
3 (12.0)
II
21 (84.0)
22 (88.0)
III
1 (4.0)
0 (0.0)
Comorbidity, n (%)
Hypertension
15 (60.0)
12 (48.0)
Diabetes
4 (16.0)
4 (16.0)
Chronic kidney disease
2 (8.0)
3 (12.0)
Preoperative assessments
WHODAS 2.0 (%)
4.3 (7.1)
5.0 (5.2)
PCS
22.6 (9.8)
20.9 (11.5)
HADS-total
10.0 (4.3)
10.3 (5.9)
HADS-A
4.8 (2.9)
4.8 (3.6)
HADS-D
5.2 (2.7)
5.5 (3.4)
Surgical data
Procedure, n (%)
Standard RARP
11 (44.0)
14 (56.0)
RS-RARP
14 (56.0)
11 (44.0)
Lymph node dissection, n (%)
Yes
12 (48.0)
14 (56.0)
No
13 (52.0)
11 (44.0)
Duration of surgery (min)
261 (78)
259 (63)
Duration of anesthesia (min)
317 (79)
315 (64)
NOL data
NOL < 10 (%)
78.0
69.0
10 ≤ NOL ≤ 25 (%)
18.9
25.1
NOL > 25 (%)
3.1
5.9
Data are presented as means (standard deviations) or counts with proportions (occupancy) ASA-PS American Society of Anesthesiologists physical status, HADS Hospital Anxiety and Depression Scale, IL-6 interleukin-6, NOL nociception level, PCS Pain Catastrophizing Scale, RARP robot-assisted radical prostatectomy, RS-RARP Retzius space-sparing robot-assisted radical prostatectomy, SD standard deviation, WHO-DAS2.0 World Health Organization Disability Assessment Schedule 2.0
Fig. 3 Trends in remifentanil flow rates. A The mean remifentanil flow rate in the NOL and control groups. B Spaghetti plot graph representing the change in remifentanil flow rate by individual patient in both groups. The vertical axis represents the mean remifentanil flow rate and the horizontal axis represents the operation time. The blue dotted line shows the change in remifentanil dose flow rate for each patient and the red line shows the mean. In the NOL group, a flow rate of 0.11 μg/kg/min was reached in all the cases. The total number of remifentanil flow rate changes (median [interquartile range]) in the NOL and control groups was 5 [3–7.5] and 5 [4–8] times, respectively. No significant differences were observed (P = 0.271). The number of times (median [interquartile range]) the remifentanil flow rate was increased according to increasing NOL (median [interquartile range]) was 1 [0–3] in the NOL group. NOL nociception level
Comments (0)