
Remember me

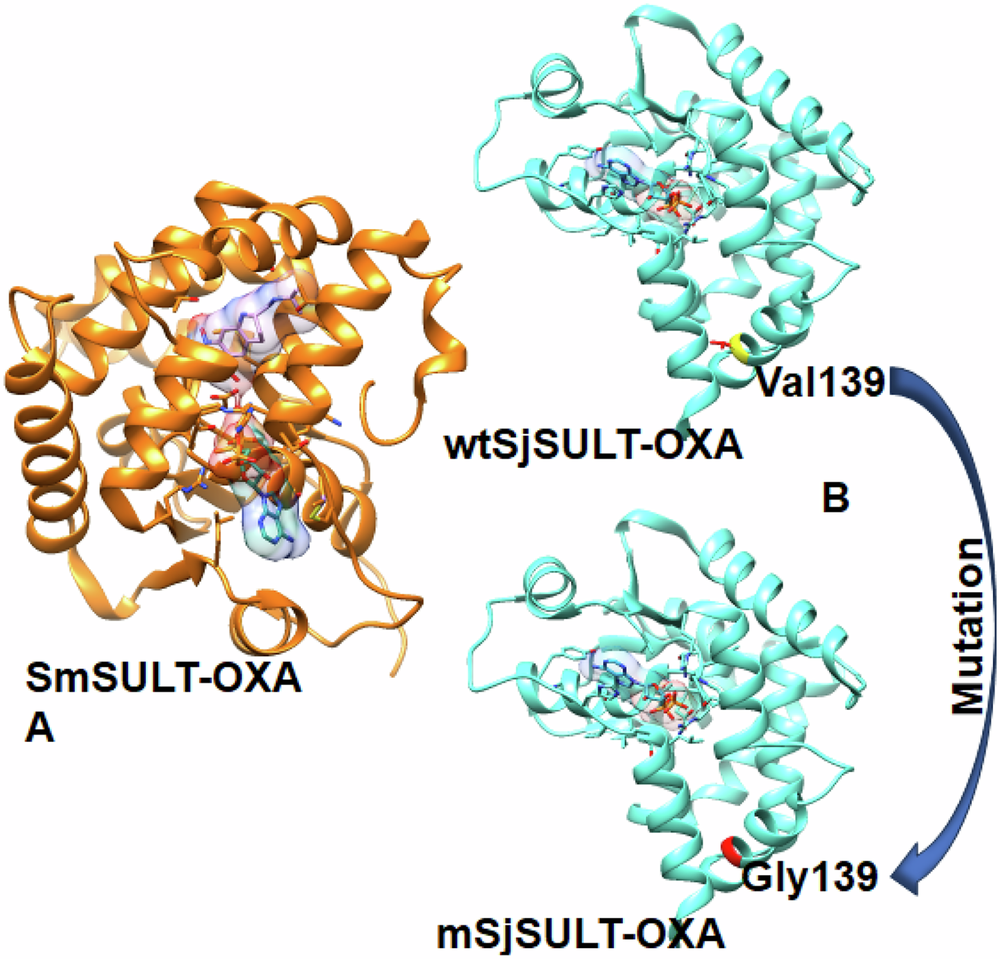

Figure 2 shows the detailed sequence alignment between SmSULT and SjSULT. This alignment is crucial for understanding their evolutionary relationship, structural conservation, divergence, and functional similarities [33]. Most importantly, it may help us understand the disparity in the efficacy of OXA in SjSULT and SmSULT, as Taylor et al. suggested that differences in active site residues in both proteins may be responsible for the observed disparity [19]. The overall sequence similarity is 59.29%. The intersecting residues in SmSULT/SjSULT are PRO16/PRO16, MET38/MET38, ILE42/ILE42, ASP91/ASP87, LEU92/LEU88, VAL127/VAL123, VAL128/VAL124, LEU147/LEU143, PHE153/PHE149, LEU236/LEU232, THR237/THR233, and LEU147/LEU143. The differing residues are PHE39/TYR34, ILE140/VAL136, GLY143/VAL139, ASP144/ASN140, THR157/ASN153, and MET233/VAL224 respectively. Subsequent analyses reveal the impact of these residues on the structural and conformational properties of the proteins, contributing to the observed disparity in the efficacy of OXA in both SULTs. The structural differences, particularly in the active site regions, may influence the binding affinity and stability of OXA, thereby affecting its overall efficacy.
Fig. 2
Sequence Alignment of SmSULT and SjSULT, Highlighting Conserved and Variable Regions. The asterisks represent conserved regions in the complete protein sequences of both S. japonicum and S. mansoni. Red indicates conserved binding site residues, yellow indicates non-conserved binding site residues, and green highlights other binding site residues that interact with OXA specific to each protein
Binding Free Energy Analysis of OXA-bound SmSULT and SjSULTWe estimated the binding free energy (BFE) values after a 300 ns MD simulation, carefully accounting for entropic effects. This detailed analysis validated the experimental findings, reinforcing that OXA is indeed more effective in SmSULT than in wtSjSULT. Specifically, the binding affinity of OXA to SmSULT was significantly higher, with a BFE value of −48.04 kcal/mol, compared to −22.84 kcal/mol for its binding to wtSjSULT. Moreover, when Val139 in wtSjSULT was mutated to Gly139, the efficacy of OXA in SjSULT was remarkably restored, as evidenced by the improved BFE value of −39.23 kcal/mol. This mutation appears to facilitate a binding affinity more akin to that observed in SmSULT, further substantiating the experimental results.
To gain deeper insights into the effect of the residue mutation, we investigated the contributions of various energy components to the endpoint BFE values of wtSjSULT-OXA and mSjSULT-OXA (Table 1). Despite the lower energy cost of solvation (∆G(GB)) of OXA in wtSjSULT (−61.61 kcal/mol), its binding free energy was less favourable than that of OXA in mSjSULT (150.59 kcal/mol). However, the high energy cost of solvation in the latter was compensated for by the dense electrostatic interaction of OXA in mSjSULT (−144.23 kcal/mol) compared to wtSjSULT, where electrostatic interactions were almost non-existent (77.06 kcal/mol). The electrostatic bond is regarded as the strongest bond between a ligand and the protein, and alterations in this interaction will affect the binding free energy of the ligand to the protein [34]. The van der Waals interaction was also quite significant in mSjSULT-OXA (−40.02 kcal/mol) compared to wtSjSULT (−33.6 kcal/mol) (Table 1).
Table 1 Energy Components (kcal/mol) for the Interaction of OXA with SmSULT, wtSjSULT, and mSjSULT ComplexesThe orientation of OXA within the binding sites of wtSjSULT and mSjSULT, as interpreted from the non-polar solvation energy (ΔGnp,sol), appears to have had a significant impact on the overall binding energy. Specifically, OXA in wtSjSULT showed the lowest non-polar solvation energy at −4.7 kcal/mol, implying that the ligand was more exposed to the surface, increasing its interaction with the polar environment. This orientation likely resulted in a lower total binding free energy compared to OXA in mSjSULT and SmSULT, which exhibited non-polar solvation energies of −5.47 and −5.9 kcal/mol, respectively.
The comparative analysis of the BFE graphs in Figs. 3, 4, and 5 reveals that the SmSULT-OXA complex exhibits the highest and most consistent binding affinity, followed by the mSjSULT-OXA complex. In contrast, the wtSjSULT-OXA complex shows notably weaker binding, characterised by fluctuating BFE values indicative of reduced stability and consistency. This suggests that its binding affinity is neither as robust nor as stable as that observed in the SmSULT complex. The mutation from Val139 to Gly139 in SjSULT significantly enhances the binding affinity and stability of the OXA complex, aligning its characteristics more closely with those of the SmSULT complex. The energetic profiles remained consistent across replica simulations, further validating the reproducibility of the observed binding trends (see Supplementary Table 1).
Fig. 3
Binding Free energy of SmSULT-OXA complex sampled over the entire Simulation Course
Fig. 4
Binding Free energy of wtSjSULT-OXA complex sampled over the entire Simulation Course
Fig. 5
Binding Free energy of mSjSULT-OXA complex sampled over the entire Simulation Course
Comprehensive Per-residue Energy Decomposition for OXA Binding in SmSULT, wtSjSULT and mSjSULTOur study meticulously analysed the energy distribution per residue within the binding sites, aiming to identify essential residues crucial for OXA binding across the three proteins. Initially, we compared the contributions of intersecting residues in SmSULT and wtSjSULT. Subsequently, our focus shifted to analysing residue-specific binding energies in both wild-type and mutant SjSULT proteins, providing deep insights into how mutations affect the stability and affinity of the protein-ligand complex.
Several residues emerged as significant contributors, each demonstrating substantial impacts with binding energies equal to or greater than −1 kcal/mol. In both SmSULT and wtSjSULT (Figs. 6A and 7A), PRO16 exhibited stronger binding energy (−0.87 kcal/mol) in SmSULT compared to wtSjSULT (−0.247 kcal/mol), indicating a more stable interaction. MET38 showed similar contributions in both proteins, with −1.399 kcal/mol in SmSULT and −1.413 kcal/mol in wtSjSULT. ILE42 (−1.823 kcal/mol) and ASP91 (−1.453 kcal/mol) displayed stronger stabilising effects in SmSULT compared to ILE42 (−1.252 kcal/mol) and ASP87 (0.434 kcal/mol) in wtSjSULT. VAL127 (−1.224 kcal/mol) and VAL128 (−2.182 kcal/mol) also demonstrated significantly higher binding energy contributions in SmSULT than VAL123 (−0.281 kcal/mol) and VAL124 (−0.752 kcal/mol) in wtSjSULT. LEU147 (−0.62 kcal/mol) and PHE153 (−0.639 kcal/mol) showed slightly stronger interactions in SmSULT compared to LEU143 (−0.338 kcal/mol) and PHE149 (−0.286 kcal/mol) in wtSjSULT. These findings underscore the critical roles of residues such as PRO16, ILE42, ASP91, VAL127, and VAL128 in enhancing the binding stability of the OXA complex in SmSULT compared to wtSjSULT, highlighting their importance in complex stability and explaining why SmSULT exhibits better binding free energy than wtSjSULT.
Fig. 6
Energy Contributions of the Binding Site Residues of SmSULT to the Binding Free Energy of OXA. A Total per-residue binding energy, B Van der Waals contribution, and C Electrostatic energy contribution
In comparing wild-type and mutant SjSULT, Franco et al. established the importance of ASN140 and ASN153 in OXA binding [19]. ASN140 exhibited a remarkable decrease in binding energy from −0.428 kcal/mol in wtSjSULT to −4.499 kcal/mol in mSjSULT-OXA, underscoring its pivotal role in maintaining complex stability, particularly in the mutant form. TYR39 also showed a significant decrease in binding energy, shifting from −0.958 kcal/mol in wtSjSULT to −2.46 kcal/mol in mSjSULT-OXA (Fig. 7A), emphasising its substantial contribution to complex stability. ASN153 demonstrated consistent contributions between the wild-type and mutant proteins. Additionally, GLY139 in the mutated form did not contribute positively to the total binding energy (0.359 kcal/mol), in contrast to VAL139 in the wild-type protein (−0.774 kcal/mol). This trend was similarly observed with ILE42 and LEU88, which significantly stabilised OXA in wtSjSULT with binding energies of −1.252 and −1.65 kcal/mol, respectively. However, due to the mutation in SjSULT, their contributions decreased to −0.702 and −1.028 kcal/mol, respectively, indicating notable structural or energetic changes resulting from the mutation. The electrostatic and Van der Waal energy contributions of each binding site residue to the total binding free energy are highlighted in Fig. 7B, C.
Fig. 7
Energy Contributions of the Binding Site Residues of wtSjSULT and mSjSULT to the Binding Free Energy of OXA. A Total per-residue binding energy, B Van der Waals contribution, and C Electrostatic energy contribution
Dynamic Time-resolved Interactions of OXA with SmSULT and SjSULT VariantsIn SmSULT-OXA, ASP 144 and ASP 91 form strong electrostatic interactions primarily through hydrogen bonds, which significantly contribute to the stability of the ligand (Fig. 8). Van der Waals interactions involve VAL 127, VAL 128, LEU 147, LEU 236, and LEU 240, which are crucial for maintaining a hydrophobic environment [35]. The consistent hydrogen bonding by ASP 144 and ASP 91 throughout all stages ensures strong electrostatic attraction. Similarly, persistent van der Waals interactions by valine and leucine residues provide additional stabilisation. These stable and extensive interactions contribute to the highly favourable binding free energy of SmSULT-OXA, reflected in its lowest ∆Gbind value among the complexes, indicating robust and efficient binding. In wtSjSULT-OXA, interactions are predominantly driven by van der Waals forces, which are generally weaker chemical interactions [36]. This suggests a less stable ligand configuration and less favourable binding free energy over time. Conversely, the mSjSULT-OXA complex displays stable and consistent interactions similar to SmSULT-OXA, leading to favourable binding energy. It exhibits a combination of van der Waals and moderate electrostatic interactions, characterised by persistent hydrogen bonds and van der Waals interactions, contributing to its stability.
Fig. 8
Molecular interaction maps showing the binding interactions of OXA with SmSULT, wtSjSULT, and mSjSULT at different time points (0, 100, 200, and 300 ns)
Focusing on key residues such as ASN 153 and ASN 140, these additional active site residues are believed to enhance catalytic efficiency in the two SjSULT variants [19]. Their equivalents in SmSULT, ASP 144 and THR 157, play significant roles as well. ASP 144 in SmSULT consistently formed a conventional hydrogen bond with the ligand from 100 ns onwards, indicating its crucial role in maintaining ligand stability and orientation in the active site (Fig. 8). This interaction also accounts for its strong electrostatic energy contribution (−50 kcal/mol) to the overall binding free energy (Fig. 6C). In contrast, post-simulation snapshots showed that ASN 140 in wtSjSULT did not visibly contribute to ligand stability in the binding site. However, in the mutant SjSULT, ASN 140 consistently formed a conventional hydrogen bond with the ligand throughout the simulation, stabilising the ligand. This interaction may explain why OXA in the mutant SjSULT regained its potency.
THR 157 in SmSULT-OXA participates in hydrogen bonding with the ligand at 100 and 300 ns, suggesting its dynamic role in ligand binding by providing initial stability through hydrogen bonding. Similarly, in mSjSULT-OXA, its ASN 153 counterpart forms multiple hydrogen bonds with the ligand at all time points, contributing to a stable binding configuration. The persistent hydrogen bonding by THR 157/ASN 153 indicates its importance in ensuring the ligand remains securely bound within the protein, allowing efficient catalysis in both SmSULT and mSjSULT. However, in wtSjSULT, the ASN 153 interaction was absent throughout the simulation, which may explain its weaker binding free energy. The mutation in SjSULT made the protein function almost exactly like SmSULT in terms of binding and catalytic efficiency.
In the same vein, the analysis of hydrogen bond interactions between wtSjSULT and mSjSULT with OXA reveals key differences that explain the increased potency of OXA in mSjSULT (Table 2). Notably, mSjSULT shows higher H-bond occupancy, such as ASN140-OD1 with LIGAND-N3 (9.35%) and ASN153-OD1 with LIGAND-O1 (9.31%), indicating more stable interactions. In contrast, wtSjSULT exhibits lower occupancy for ASN140-OD1 with LIGAND-N3 (2.60%) and ASN153-OD1 with LIGAND-O1 (2.57%), reflecting weaker binding. These enhanced bonds in mSjSULT likely reduce ligand dissociation, contributing to greater binding efficiency. The mutations in mSjSULT also refine the H-bond geometry, creating a more favourable binding environment for OXA, thus increasing its potency compared to wtSjSULT.
Table 2 Comparison of Hydrogen Bond Interactions between wtSjSULT and mSjSULT with OXA: Occupancy and Geometric ParametersStructural Dynamics and Conformational Changes of SmSULT and SjSULT Variants during MD Simulations: Insights from RMSF and PCA AnalysisThe RMSF analysis provides a measure of the flexibility of protein residues, reflecting how much each residue fluctuates around its average position during the simulation [37]. In the case of SmSULT, the binding of OXA leads to a significant reduction in RMSF values, indicating increased rigidity and stability of the protein. The average RMSF for SmSULT-OXA (0.83 Å) is notably lower than that of the unbound SmSULT (1.21 Å) (Table 3), suggesting that OXA binding effectively stabilises the enzyme, enhancing its functional efficacy.. This is visually supported by the RMSF plot, where the SmSULT-OXA complex consistently shows lower fluctuations across most residues compared to the unbound SmSULT, particularly in the regions around residues 40–60 and 250–260, where the majority of the enzyme’s active site residues are located (Fig. 9A).
Table 3 Mean RMSD, RoG, and RMSF values (Å) for the Global Protein Structure, Active Site Residues, and Ligand in SmSULT, SmSULT-OXA, wtSjSULT, wtSjSULT-OXA, and mSjSULT-OXA Complexes - Corresponding Replica-specific and Averaged Values from two Independent Simulations are Provided in Supplementary Table 2Fig. 9
Residual Fluctuation of the SULT Variants Across the Entire Simulation. A Fluctuations in SmSULT systems and B Fluctuations in SjSULT systems
In the case of wtSjSULT, the presence of OXA does not significantly stabilise the protein, as reflected by the RMSF values. The RMSF plot shows that wtSjSULT-OXA (1.98 Å) has fluctuations closely comparable to the unbound wtSjSULT (2.24 Å) (Table 3). Notably, significant fluctuations are observed in the regions around residues 100–150 and 250–270, which could explain its reduced effectiveness due to less stabilisation in these critical regions upon OXA binding (Fig. 9B). However, in the mSjSULT variant, the average RMSF decreases substantially, indicating a more rigid and stabilised structure upon OXA binding. The RMSF for mSjSULT-OXA (1.2 Å) is comparable to that observed for SmSULT-OXA, suggesting that these mutations have restored the ability of OXA to induce a conformational state similar to that in SmSULT (Table 3). The RMSF plot clearly shows this reduction in fluctuation, particularly in the same critical regions (100–150 and 250–270), where the mSjSULT-OXA complex maintains lower residue flexibility across most of the protein, closely mirroring the stabilisation pattern seen in SmSULT-OXA.
The PCA analysis further substantiates the observations drawn from the RMSF data, offering deeper insights into the conformational dynamics of the studied systems [38]. By projecting protein mobility into two principal components, PCA effectively captures the most significant patterns of structural variability. The first principal component (PC1) accounts for the greatest variance in the protein’s conformational states, while the second principal component (PC2) highlights the next most significant variance [39]. For SmSULT, the PCA plot illustrates a clear distinction between the unbound protein and the SmSULT-OXA complex. The unbound SmSULT displays greater dispersion across both PC1 and PC2, indicating a broader range of conformational states (Fig. 10). This suggests that, in the absence of OXA, SmSULT explores a more diverse set of structural configurations. In contrast, the SmSULT-OXA complex exhibits a more converged distribution in the PCA plot, signifying a more restricted conformational space when OXA is bound. This convergence is indicative of the stabilising effect that OXA has on SmSULT, corroborating the lower RMSF values observed in the RMSF analysis.
Fig. 10
Principal component analysis of A SmSULT systems and B SjSULT systems
In the case of SjSULT, the PCA analysis reveals a more nuanced pattern. The wtSjSULT system, particularly when bound to OXA, is predominantly dispersed along PC1, reflecting considerable conformational flexibility. This flexibility aligns with the higher RMSF values observed for wtSjSULT-OXA, suggesting that the binding of OXA does not significantly stabilise the wild-type protein structure. However, the mSjSULT-OXA complex shows a much more converged distribution in the PCA plot, similar to the pattern observed in SmSULT-OXA (Fig. 10). This convergence suggests that the mutations in mSjSULT lead to a more defined and less variable conformational landscape, effectively enhancing the structural stabilisation of the protein when OXA is bound.
The contrast between the PCA plots of wtSjSULT-OXA and mSjSULT-OXA is particularly telling. While the former displays greater dispersion, indicating a wide range of conformations, the latter shows a tight clustering of data points. This clustering reflects a more restricted and stabilised conformational space, similar to that observed in SmSULT-OXA. The parallels between the PCA plots of SmSULT-OXA and mSjSULT-OXA suggest that the mutations in mSjSULT have restored the ability of OXA to induce a conformational state that is more effective for its function. Moreover, the convergence observed in the PCA plot of mSjSULT-OXA, particularly along PC1, indicates that this component is highly correlated with the most significant conformational shifts in the protein. These shifts are likely crucial for the protein’s functional dynamics, as they represent the primary mode of motion that influences the protein’s interactions and overall activity [40]. While PC2 captures an important, though secondary, mode of motion, PC1 remains the primary focus in PCA because of its ability to reveal the dominant patterns of protein movement that are most relevant to the protein’s function and its interaction with OXA [40].
Assessing the Stability of Protein Configurations in SmSULT and SjSULT with OXA BindingThe RMSD analysis offers valuable insights into the stability and conformational changes of protein structures under various conditions [41]. The RMSD trajectory plot reveals that the binding of OXA to SmSULT leads to a significant stabilisation of the protein’s conformation throughout the MD simulation. This is evidenced by the consistently horizontal trajectory of the SmSULT-OXA complex, which remains below that of the unbound SmSULT (Fig. 11A). The lower average RMSD for SmSULT-OXA, at 2.69 Å, indicates minimal deviation from the initial structure, signifying a more stable conformation upon OXA binding. In contrast, the RMSD trajectory of unbound wtSjSULT (Apo) displays a marked upward deviation, with an average RMSD of 7.79 Å, reflecting significant conformational changes and instability (Table 3).
Fig. 11
Pictorial representation of the RMSD Patterns in A The global structures of Schistosoma SULT systems. B Superposition of wtSjSULT (green), wtSjSULT-OXA (blue), and mSjSULT-OXA (magenta) at 100 ns. C RMSD patterns of the active sites, and D Ligand stability in the Schistosoma SULT systems
When comparing the RMSD trajectories of the bound SjSULT variants, mSjSULT-OXA demonstrates a more consistent and stable structure relative to wtSjSULT-OXA, which exhibits irregular fluctuations. The average RMSD for wtSjSULT-OXA is 3.24 Å, whereas mSjSULT-OXA has a slightly higher average RMSD of 4.48 Å (Table 3). Although mSjSULT-OXA has a marginally higher RMSD than wtSjSULT-OXA, the plot shows that the binding of OXA to mSjSULT modulates its stability throughout the simulation. In contrast, wtSjSULT-OXA, despite its lower RMSD, displays erratic stability trends, indicating that mSjSULT-OXA achieves a more controlled and consistent structural conformation upon OXA binding (Fig. 11A, B).
Examining the active site RMSD reveals patterns consistent with the global RMSD observations (Fig. 11C). For SmSULT and SmSULT-OXA, the active site RMSD trajectories reflect the overall stability, with average values of 2.1 and 1.29 Å, respectively (Table 3). These values further confirm the stabilising effect of OXA on the SmSULT active site. Conversely, a more complex pattern emerges in the SjSULT systems. The active site RMSD for wtSjSULT-OXA remains higher compared to other variants, with an average RMSD of 2.69 Å. In contrast, mSjSULT-OXA exhibits a lower average active site RMSD of 2.26 Å, suggesting that the mutations in mSjSULT enhance the stability of the active site upon OXA binding compared to wtSjSULT (Table 3).
Finally, the ligand RMSD plot illustrates the dynamics of OXA within the binding pocket of each protein variant. The trajectory for mSjSULT-OXA shows the lowest ligand RMSD, averaging 1.05 Å, despite some observed movement. This suggests that OXA undergoes conformational adjustments within the mSjSULT binding pocket to optimise its interactions with the active site residues (Table 3). In contrast, the ligand RMSD for SmSULT-OXA and wtSjSULT-OXA reveals similar patterns, with average values of 1.75 and 1.6 Å, respectively. These findings indicate that mSjSULT-OXA exhibits the most stable OXA binding, implying that the mutations introduced in mSjSULT enhance the protein’s binding affinity and overall stability, making it the most effective binder among the SjSULT variants. Results from duplicate simulations revealed consistent trends across all systems. Replica-specific plots for global RMSD, active site dynamics, ligand stability, and residue fluctuations are provided in Supplementary Figs S1–S5.
Assessment of Protein and Ligand Stability through Radius of Gyration AnalysisThe Radius of Gyration (RoG) analysis provides valuable insights into the structural changes induced by ligand binding across different SULT variants. The average RoG values reveal key differences in how OXA affects the compactness and stability of the protein structures. For SmSULT, the RoG decreases from 18.44–18.14 Å upon OXA binding, indicating a more compact and stable conformation when the ligand is present (Table 3). This reduction in RoG signifies enhanced structural stability, aligning with the observed increase in efficacy for SmSULT in the presence of OXA. The compact conformation likely facilitates more effective ligand interaction, contributing to the higher efficacy of OXA in SmSULT (Fig. 12A). In contrast, SjSULT shows a different pattern. The average RoG values are 18.54 Å for unbound SjSULT, 19.35 Å for wtSjSULT-OXA, and 18.56 Å for mSjSULT-OXA. The slight increase in wtSjSULT-OXA compared to unbound SjSULT suggests that OXA binding induces less efficient stabilization in wtSjSULT-OXA, which may explain why OXA is less effective in this variant.
Fig. 12
Pictorial representation of the RoG patterns in A The global structures of Schistosoma SULT systems, B Their active sites, and C Ligand stability in the Schistosoma SULT systems
The active site RoG values further validate the impact of OXA binding on protein structure. For SmSULT, the active site RoG decreases from 9.59–9.31 Å upon binding with OXA, demonstrating a notable increase in the compactness and stability of the active site. This reduction in RoG reflects a more stable and compact conformation, aligning with the enhanced efficacy observed for SmSULT. On the other hand, for wtSjSULT-OXA and mSjSULT-OXA, the active site RoG values are 9.81 and 9.42 Å, respectively (Table 3). The higher active site RoG for wtSjSULT-OXA suggests that OXA does not stabilize the active site as effectively in this variant compared to SmSULT, contributing to its lower efficacy. However, mSjSULT-OXA displays an active site RoG of 9.42 Å, which mirrors the trend seen in SmSULT-OXA, indicating that OXA induces a similar increase in compactness and stability. These findings highlight that while OXA binding enhances stability and compactness at the active site in both SmSULT and mSjSULT, it does so more effectively in SmSULT compared to wtSjSULT (Fig. 12B).
The Radius of Gyration (RoG) trajectories for the ligands across the different systems display similar patterns, with overlapping plots making detailed movement analysis challenging (Fig. 12C). The average ligand RoG values are 3.93 Å for SmSULT-OXA, 3.86 Å for wtSjSULT-OXA, and 3.98 Å for mSjSULT-OXA. Interestingly, despite the lower efficacy observed with wtSjSULT, the ligand appears to be more stable in this system compared to the others, as indicated by these average values (Table 3).
OXA-induced Perturbation of Protein Hydrophobicity and Solvent AccessibilityThe overall changes in OXA binding and residue interactions were quantified using Solvent Accessible Surface Area (SASA). This metric assesses the mobility and exposure of residues to the solvent, providing insights into the perturbations within different protein and ligand regions [42]. High SASA values indicate decreased hydrophobicity, while lower SASA values suggest increased hydrophobicity [42]. Specifically, SmSULT-OXA’s trajectory indicates that OXA performs optimally in a hydrophobic setting, aligning with enhanced functional activity. In the SjSULT systems, mSjSULT-OXA shows the lowest SASA, indicating it is the most hydrophobic and thus exhibits superior functional activity compared to wtSjSULT-OXA. The estimated average SASA values for the global structure are 11917 ± 301.43 for SmSULT and 11264.27A2 for SmSULT-OXA (Table 4). In comparison, wtSjSULT, wtSjSULT-OXA, and mSjSULT-OXA have average SASA values of 14040.23A2, 14218.15A2, and 13475.09A2, respectively. This increase in hydrophobicity likely accounts for the potency of OXA in both proteins.
Table 4 Mean SASA Values (A2) for the Global Protein Structure, Active Site Residues, and Ligand in SmSULT, SmSULT-OXA, wtSjSULT, wtSjSULT-OXA, and mSjSULT-OXA ComplexesAnalysis of the active site residue SASA reveals that SmSULT-OXA exhibits the lowest value, consistent with the global structure SASA results, followed by mSjSULT-OXA. This suggests that OXA binding promotes a shift of surface-exposed residues towards the hydrophobic core, enhancing optimal binding interactions (Fig. 13B). The ligand SASA for SmSULT and SmSULT-OXA shows a consistent, horizontal movement throughout the MD simulation, suggesting that OXA remains well-buried within the binding pocket of both SmSULT and SmSULT-OXA (Fig. 13C). Conversely, the wtSjSULT-OXA plot shows noticeable irregularities, indicating less stable binding of OXA in the pocket compared to SmSULT-OXA, where OXA is more consistently accommodated (Fig. 13C).
Fig. 13
Pictorial representation of the Solvent Accessible Surface Area patterns in A The global structures of Schistosoma SULT systems, B Their active sites, and C Ligand stability in the Schistosoma SULT systems
Comments (0)