Tissue sample collection
The study received ethical approval from the Medical Ethical Committees of the Hospital of Stomatology at Wuhan University. Informed consent was obtained from all participants. Specimens of human oral mucosa, odontogenic keratocysts, and ameloblastomas were collected from patients at the Department of Oral & Maxillofacial Head and Neck Oncology, School and Hospital of Stomatology, Wuhan University. Each diagnosis was validated by two independent pathologists, including a board-certified oral and maxillofacial pathologist, in accordance with the 2017 WHO classification guidelines for odontogenic tumors. Recurrence was defined as development of a tumor at the same site after surgery, with pathological results confirming it as AM. The detailed clinicopathological characteristics of the AM patients are presented in Table S1, and those of the OKC patients are shown in Table S2.
RNA extraction and RT-qPCR analysis
Total RNA was carefully extracted from three oral mucosa clinical samples and three AM clinical samples using the RNeasy Mini Kit (Qiagen, Carlsbad, CA, USA). To ensure the integrity and purity of the RNA, rigorous quality control measures were implemented. The extracted total RNA samples (2 μg per sample) were then converted into complementary DNA (cDNA) using the PrimeScript First-strand cDNA Synthesis Kit (Takara, Otsu, Japan) following the manufacturer’s protocol. One-fifth of the synthesized cDNA was subsequently utilized for quantitative polymerase chain reaction (qPCR) analysis. qPCR was performed using FastStart Universal SYBR Green Master Mix (Roche, Basel, Switzerland) on a 7900HT Fast Real-Time PCR System (Applied Biosystems, Carlsbad, CA, USA). This system offers high sensitivity and reproducibility for accurate quantification of gene expression. The primer sequences utilized for the RT‒qPCRs were specifically designed to target the genes of interest. These primer sequences were selected on the basis of their specificity, efficiency, and ability to generate reliable results. The sequences of primers used were as follows: MKI67: 5′-ACGCCTGGTTACTATCAAAAGG-3′ and 5′-CAGACCCATTTACTTGTGTTGGA-3′, PCNA: 5′-CCTGCTGGGATATTAGCTCCA-3′ and 5′-CAGCGGTAGGTGTCGAAGC-3′, CD44: 5′-CTGCCGCTTTGCAGGTGTA-3′ and 5′-CATTGTGGGCAAGGTGCTATT-3′, CD133: 5′-AGTCGGAAACTGGCAGATAGC-3′ and 5′-GGTAGTGTTGTACTGGGCCAAT-3′, LAMB3: 5′-GCAGCCTCACAACTACTACAG-3′ and 5′-CCAGGTCTTACCGAAGTCTGA-3′, LAMC2: 5′- GACAAACTGGTAATGGATTCCGC-3′ and 5′- TTCTCTGTGCCGGTAAAAGCC-3′. GAPDH served as the internal control for normalization to accurately quantify gene expression. Target mRNA levels were assessed using CT values with GAPDH as the reference gene. The 2−∆∆CT method was applied to calculate relative mRNA quantities, providing reliable fold-change estimates.
Cell culture and treatments
Human oral keratinocytes (HOKs) were obtained from the American Type Culture Collection (ATCC). The immortalized hTERT+-AM cell line was graciously provided by Professor Qian Tao of Sun Yat-sen Memorial Hospital. These hTERT+ -AM cells were maintained in DMEM (Thermo Fisher Scientific, #C11995500BT) supplemented with 10% fetal bovine serum (FBS) (Thermo Fisher Scientific, #A3160801) and 1% penicillin/streptomycin (Thermo Fisher Scientific, #15140-122). All the cell cultures were incubated at 37 °C in a humidified atmosphere with 5% CO2 until experiments were performed.
To suppress PD-L1 expression in hTERT+-AM cells, 50 µmol/L metformin was used. To inhibit the PI3K-AKT-mTOR signaling pathway, a combination of 50 mmol/L LY294002 and 100 nmol/L rapamycin (both sourced from EMD Calbiochem-Millipore, USA) was utilized.
Single-cell RNA sequencing
Following surgical resection, two fresh tissue samples were preserved in tissue preservation solution (2–8 °C) (Singleron Biotechnologies, China) and quickly transported to the laboratory. Single-cell suspensions were prepared and loaded onto microfluidic chips. Using the GEXSCOPE® Single-Cell RNA Library Kit (Singleron Biotechnologies), scRNA-seq libraries were constructed. Each library, prepared at 4 nmol/L, was pooled and sequenced on the Illumina HiSeq X platform with 150 bp paired-end reads.
ScRNA-seq data quality control, processing, and cell type identification
We utilized Seurat (v4.0.0) in R (v4.0.2) to process each sample’s gene-barcode expression matrix. Quality control measures included filtering out cells with fewer than 200 or more than 9 000 expressed genes, cells with over 10% mitochondrial gene content, and those with more than 7% hemoglobin gene content. Ribosomal and mitochondrial genes were subsequently removed from the dataset. To ensure data integrity, potential doublets were identified and excluded using DoubletFinder (v2.0.3).
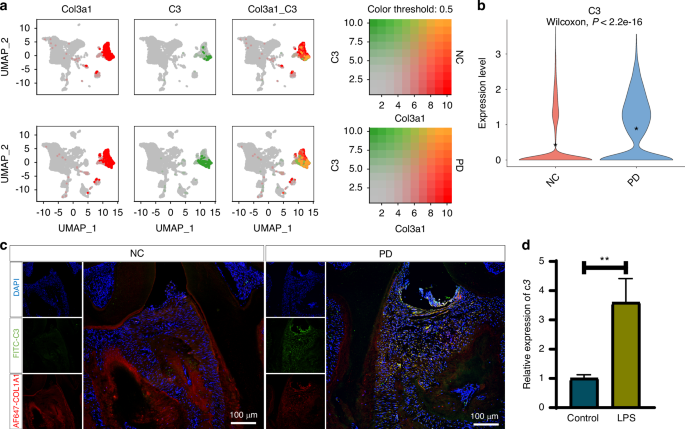
Normalization and variance stabilization of the data were performed using sctransform (v0.3.2). Following these preprocessing steps, the samples were integrated into a single Seurat object using the IntegrateData function. For dimensionality reduction, we applied principal component analysis (PCA) to the top 3 000 highly variable genes (HVGs). The ElbowPlot function was employed to identify the principal components that significantly contributed to the variance in the data. Cell type assignment was performed via Seurat’s FindAllMarkers function to identify differentially expressed genes (DEGs) with default parameters. Cluster annotation was conducted on the basis of established marker genes from the literature. Specifically, we identified the following cell types: tumor epithelial cells expressing the markers KRT14, KRT15, KRT19, and KRT6A; myeloid cells characterized by CD74, HLA-DRA, HLA-DB1, and LYZ expression; endothelial cells characterized by PECAM1, ENG, and VWF expression; and fibroblasts characterized by COL3A1, COL1A1, COL1A2, and LUM expression.
Western blotting
Western blotting was conducted following established protocols.53,54 In brief, proteins were extracted from both tissues and cultured cells. The total protein concentration was measured via a BCA Assay Kit. Proteins were then separated by SDS‒polyacrylamide gel electrophoresis and transferred onto polyvinylidene fluoride (PVDF) membranes. The membranes were blocked with 5% nonfat milk for 1 h at room temperature. Following blocking, the membranes were incubated overnight at 4 °C with primary antibodies. The next day, the membranes were incubated with HRP-conjugated secondary antibodies for 1 h at room temperature. Detection was carried out using enhanced chemiluminescence (ECL) Western blotting detection reagents. The following primary antibodies were utilized in the study: anti-human PD-L1 (Cell Signaling Technology, #13684), anti-human CD44 (Cell Signaling Technology, #3570), anti-human/mouse CD133 (Proteintech, #18470-1-AP), anti-human/mouse ALDH1A1 (Proteintech, #60171-1-Ig), anti-human LAMC2 (Abcam, #ab210959), anti-human LAMB3 (Abcam, #ab97765), anti-human PDPN (Cell Signaling Technology, #9047S), and anti-human/mouse GAPDH (ABclonal, #AC002).
Immunohistochemistry and H&E staining
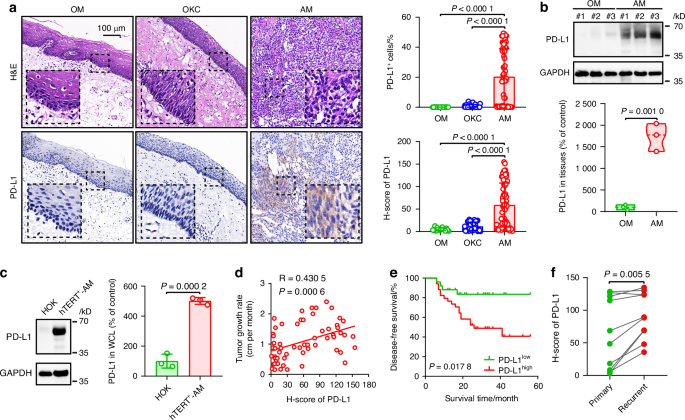
Detailed immunohistochemistry (IHC) procedures were performed as previously described.55 In summary, the OM, OKC, and AM tissues were fixed in 4% paraformaldehyde overnight, embedded in paraffin, and sectioned into 4 µm thick slices. Immunohistochemical staining was carried out according to the protocols specified in the immunohistochemical kit. Chromogenic development was achieved via the use of diaminobenzidine (DAB), and counterstaining was performed with hematoxylin.
High-resolution images of the stained slides were captured via a Panoramic Scanner (3DHISTECH) equipped with background subtraction capabilities. Both cellular and membranous staining, along with cell counts in selected regions across all tissue microarray (TMA) tissues, were analyzed via CaseViewer software (3DHISTECH) and NDP.view2 software (Hamamatsu). To quantify the staining, a histoscore (H score) for each tissue core was calculated. This score was determined by assessing the percentage of cells exhibiting positive staining according to the following formula: (percentage of strong positive staining) × 3 + (percentage of moderate positive staining) × 2 + (percentage of weak po'sitive staining) × 1). The following primary antibodies were used: anti-PD-L1 (Cell Signaling Technology, #29122), anti-Ki-67 (ZSGB-BIO, #ZM-0166), anti-PCNA (Cell Signaling Technology, #2586), anti-CD44 (Cell Signaling Technology, #3570), anti-CD133 (Proteintech, #18470-1-AP), anti-ALDH1A1 (Proteintech, #60171-1-Ig), anti-LAMC2 (Abcam, #ab210959), anti-LAMB3 (Abcam, #ab97765), and anti-PDPN (Cell Signaling Technology, #9047S).
For the H&E assay, paraffin-embedded tumor sections were stained with an H&E kit (Beyotime, # C0105S) following the manufacturer’s instructions.
Cell immunofluorescence
Immunofluorescence staining was conducted on fixed cells to visualize the expression of specific proteins. The cells were initially permeabilized with 0.3% Triton X-100 and subsequently blocked in bovine serum albumin (BSA) buffer for 1 h. After blocking, the cells were incubated overnight at 4 °C with primary antibodies. This was followed by a 1 h incubation with fluorophore-conjugated secondary antibodies. Nuclear counterstaining was performed using DAPI. The primary antibodies used in this study were as follows: anti-PD-L1 (Cell Signaling Technology, #29122), anti-Ki-67 (ZSGB-BIO, #ZM-0166), anti-PCNA (Cell Signaling Technology, #2586), anti-CD44 (Cell Signaling Technology, #3570), anti-CD133 (Proteintech, #18470-1-AP), anti-LAMC2 (Abcam, #ab210959), and anti-LAMB3 (Abcam, #ab97765).
Multiplex immunohistochemistry (mIHC)
mIHC was performed using a multiplex IHC kit according to the manufacturer’s protocols (Akoya Bioscience, #NEL801001KT).56 Briefly, after deparaffinization and rehydration, antigen retrieval was conducted using EDTA buffer and microwave heating. Following a 10 min block in blocking solution at room temperature, primary antibodies were incubated at 37 °C for 1 h. Secondary antibodies were incubated at room temperature for 10 min, followed by incubation with Opal fluorophores for 10 min. This process of antigen retrieval, blocking, and incubation with primary and secondary antibodies and Opal fluorophores was repeated, followed by DAPI staining for nuclear visualization. The slides were then scanned with a PerkinElmer Vectra Polaris (PerkinElmer, #Vectra3). The primary antibodies used in this study included the following: anti-PD-L1 (Cell Signaling Technology, #29122), anti-pan cytokeratin (Pan-CK) (Cell Signaling Technology, #4545), anti-Ki-67 (ZSGB-BIO, #ZM-0166), anti-PCNA (Cell Signaling Technology, #2586), anti-CD44 (Cell Signaling Technology, #3570), anti-CD133 (Proteintech, #18470-1-AP), anti-LAMC2 (Abcam, #ab210959), and anti-PDPN (Cell Signaling Technology, #9047S).
Colony formation assay
To assess clonogenicity, the cells were plated in 6-well plates at a density of 2 000 cells per well and cultured in DMEM supplemented with 10% fetal bovine serum (FBS) for 10 to 14 days. After incubation, the colonies were fixed with 4% paraformaldehyde for 15 min and subsequently stained with 0.4% crystal violet for 15 min. After thorough washing with phosphate-buffered saline (PBS) and air drying, colonies comprising more than 50 cells were counted and photographed using a microscope.
Generation of PD-L1 knockout and overexpression cell linesPD-L1 knockout in hTERT+ -AM cells
Stable knockout of PD-L1 in hTERT+-AM cells was achieved via the CRISPR/Cas9 genome editing system in accordance with established protocols. For targeted disruption of the PD-L1 gene, a guide RNA specific to human PD-L1 (target sequence: TACCGCTGCATGATCAGCTA) was cloned and inserted into the lentiviral vector pLentiCRISPRv2. This construct was obtained from GenScript. The hTERT+-AM cells were transduced with the recombinant lentivirus carrying the PD-L1 guide RNA. After transduction, PD-L1 knockout cells were selected using puromycin to ensure the establishment of a cell line with stable gene knockout.
PD-L1 overexpression in hTERT+-AM cells
To generate hTERT+ -AM cells stably overexpressing PD-L1, they were infected with lentiviruses engineered to overexpress PD-L1. The recombinant lentivirus was procured from GeneChem (Shanghai, China). Following the manufacturer’s protocol, the cells were incubated with the lentivirus for 8 h. After this incubation period, the medium was replaced with DMEM supplemented with 10% fetal bovine serum (FBS; Thermo Fisher Scientific, #A3160801) and 1% penicillin/streptomycin.
Fluorescence was observed 48 h post infection, indicating successful transduction. To establish stable overexpression, the cells were then cultured in the presence of 4 µg/mL puromycin for 7 days.
Validation of PD-L1 expression
The efficacy of PD-L1 knockout and overexpression in transfected hTERT+-AM cells was confirmed via Western blot analysis.
Wound-healing assay
To assess the migratory ability of hTERT+-AM cells, a wound-healing assay was performed. hTERT+-AM cells were seeded in 6-well plates and cultured until they reached approximately 70%–80% confluence. A straight scratch, or “wound,” was created in the cell monolayer using a sterile pipette tip. Next, the cells were rinsed to remove debris and then cultured in serum-free DMEM. Images of the wound area were captured at designated time points to monitor and quantify the rate of cell migration into the wound space. The images were analyzed to determine the extent of wound closure over time, providing insights into the migratory behavior of the cells.
Spheroid formation assay
To evaluate the sphere formation capacity of hTERT+-AM cells, a spheroid formation assay was conducted. Briefly, hTERT+-AM cells were seeded into ultralow attachment 6-well plates (Corning) at a density of 5 × 10⁴ cells per well. These specialized plates prevent cell adhesion to the surface, facilitating spheroid formation. The cells were cultured in serum-free medium specifically formulated to support spheroid growth. This medium was supplemented with 2% B27 supplement (Life Technologies), 100 U/mL penicillin, 100 U/mL streptomycin, 20 ng/mL human epidermal growth factor (EGF; PeproTech), and 10 ng/mL human basic fibroblast growth factor (bFGF; PeproTech). After two weeks of culture, the spheroids were observed and counted using an inverted microscope. This allowed for the assessment of spheroid formation efficiency and morphology.
Invasion assay
To assess the invasive potential of hTERT+-AM cells, an invasion assay was performed using 24-well plates with 8 µm pore inserts. The hTERT+-AM cells were starved in serum-free DMEM for one day. The cells were resuspended in serum-free DMEM at a concentration of 5 × 10⁵ cells per mL. Each well was coated with 100 µL of 1.6 mg/mL Matrigel. A 100 µL cell suspension was added to the upper chamber, and 500 µL DMEM with 10% FBS was added to the lower chamber. After 16 h, the cells were fixed with paraformaldehyde for 15 min and stained with 0.4% crystal violet for 20 min at room temperature. After washing with PBS, the cells on the upper surface of the insert were removed with a cotton swab, and the remaining cells were air-dried, photographed, and counted under a microscope.
EdU assay
An EdU (5-ethynyl-2’-deoxyuridine) assay was performed to assess the proliferation of hTERT+-AM cells. hTERT+-AM cells were seeded in 96-well plates at a density of 5 000 cells per well in 100 µL of medium. Following overnight culture to allow cell attachment, the cells were treated with 2× EdU working solution (20 µmol/L), which was prewarmed to 37 °C. The cells were incubated for 2 h, fixed with 4% paraformaldehyde for 15 min, washed, and permeabilized with 0.3% Triton X-100 for 15 min. After washing, the cells were incubated with Click reaction solution and then stained with Hoechst 33342 for 10 min at room temperature in the dark. Fluorescence images of the stained cells were captured via a fluorescence microscope.
Organoid culture
To establish and maintain organoids from ameloblastoma (AM) tissues, the following protocol was followed.40,57 The AM tissues were minced and incubated at 37 °C with collagenase type IV (Stemcell, #07909) for 50 min. After digestion, 10 mL of DMEM/F12 (Thermo Fisher Scientific, #C11330500BT) was added to dilute the collagenase. The resulting suspension was filtered through a 100 µm sieve (Falcon, #352360) and centrifuged at 1 000 r/min for 5 min. The cell pellet was then resuspended in BioCoat MATRIGEL MATRIX (Corning, #354234) mixed with organoid medium at a 1:1 ratio. This mixture was plated onto 24-well culture plates and incubated at 37 °C for 30 min. Organoids were maintained in custom-formulated media composed of DMEM/F12 (Thermo Fisher Scientific, #C11330500BT), 1× B27 supplement (Thermo Fisher Scientific, #12587010), 1.25 mmol/L N-acetyl-L-cysteine (Sigma, #A7250), 10 mmol/L nicotinamide (Sigma, #N0636), 50 ng/mL human EGF (PeproTech, #AF-100-15), 500 nmol/L A83-01 (PeproTech, #9094360), 10 ng/mL human FGF10 (PeproTech, #100-26-5), 5 ng/mL human FGF2 (Sino Biological Inc., #10014-HNAE), 1 μmol/L prostaglandin E2 (MCE, #HY-101952), 0.3 μmol/L CHIR 99021 (Sigma, #SML1046), 1 μmol/L forskolin (Abcam, #ab120058), 50 ng/mL R-spondin (R&D Systems, #3266-RS), and 25 ng/mL Noggin (PeproTech). To facilitate organoid outgrowth, 10 μmol/L of the ROCK inhibitor Y-27632 (TargetMol, #T1725) was added to the medium after the first week. The medium was changed every 48–72 h, and the organoids were passaged every 1–2 weeks.
Statistical analysis
Statistical analyses were performed via GraphPad Prism, version 9.3.1 (GraphPad Software). Differences between two groups were analyzed via Student’s t test. Survival curves were analyzed via the log-rank test. Pearson’s correlation coefficient was used for correlation analysis. A P value of less than 0.05 was considered to indicate statistical significance.


Comments (0)