Animals
Heterozygous C3ar1 gene knockout mice (background: C57BL/6N) were purchased from Jiangsu Jicui Yaokang Biotechnology Co., Ltd. All animal work was conducted in accordance with the guidelines of the Laboratory Animal Ethics Committee, School of Basic Medical Sciences, Jilin University, China, and adhered to ethical standards as per license number 2024317. The mice were provided with unrestricted access to food and water and housed in a specific pathogen-free (SPF) environment, maintained at a stable temperature of 22 °C and 55% ± 10% humidity, under a consistent 12-h light-dark cycle. To confirm the C3aR deficiency at the genetic level, genotyping PCR was performed using a common forward primer in combination with either a WT-specific reverse primer or a KO-specific primer, following the manufacturer’s instructions for the Red Taq PCR Ready Mix (Sigma-Aldrich).
Establishment of periodontitis model
Eighteen mice, aged 8-10 weeks, were utilized for ligation experiments, including C3ar1 heterozygous mice (n = 6), C3ar1 homozygous mice (n = 6), and wild-type (WT) mice (n = 6). All mice were first anesthetized by intraperitoneal injection of a mixture containing 66.7 mg/kg ketamine and 6.7 mg/kg xylazine. Subsequently, the maxillary second molar on the left side was ligated with 4-0 polyamide silk, with knots placed on the buccal side between the first and second molars. The contralateral side was left without a ligature to serve as a control. The ligature was maintained for 14 days.
Micro-CT
After 8 days ligation, all mice were sacrificed by cervical dislocation. The maxillae were harvested and fixed in 4% paraformaldehyde solution for 24 h. The maxillae were then collected and scanned using a micro-CT system (µCT50, Scanco Medical AG, Bassersdorf, Switzerland). The scanning parameters were as follows: 70 kVp, 200 µA, voxel size 34.4 µm, and exposure time 270 ms. Three-dimensional images were reconstructed and analyzed using the manufacturer’s software (SkyScan). The distance between the cementoenamel junction (CEJ) and the apex of the alveolar bone crest (ABC) was measured at six anatomical sites of the maxillary molars, as indicated by the red line segment in Fig. 1a. Additionally, bone-related parameters, including bone volume fraction (bone volume/tissue volume, BV/TV, %), were measured to investigate the variations in bone mass and mineralization between the maxillary first and second molars using the software (SkyScan).
Hematoxylin-Eosin (HE) staining
After being scanned by micro-CT, the samples were decalcified in 10% EDTA for one month, with the EDTA solution refreshed weekly. The samples were then dehydrated through a graded series of ethanol, embedded in paraffin, and sectioned at a thickness of 4 µm. Subsequently, the sections were routinely dewaxed and rehydrated. Hematoxylin staining solution was applied for 5 min, followed by rinsing with distilled water to remove excess stain. Differentiation was carried out using a differentiation solution for 60 s, with two rinses in tap water, each lasting 3 min. Eosin staining solution was then applied for 2 min, followed by rinsing with distilled water to remove excess stain. The sections were rapidly dehydrated through a graded series of ethanol, cleared in xylene, and mounted with neutral balsam (Solarbio, G1120). Next, neutrophils were distinguished based on their segmented nuclei and rod-shaped morphology, followed by counting and quantitative analysis.
Masson’s trichrome staining
The slides were dewaxed and rehydrated. They were then immersed in a mordant staining solution and incubated in a water bath at 60 °C for 1 h, followed by rinsing under running water for 10 min. Celestine Blue solution was applied to the sections and stained for 3 min. The slides were gently washed twice with distilled water, each wash lasting 15 s. Mayer’s hematoxylin staining solution was used for dropwise staining for 2 to 3 min, followed by washing with distilled water twice, each wash lasting 10 to 15 s. The sections were counterstained with acid alcohol differentiation solution, followed by rinsing under running water for 10 min. Ponceau-acid fuchsin solution was applied dropwise for 10 min, followed by two washes with distilled water, each wash lasting 10 to 15 s. The slides were then incubated with phosphoric acid solution for approximately 10 min, followed by the addition of aniline blue staining solution for 2 min. This was followed by a wash with a weak acid solution and an additional 2-min incubation. The slides were subsequently dehydrated with 95% ethanol and absolute ethanol, cleared in xylene, and sealed with resin (Solarbio, G1346).
Immunohistochemical staining
Paraffin sections were deparaffinized and rehydrated, followed by rinsing under running water and soaking in PBS three times for 3 min each. After removing PBS from the sections, an appropriate amount of immunohistochemical antigen retrieval solution (pepsin method, Maixin, DIG-3009) was applied and incubated at 37 °C for 30 min, followed by soaking in PBS three times for 3 min each. The immunostaining procedure was carried out according to the standard steps of the UltraSensitive™ SP (Rabbit) IHC Kit (Maixin, KIT-9706). Specifically, after removing the PBS solution, endogenous peroxidase blocker was added and incubated at room temperature for 10 min, followed by soaking in PBS three times for 3 min each. After removing PBS, a non-specific staining blocker was added and incubated at room temperature for 10 min. The non-specific staining blocker was then removed, and TNF-α (17590-1-AP, Proteintech, 1:200) and IL-1β (YT2322, Immunoway, 1:200) antibodies were applied, followed by incubation overnight at 4 °C. The next day, the sections were equilibrated at room temperature for 30 min, followed by soaking in PBS three times for 3 min each. After removing PBS, biotin-labeled goat anti-mouse IgG polymer was added and incubated at room temperature for 10 min. The sections were then soaked in PBS three times for 3 min each. Streptavidin-biotin complex-peroxidase was added and incubated at room temperature for 10 min, followed by soaking in PBS three times for 3 min each. After removing PBS, DAB chromogen solution (Maixin, DAB-0031) was added and incubated at room temperature for 5 min, followed by rinsing under running water, counterstaining with hematoxylin, dehydrating through a graded series of ethanol, clearing in xylene, and mounting with neutral balsam. The staining intensity of each section was calculated by measuring the optical density using Image Pro Plus.
Single cell RNA-seq data analysis
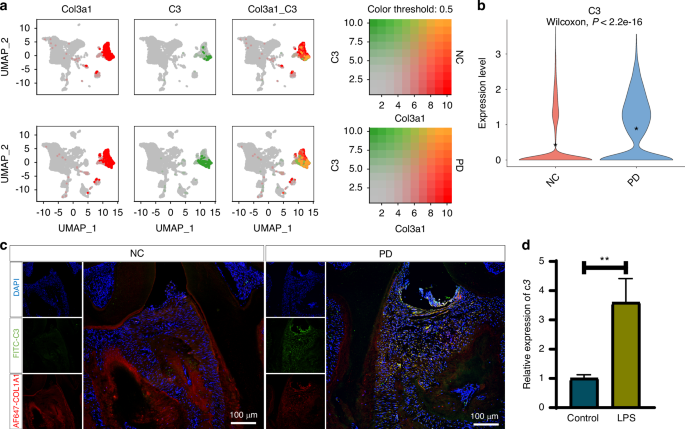
The sequencing data for periodontal tissues from healthy and periodontitis mice were acquired from the GSE22863549 and GSE184938 datasets. Similarly, sequencing data for periodontal tissues from healthy individuals and periodontitis patients were sourced from the GSE16424150 dataset. Initially, single-cell sequencing data from both healthy and periodontitis tissues were harmonized using the Harmony algorithm. Subsequently, cell clusters were annotated based on the significant differential expression of genes across the clusters, identified using the FindAllMarkers function in the Seurat package.
Immunofluorescent staining
Paraffin sections were routinely deparaffinized to water, followed by antigen retrieval using a pepsin antigen retrieval solution. Non-specific antigen blocking was performed by incubating the sections with 10% FCR blocker in 5% BSA for 60 min at room temperature. Subsequently, tissue sections were incubated with primary antibodies: anti-mouse F4/80-AF647 (151003, Biolegend, 1:100), CD86 (13395-1-AP, Proteintech, 1:200), COL1A1 (66288-1-Ig, Proteintech, 1:200) and C3 (66157-1-Ig, Proteintech, 1:200) at 4 °C overnight (approximately 12 h). After washing with PBS to remove excess unbound antibodies, the sections were stained with FITC-labeled goat anti-rabbit and AF647-labeled goat anti-mouse antibodies at room temperature for 2 h. Following antigen labeling, nuclei were stained with DAPI (C0065, Solarbio). Multispectral images of the stained slides were captured using confocal microscopy, providing detailed visualization of the antigens and nuclei.
Flow cytometry
RAW264.7 cell lines were cultured in vitro. When the cells reached approximately 90% confluence, they were scraped and seeded at a density of 5×10⁴ cells per cm² in a 6-well cell culture plate. Upon reaching 70% confluence, the cells were divided into two groups: a control group and a C3a-treated group. The control group was cultured in normal medium, while the C3a-treated group was cultured in complete medium containing 200 ng/mL of C3a for 24 h. After incubation, the cells were scraped, and residual medium was removed by washing with PBS. Non-specific antigens were blocked by incubating the cells in a 5% BSA solution containing 10% FCR blocker at 4 °C for 10 min. The cells were then incubated with anti-mouse PE-CD68 (105007, Biolegend, 1:100) at 4 °C for 30 min. Unbound antibodies were washed away with flow cytometry buffer. The cells were fixed with 2% paraformaldehyde at room temperature for 10 min, followed by washing with flow cytometry buffer to remove the fixative. The cells were then resuspended in 200 µL of flow cytometry buffer, stained with DAPI, and immediately subjected to flow cytometry analysis. The FACS analysis was performed using a MACSQuant Analyzer 16 flow cytometer (Miltenyi Biotec), and data were analyzed using FlowJo software.
Histological section TRAP staining
Paraffin sections were deparaffinized to water using standard protocols, followed by fixation with pre-cooled TRAP fixative for 1 min. After rinsing with distilled water, TRAP incubation solution was added and the sections were incubated at 37 °C for 1 h. The sections were then rinsed with distilled water and counterstained with hematoxylin for 2 min, followed by bluing in tap water for 10 min. After a final rinse with distilled water, the sections were mounted using an aqueous mounting medium.
Osteoclast extraction, culture and TRAP staining
Bone marrow cells were isolated from the tibiae and femurs of 5-week-old mice (C57BL/6N background) and cultured overnight in α-MEM supplemented with 1% penicillin-streptomycin and 10% fetal bovine serum. Bone marrow-derived macrophages (BMMs) were obtained by culturing the non-adherent cells from the bone marrow cell culture with 30 ng/mL M-CSF for 3 days. To obtain pre-osteoclasts (pOCs) and mature osteoclasts, BMMs were further cultured for 4 days in α-MEM complete medium containing 100 ng/mL RANKL and 30 ng/mL M-CSF. In cell treatment experiments, BMMs seeded in 48-well plates were cultured with or without C3a in the presence of RANKL and M-CSF for 3 days. The cultured cells were then fixed with 4% paraformaldehyde (PFA) for 15 min and permeabilized with 0.1% Triton X-100. TRAP staining of the cultured cells was performed using a tartrate-resistant acid phosphatase (Sigma-Aldrich, MO, USA) according to the manufacturer’s instructions. Osteoclast formation was assessed with a light microscope, and TRAP-positive cells containing more than three nuclei were counted as osteoclasts.
Enzyme-linked immunosorbent assay (ELISA)
Blood samples were collected from both healthy and periodontitis mice. The samples were allowed to clot at room temperature for 20 min and then centrifuged at 2 500 revolutions per minute (rpm) for 20 min to separate the serum. The levels of C3a in these samples were quantitatively determined strictly following the instructions provided with the mouse C3a ELISA kits (ml001969, Enzyme-linked Biotechnology).
Briefly, blank wells, standard wells, and sample wells were set up. Diluted serum samples (1:5) were added to the sample wells (50 µL per well) and incubated at 37 °C for 30 min. Unbound samples were washed away, and then 50 µL of enzyme-labeled reagent was added to each well and incubated at 37 °C for another 30 min. After washing away the unbound enzyme-labeled reagent, 100 µL of chromogenic substrate solution was added to each well and incubated at 37 °C in the dark for 30 min. Subsequently, 50 µL of stop solution was added to each well. The optical density (OD) of each well was measured at 450 nm using a microplate reader within 15 min. A standard curve was plotted from the OD values of the standard wells, and the concentrations of C3a in the sample wells were calculated accordingly.
RNA extraction and RT-qPCR analysis
Following a 1-day incubation period with or without the P.g LPS, total RNAs of Raw264.7 cells were extracted using the DNAiso Plus reagent (Takara, Chaoyang, Beijing, China). cDNAs were amplified using a reverse transcription kit (YEASEN, Pudong, Shanghai, China). Quantitative reverse transcription PCR (RT-qPCR) was conducted employing Hieff qPCR SYBR Green Master Mix (YEASEN) on a Biorad Real-Time Fluorescent Quantitative PCR Detection System. The expression levels of genes in each sample were normalized to ACTB mRNA as an internal control, and the 2−ΔΔCt method was applied for data analysis. Experiments were repeated at least three times.
Western blot analysis
Proteins were extracted with PIPA lysis buffer, and lysates were used to run electrophoresis on a 10% Tris-Glycine PAGE Gel before being transferred onto polyvinylidene fluoride (PVDF) membrane. The membrane underwent was block with TBST buffer plus BSA, incubated with primary antibodies at 4 °C overnight. Primary antibodies, rabbit anti-P65 (Cell Signaling Technology), rabbit anti-p-P65 (CST), rabbit anti-P-Stat3 (CST) and mouse anti-Beta Actin (β-actin) (Proteintech) were used in this study. Then, membrane was incubated with horseradish peroxidase-conjugated secondary antibodies, either goat anti-rabbit or goat anti-mouse (Proteintech) for 1 h at room temperature. Detection was achieved using the HPR substrate ECL (Proteintech), and band intensities were quantified with ImageJ software.
Statistical analysis
Statistical analyses were conducted using GraphPad Prism version 9.0 software, which facilitated the execution of unpaired t-tests for comparing differences between two groups. Results were deemed statistically significant if P < 0.05, with significance levels denoted as follows: *for P < 0.05, ** for P < 0.01, and *** for P < 0.001.


Comments (0)