
Remember me
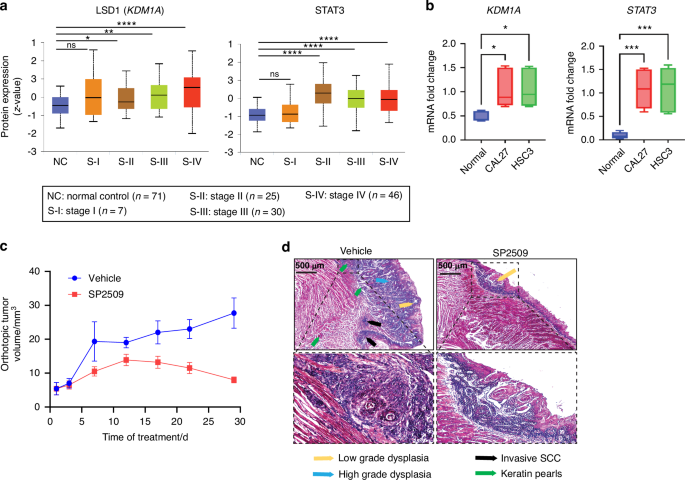


The analysis of STAT3 and LSD1 protein expression in OSCC patient samples from clinical proteomic tumor analysis consortium (CPTAC) identified that LSD1 and STAT3 protein expression increased with the progressive clinical stages (Fig. 1a) and pathological grades (Fig. S1a, b) in OSCC. RT-qPCR analysis confirmed that KDM1A and STAT3 expression levels were substantially higher in cancer cells (HSC3 and CAL27) than in normal epithelial cells (Fig. 1b). These two cell lines have been extensively characterized in vivo and in vitro.13,31 Hub gene detection analysis of differentially expressed genes from the Cancer Genome Atlas (TCGA) patient data, which identified the relationship between the top 10 hub genes, showed that KDM1A has a primary interaction with STAT3, SOX2, EZH2, and HIF1A and a secondary interaction with EGFR (Fig. S1c, d; Tables S1 and S2 for differentially expressed genes and patient characteristics). To determine whether LSD1 inhibition reversed OSCC and STAT3, SP2509 was tested in a syngeneic OSCC mouse model. Treatment with SP2509 significantly inhibited tumor growth (Fig. 1c), and H&E staining revealed a reduction in tumor pathological changes (Fig. 1d). SP2509 also regulated Kdm1a, Stat3, and Ctla4 expression (Fig. 2a). STAT3 protein levels were significantly higher in cancer cells than in normal epithelial cells and were significantly reduced in cancer cells when KDM1A was knocked out using the CRISPR-Cas9 system (Fig. 2b). RNA-Seq analysis revealed that SP2509 treatment altered the expression of a subset of genes (Fig. S1f, Table S3). Gene Ontology (GO) analysis using the Gene Set Enrichment Analysis (GSEA) tool showed negative enrichment of cell division and cell cycle process gene network, whereas positive enrichment of humoral and innate immune response network with SP2509 treatment compared with the vehicle control (Figs. 2c, S1g). To validate the effect of LSD1 inhibition and KDM1A knockout on the cell cycle process in vitro, we performed a Propidium Iodide (PI) staining assay using the HSC3 cell line and found that both LSD1 inhibition and KDM1A knockout induced G0/G1-phase cell cycle arrest, thus confirming our in vivo findings (Figs. 2d; S1h, i). Additionally, OSCC preneoplasia data32 reanalysis showed that KDM1A, STAT3, and CTLA4 expression progressively increased in preneoplasia tissues compared to that in normal tissues (Fig. S2a; Table S4). GSEA Hallmark analysis showed that the STAT3 network was upregulated in human dysplasia samples compared with that in normal samples (Fig. S2b). Ingenuity pathway analysis (IPA) revealed increased STAT3 and an immunosuppressive network and increased G1 to S-phase cell cycle progression (Fig. S2c, d), and interestingly, this correlates with our in vitro cell cycle analysis validation. Moreover, Tumor, Normal, and Metastasis (TNM) plot analysis from TCGA showed that the expression of KDM1A network genes, including STAT3 and CTLA4, was higher in HNSCC clinical tumors than in normal human tissues (Fig. S2e).
Fig. 1
STAT3 inhibition by SP2509 attenuates orthotopic tongue tumors: 4MOSC1 primary cells derived from tobacco carcinogen 4NQO-subjected tongue tumors were injected orthotopically and treated with SP2509. RNA-seq analysis after treatment of SP2509 in orthotopic 4MOSC1 syngeneic model. a Clinical cancer stage protein expression of LSD1 and STAT3 from CPTAC database. b Fold change of KDM1A and STAT3 in cancer cells like CAL27 and HSC3 in comparison with normal epithelial cells. c The tongue tumor volume of mice topically treated with SP2509 inhibits tumor volume. d The gross pathological phenotype, H&E staining of tongue treated with SP2509, showing reduced pathological lesions. “ns” P > 0.05, * P < 0.05, ** P < 0.01, *** P < 0.001, **** P < 0.000 1
Fig. 2
STAT3 inhibition by SP2509 reduced cell cycle progression and promotes immune response. a Fold change of Kdm1a, Stat3, and Ctla4 mRNA expression after treatment with SP2509 in mice OSCC preneoplasia. b Altered STAT3 protein expression in HSC3 compared to normal epithelial cells, and KDM1A knockout. c Gene set enrichment analysis (gene ontology) shows reduction in cell division and elevation in immune response when treated with SP2509. d Validation of G0/G1 cell cycle arrest after SP2509 and sgKDM1A treatment to HSC3 cells. Statistical analyses were performed using a t-test and one-way ANOVA. “ns” P > 0.05, *P < 0.05, **P < 0.01, ***P < 0.001, ****P < 0.000 1
LSD1 reprograms tumor microenvironment to immunosuppressionTo evaluate immune response upon LSD1 inhibition, flow cytometry analysis of single-cell suspensions from tongue tumors and spleens was performed to identify gate-specific infiltrating cells (Fig. S2f). The data showed that SP2509 treatment promoted the infiltration of CD45+, TCRβ+, CD4+, and CD8+ T cells in tongue tumors (Fig. 3a). A previous study found that CD4 + T cells regulate other immune cells, such as CD8+ T cells, where activated CD8+ T cell subsets produce various cytokines that affect the tumor microenvironment.33 Interestingly, SP2509 attenuated the immunosuppressive CD25+ CTLA4+ T cells (a subset of CD4+ T cells) (Fig. 3b). To evaluate the systemic effects, multiplex cytokine analysis of serum and flow cytometry of spleen immune cells from 4MOSC1 mice treated with SP2509 was performed. Interferon γ (IFN-γ) promotes antitumor immunity.34 Serum cytokine analysis showed that SP2509 treated mouse serum upregulated IFNβ, IFNγ, and IL9, which are known to promote proliferation and activation of CD8 + T cells (Fig. 3c). Spleen cell analysis showed the upregulation of CD45+, TCRβ+, CD4+, and CD8 + T cells (Fig. S3a). To evaluate IFNγ production status, HSC3 co-culture with human PBMCs treated with LSD1 inhibitor (Fig. 4a) and KDM1A knockout (Fig. 4b) in HSC3 cells showed a significant increase in IFNγ+ CD4+ and IFNγ+ CD8+ T cells compared to the respective controls.
Fig. 3
SP2509 has a unique mechanism to promote infiltration of CD8+ T cells in tongue OSCC and inhibiting immunosuppressive CTLA4+ CD25+ T cells: LSD1 regulates tumor immune microenvironment and inhibition with SP2509 facilitates infiltration of various immune cell types: a SP2509 promotes infiltration of CD45+, TCRβ+, CD4+, and CD8+ T cells, and b Reduces CTLA4+ CD25+ (of CD4+ T cells) immunosuppressive cells in OSCC. c Secreted cytokines measured from serum samples showing a significant increase in proinflammatory cytokines like IFNβ, IFNγ, and IL9 in the SP2509 treatment group. “ns” P > 0.05, *P < 0.05, **P < 0.01, ***P < 0.001, ****P < 0.000 1
Fig. 4
SP2509 treatment increases IFNγ producing T cells in a co-culture model. a Increased levels of CD8+ and CD4+ T cells along with IFNγ (in CD8+ and CD4+ T cells) in SP2509 treated HSC3 and human PBMC co-culture model. b Increased levels of CD8+ and CD4+ T cells along with IFNγ (in CD8+ and CD4+ T cells) in KDM1A deleted HSC3 and human PBMC co-culture model. “ns” P > 0.05, * P < 0.05, ** P < 0.01, *** P < 0.001, **** P < 0.000 1
To assess the effect of anti-PD1 treatment (InVivoMAb; BioXCell #BE0273) in combination with SP2509, we performed flow cytometry on 4NQO-induced oral cancer mice. We observed that both CD4+ and CD8+ T cells were significantly increased in the treatment groups, and IFNγ+ CD4+ and IFNγ+ CD8+ T cells were significantly increased. Conversely, the PD1+ CD8+ T cell population decreased significantly in both treatment groups, suggesting that LSD1 inhibition has a direct role in PD1 regulation (Fig. 5a, b). It was also observed that PD-L1+ epithelial cells were also significantly decreased in all the treatment groups (Fig. 5c). Moreover, analysis of 15-year survival data from TCGA (only patients with OSCC) showed that the clinical survival of patients with KDM1A and STAT3 expression and CD8A low expression was poor, similar to that of untreated tumors. Survival analysis resembling the SP2509 effect as KDM1A low, STAT3 low, and CD8A high significantly increased overall survival (Fig. 5d). Additionally, patients with KDM1A high expression had lower survival than KDM1A low expression (Fig. 5d). However, KDM1A (high expression), STAT3 (high expression), KDM1A (high expression), and CD8A (low expression) showed a slightly significant effect on overall survival (Fig. S3b). These findings strongly support our hypothesis that LSD1 promoted network can predict patient survival; however, this must be tested in clinical studies.
Fig. 5
In combination with antiPD1 immunotherapy, LSD1 inhibition shows significant CD8+ T cell infiltration and activation: (a-b) 4NQO mice model treated with AntiPD1, SP2509, and AntiPD1 + SP2509 showing; a Variable levels of CD8+ T cells, PD1+ CD8+ T cells, and IFNγ+ CD8+ T cells, b Variable levels of CD4+ T cells, and IFNγ+ CD4+ T cells, and c Reduced levels of PD-L1+ epithelial cells. d Kaplan-Meier survival analysis showing reduced overall survival in KDM1A high, and KDM1A-STAT3 high|CD8A low expressing patient groups. Statistical analyses were performed by t-test, one-way ANOVA, and Log-rank t-test. “ns” P > 0.05, * P < 0.05, ** P < 0.01, *** P < 0.001, **** P < 0.000 1
LSD1 inhibition reverses feline spontaneous clinical OSCC by attenuating STAT3 in veterinary clinical trialsTo evaluate the efficacy of LSD1 inhibition in clinical settings, the first feline preclinical study was performed on two feline OSCC patients. This study evaluated the safety and efficacy of another LSD1 inhibitor, seclidemstat (SP2577). We recruited an 11-year-old female owner-owned cat who presented with primary OSCC that was surgically excised. To evaluate safety, the cat was treated with 10 mg/kg of Seclidemstat 10 d after surgery. The samples were analyzed for veterinary clinical parameters such as complete blood count (CBC) and blood chemistry panel during the routine visit (Fig. 6a). The data showed that Seclidemstat promoted a gradual increase in lymphocytes to the normal range but reduced monocytes and neutrophils. Additionally, the AST/ALT ratio, which could be a predictor of cancer,35,36,37,38 was reduced (Fig. 6b). Visible relapsed or refractory OSCC was not detected even after six months of observation.
Fig. 6
Proof of principle study showing feline spontaneous natural OSCC post-treatment with Seclidemstat shows safety of LSD1 inhibition compared to pre-treatment: To evaluate safety and mechanism of LSD1, Seclidemstat applied to client-owned cats in veterinary clinical studies. a Illustration of experimental design to evaluate the safety of Seclidemstat in an 11-year-old female owner-owned cat that had surgically excised primary OSCC, treated with Seclidemstat post-10 days of surgery, and analyzed for veterinary clinical parameters. b Complete blood count (CBC) and blood chemistry panel show increased lymphocytes, reduced monocytes and neutrophils, and reduced AST/ALT ratio (Pearson correlation)
To evaluate whether Seclidemstat reverses the STAT3 network, a new feline patient with progressive OSCC and visible tongue tumors was recruited and treated for 56 days (Fig. 7a). The biopsy samples were collected before and after treatment and subjected to RNA-seq, which showed that Seclidemstat attenuated the STAT3 network and was one of the top 10 hub genes (Fig. S3d, e; Table S5). Moreover, Seclidemstat attenuated STAT3, CTLA4, and EGFR expression, but increased IRF3 expression (Fig. 7b). IPA revealed that seclidemstat attenuated the EGFR-STAT3 network, reduced cancer cell growth and T cell exhaustion, and upregulated T cell activation and proliferation (Fig. 7c). Overall, seclidemstat-mediated LSD1 inhibition affected OSCC progression in cats.
Fig. 7
Feline spontaneous natural OSCC post-treatment with Seclidemstat shows efficacy of LSD1 inhibition compared to pre-treatment: a Illustration of an experimental plan to evaluate the Seclidemstat-inhibited STAT3 network in feline patients with progressive OSCC and visible tongue tumors recruited to study and treated with Seclidemstat for 56 days. b Volcano plot representing differentially expressed genes in pre- and post-Seclidemstat treatment highlighted significant downregulation of STAT3, EGFR, and immune checkpoint gene CTLA4, whereas IRF3 was upregulated. c IPA analysis showed that downregulation in the EGFR-STAT3 pathway leads to CD8+ T cell proliferation and activation. “ns” P > 0.05, * P < 0.05, ** P < 0.01, *** P < 0.001, **** P < 0.000 1
KDM1A knockout or LSD1 pharmacological inhibition in mice tongue attenuates OSCC preneoplasia and STAT3 phosphorylationTo evaluate whether there was a correlation between STAT3 phosphorylation and LSD1 activity in human tumors, phospho-STAT3 levels were measured by phospho-flow cytometry. Overnight exposure of SP2509 to HSC3 and CAL27 (OSCC cell lines) treated with the STAT3 activator IL6 at 30 min and 1 h had a negative impact on the phosphorylation of STAT3, where it was observed that SP2509 treatment significantly reduced STAT3 phosphorylation at Tyr705 (Fig. 8a, b) (please also see Fig. S4a for CAL27 treatment with IL6 for 1 h). Experimental design showing Keratin promoter 14 specific conditional Kdm1a knockout in mice tongue epithelium to evaluate the effect of genetic deletions LSD1, as well as pharmacological inhibition using SP2509 in the 4NQO mouse model were evaluated in OSCC precancer (Fig. S4b). Kdm1a−/− mouse tongue tissues showed reduced OSCC pathology at week 18 post-4NQO treatment compared to Kdm1afl/fl mice (Figs. 8c; S4c). Similarly, SP2509 application during dysplasia prevented the progression of OSCC preneoplasia (Figs. 8d; S4c) as well as OSCC pathological lesions and reduced high-grade dysplasia and squamous cell carcinoma in the group treated with SP2509. Quantification of percentages in the cohorts was performed blindly by a board-certified oral pathologist (Figs. 8c, d; S4d, e). Immunostaining of Kdm1a−/− + 4NQO mice and SP2509 treated mice tongue sections showed inhibition of phosho-STAT3 (Fig. 9a). To evaluate the CTLA4+ immune cell population, we performed immunostaining with an APC anti-mouse CD152 (CTLA4) antibody on Kdm1afl/fl and Kdm1a−/− mouse tongues. We observed a significant decrease in CTLA4+ immune cells after Kdm1a deletion (Figs. 9b; S4f). To further evaluate the effect of Kdm1a knockout, we performed a co-culture experiment with CRISPR-Cas9 knockout (KDM1A−/−) in HSC3 cells and observed a significant decrease in CTLA4+ immune cells (Fig. S4g). This finding suggests a functional relationship between LSD1 and CTLA4 in OSCC.
Fig. 8
LSD1 promotes STAT3 mediated OSCC progression: a, b HSC3 cells treated with SP2509 for 24 h and IL6 for 30- and 60 min shows reduced phosphorylated STAT3 (Tyr705) levels as evaluated by phospho-flow cytometry. c H&E staining of tongue tissue sections in Kdm1a−/−+4NQO shows a reduction in the pathological lesion on the tongue after 18 weeks compared to the Kdm1afl/fl + 4NQO control. d H&E staining of tongue tissue sections isolated from mice with topical application of SP2509 inhibits pathological features of OSCC (quantification and evaluation performed blindly by a board-certified oral pathologist). Statistical analyses were performed by t-test and one-way ANOVA. “ns” P > 0.05, * P < 0.05, ** P < 0.01, *** P < 0.001, **** P < 0.000 1
Fig. 9
LSD1 promotes STAT3 phosphorylation and CTLA4+ immune cells: a Phosho-STAT3 (Tyr705) immunostaining of Kdm1a−/− + 4NQO and Kdm1afl/fl + 4NQO (upper panel), and Kdm1afl/fl + 4NQO + SP2509 and Kdm1afl/fl + 4NQO+Vehicle treated C57BL/6J mice (lower panel), and their respective quantifications. b Accumulation and quantification of CTLA4+ immune cells at the tumor site in Kdm1afl/fl and Kdm1a−/− mice tongue. Statistical analyses were performed by t-test. “ns” P > 0.05, *P < 0.05, ** P < 0.01, *** P < 0.001, **** P < 0.000 1
Kdm1a knockout results in a reduced Stat3 and STAT3-related protein networkTo evaluate changes in the overall microenvironment via an unbiased approach, we performed global proteomic analysis of protein lysates isolated from the tongues of Kdm1afl/fl and Kdm1a−/− mice at week 18 post-4NQO treatment (n = 7/condition) (Table S6). Kdm1a deletion in 4NQO mouse tongue lysate reduced STAT3 protein expression (Fig. 10a). Moreover, differential expression analysis followed by IPA revealed a dysregulated IL6-JAK2-STAT3 network, including the nuclear translocation of STAT3 (Fig. S5a) and EGFR-STAT3 network (Fig. 10b), which are key promoters of OSCC. Furthermore, STAT3 associated events were reduced (Figs. 10c; S5b), thus validating our finding that LSD1 regulates STAT3 and its pathways. Therefore, it can be concluded that LSD1 promotes STAT3 and STAT3-related networks through a novel key oncogenic mechanism.
Fig. 10
Proteomics analysis showing Kdm1a knockout impairs STAT3 protein network: Global proteomics of tongue protein lysate from Kdm1a−/− + 4NQO compared to Kdm1afl/fl + 4NQO. a Volcano plot showing downregulation of STAT3 along with top dysregulated genes. b IPA analysis of candidate genes involved in EGFR-related network. c IPA analysis shows affected STAT3-associated events and well as increased tumor suppressor events
SP2509 attenuates total STAT3 network proteins activityGlobal proteomics analysis showed that SP2509 attenuates various epigenetic regulators (LSD1, HDAC1, HDAC2, and KDM3B), cyclin-dependent kinases (CDK9, CDK12, and CDK13), immune regulators (PDCD1 and CD274), and STAT3. SP2509 increased the levels of specific immune regulators, such as IRF3, IRF9, CD34, CD5, STAT5A, and STAT5B (Fig. 11a, Table S7). Phosphoproteomic analysis showed that SP2509-treated OSCC cells inhibited various cyclins at specific functional sites, including (CDK12 at Ser382, CDK4 at Ser300, CDK13 at Ser384, CDK7 at Tyr170, CDK9 at Tyr186), proliferation markers (Mki67 at Ser337, and Ser2333) and eukaryotic initiation factors (eIF3G, eIF4B, eIF5B, and eIF6) (Fig. 11b, Table S8). Kinase-substrate analysis (KSEA) showed that LSD1-mediated inhibition of phospho-STAT3 also attenuated cyclin-dependent kinases involved in cell cycle regulation (Fig. 11c). A negative z-score indicates inhibition of kinase activity. Phosphomatic predictive analysis of phosphoproteomics data showed that the CDK2-CDK7 interaction was inhibited, resulting in reduced CDK7 activity in the overall network (Fig. 12a) (Fig. S6a). The Search Tool for the Retrieval of Interacting Genes/Proteins (STRING) (Fig. S6b) and IPA (Fig. 12b) (Fig. S6c) analysis showed that the inhibition of LSD1 promoted an increase in NFATc1, accumulation of inflammatory leukocytes, and an inflammatory response, whereas it inhibited the EGFR, STAT3 network, and CD274 expression.
Fig. 11
Proteomics analysis showing LSD1 inhibition impairs STAT3 protein and phospho-protein network: a Global proteomics of tongue tumor protein lysate from 4MOSC1 syngeneic mouse model showing SP2509 treatment reduces LSD1 and STAT3, whereas increased NFATc1 and IRF3. b Phosphoproteomics analysis of 4MOSC1 tumors treated with SP2509 reversed phosphorylated oncoproteins expression shown in the heat map, including phospho-CDK7 (Tyr170). c Kinase-substrate enrichment analysis (KSEA) in Phosphomatics tool reveals the kinase activity-based z-score (activation/deactivation) on the reduced activity for phosphorylated CDK7
Fig. 12
Phosphoproteomics analysis showing LSD1 inhibition impairs CDK7 and EGFR-STAT3 network: a Kinase substrate interaction analysis in SP2509 treated groups shows inhibition of CDK7 phosphorylation, which has various substrates, including other CDKs and eukaryotic translation initiation factors. b IPA analysis generated by global proteomics data shows that SP2509 reduces the EGFR-STAT3 network, whereas upregulation of NFATc1 results in accumulation of inflammatory leukocyte network
LSD1 promotes CDK7, which induces STAT3-related OSCC preneoplasiaWe used specific inhibitors of LSD1, STAT3, and CDK7 to understand the regulatory relationship in OSCC cell lines HSC3 and CAL27 (Fig. 13a, b). LSD1 inhibitors attenuated the expression of KDM1A, STAT3, and CDK7, STAT3 inhibitors inhibited STAT3 only, and CDK7 inhibitors attenuated STAT3 and CDK7. Thus, we identified that LSD1 inhibition attenuates CDK7 activating phosphorylation (Fig. 13b) and CDK7 expression (Fig. 13a, b), leading to STAT3 inhibition, where STAT3 promotes immunosuppression and OSCC preneoplasia progression to OSCC. Similar findings were observed when KDM1A, STAT3, and CDK7 were knocked out using the CRISPR-Cas9 system in HSC3 and CAL27 cells. Briefly, KDM1A, STAT3, and CDK7 were significantly downregulated upon KDM1A depletion. However, STAT3 depletion did not show a synergistic effect on KDM1A and CDK7, and CDK7 depletion only affected STAT3 expression (Fig. 13c, d). Next, LSD1 and CDK7 inhibition resulted in significant changes in pCDK7(T170) levels compared to STAT3 inhibition (Fig. 14a). Furthermore, to evaluate the methylation status of STAT3 and CDK7, we performed ChIP analysis and found that the binding of STAT3 and CDK7 with H3K4me2 was significantly reduced after LSD1 inhibition, whereas binding with H3K9me2 was significantly increased (Fig. 14b). Thus, LSD1 affected the chromatin states of STAT3 and CDK7.
Fig. 13
CDK7 is a key mediator of LSD1-induced STAT3 expression: RT-qPCR analysis to evaluate the effect of LSD1, STAT3, or CDK7 inhibitors on expression KDM1A, STAT3, and CDK7 expression in; a HSC3 cells, and b CAL27 cells. RT-qPCR analysis to evaluate the effect of genetic knockout of KDM1A, STAT3, or CDK7 on expression of KDM1A, STAT3, and CDK7 in; c HSC3 cells, and d CAL27 cells. “ns” P > 0.05, *P < 0.05, **P < 0.01, ***P < 0.001, ****P < 0.000 1
Fig. 14
Impact on phosphorylation of CDK7 and methylation of H3K4 and H3K9 after LSD1 inhibition: a Effect on phospho-CDK7 (T170) after LSD1, STAT3 and CDK7 inhibition. b Status of H3K4 and H3K9 methylation on STAT3 and CDK7. Statistical analysis was performed by t-test and one-way ANOVA. “ns” P > 0.05, *P < 0.05, **P < 0.01, ***P < 0.001, ****P < 0.000 1
Comments (0)