Patient samples
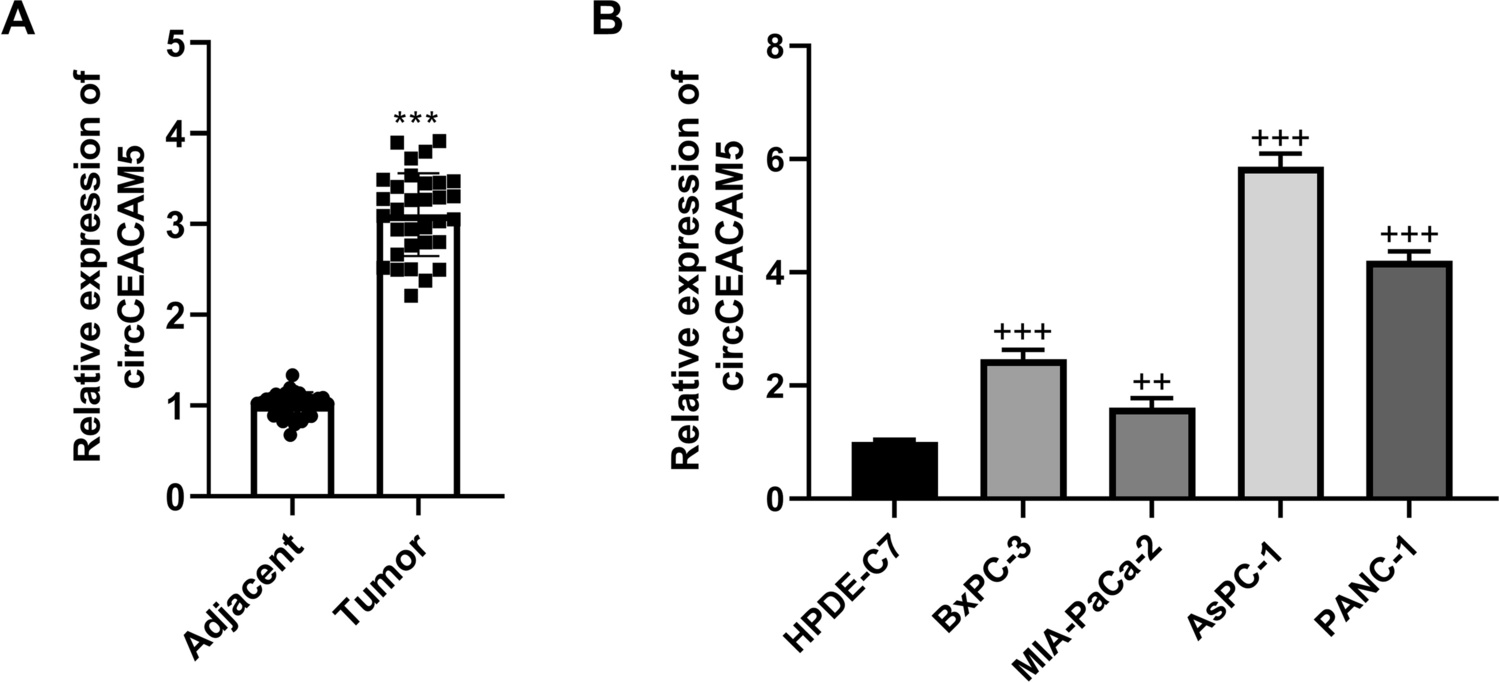
We acquired paired samples of pancreatic cancer tumors and adjacent tissues from 32 patients between October 2019 and February 2022. The inclusion criteria were as follows: patients who were diagnosed with pancreatic cancer on the basis of pathology, cytology, and imaging and patients who had not received relevant antitumor treatment. Tumor classification followed the most recent American Joint Committee on Cancer TNM system. Upon collection, the samples were flash-frozen in liquid nitrogen and stored at − 80 °C. This research was conducted with the approval of Changshu Institute of Technology Ethics Committee, with all participants providing informed consent in line with the principles of the Helsinki Declaration.
Cellular models and experimental conditions
Our study utilized four human pancreatic cancer cell lines (BxPC-3, MIA-PaCa-2, AsPC-1, and PANC-1) and human pancreatic ductal epithelial (HPDE) cells, all of which were derived from Procell (Wuhan, China). The cancer cell lines were maintained in high-glucose DMEM (Gibco, USA, 11995065) enriched with 10% FBS (Biological Industries, 04-001-1A). HPDE cells were grown in RPMI 1640 medium (Gibco, USA, 11875093) supplemented similarly. All the cultures were maintained at 37 °C in a 5% CO2 humidified environment.
For genetic manipulation experiments, AsPC-1 cells were transfected with various plasmids (500 ng per well in 6-well plates) via Lipofectamine 3000 (Thermo Fisher, L3000015) according to the manufacturer's protocol. These plasmids included overcircCEACAM5, shcircCEACAM5, overMETTL3, shMETTL3, overDKC1, and shDKC1. Subsequent analyses were performed 48 h posttransfection. The shRNA target sequence was as follows: sh-DKC1: 5′-CCGGCUGCACAAUGCUAUU-3′. sh-METTL3: 5′-GCAAGTATGTTCACTATGAAA-3′.
Nucleic acid extraction and processing
We extracted total RNA from tissue and cell samples via TRIzol reagent (Thermo Fisher, 15596026). For the subcellular localization studies, the nuclear and cytoplasmic fractions were separated via a PARIS kit (Thermo Fisher, AM1921). Genomic DNA was isolated via a Genomic DNA Isolation Kit (TIANGEN Biotech, DP304-03).
To assess RNA stability, we subjected total RNA to treatment with either RNase R (3 U/μg, Abcam, ab286167) or actinomycin D (1 μg/mL, Sigma-Aldrich, A9415) at 37 °C for 10 min. After treatment, RNA was purified via an RNeasy MinElute Cleanup Kit (Qiagen, 74204) before RT‒PCR analysis.
For PCR-based experiments, we amplified cDNA or gDNA via primers designed specifically for circCEACAM5. The resulting PCR products were visualized on 2% agarose gels in TAE buffer, with a 1000 bp DNA ladder (TransGen, BM101-01) for size reference. We confirmed the identity of the positive PCR products through Sanger sequencing.
Quantitative gene expression analysis
For quantitative analysis of gene expression, we isolated total RNA via TRIzol (Invitrogen, 15596026). The RNA was then reverse transcribed to cDNA using PrimeScript RT Master Mix (Takara, RR036A). Quantitative PCR was performed on an ABI 7500 real-time PCR system (Applied Biosystems) using SYBR Premix Ex Taq (Takara, RR420A). We calculated relative mRNA expression levels via the 2− ΔΔCT method, with β-actin serving as our internal control for normalization. All sequences of primers used were as follows: circCEACAM5: forward: 5′-CTCAGCTGGGGCCACTG-3′, reverse: 5′-GTGTCCGGCCCATCAGTC-3′; METTL3: forward: 5′-AAGCTGCACTTCAGACGAAT-3′, reverse: 5′-GGAATCACCTCCGACACTC-3′; GAPDH: forward: 5′-CAGCCAGGAGAAATCAAACAG-3′; reverse: 5′-GACTGAGTACCTGAACCGGC-3′.
Protein analysis
We extracted total protein from the samples via RIPA buffer (Thermo Fisher, 89900) and quantified it via a Bradford protein assay (BCA) kit (Thermo Fisher, 23225). For each sample, 30 μg of protein was resolved on 12% SDS‒PAGE gels and transferred to PVDF membranes (Millipore, IPVH00010).
The membranes were blocked with 5% skim milk in TBST for 1 h at ambient temperature. We then probed the membranes with primary antibodies targeting METTL3 (1:1000, Abcam, #ab195352), CDK1 (1:1000, Cell Signaling Technology, #9116), or GAPDH (1:5000, Proteintech, #60004-1-Ig) overnight at 4 °C. Following TBST washes, the membranes were incubated with HRP-linked secondary antibodies (1:5000, Jackson ImmunoResearch, #111-035-003) for 2 h at room temperature.
We visualized the protein bands via a chemiluminescence imaging system (Biocompare) with enhanced chemiluminescence (ECL) reagents (Novex, WP20005) and quantified the band intensities via ImageJ software.
Assessment of cell viability
To evaluate cell viability, we employed the CCK8 assay. The cells were seeded in 96-well plates at a density of 2 × 10³ cells per well in 100 μL of culture medium. At 24, 48, and 72 h postseeding, we added 10 μL of CCK-8 reagent (Sigma‒Aldrich, 96,992) to each well. After a 2-h incubation at 37 °C, we measured the absorbance at 450 nm via a microplate reader.
Cell proliferation analysis
We assessed cell proliferation via a 5-ethynyl-2′-deoxyuridine (EdU) incorporation assay. The cells were cultured in medium supplemented with 50 μM EdU (Thermo Fisher, C10337) for 2 h. We subsequently fixed the cells with 50 μL of 4% paraformaldehyde for 30 min, followed by neutralization with 50 μL of 2 mg/mL glycine solution. The cell membranes were permeabilized with 100 μL of 0.5% Triton X-100 for 10 min.
After being washed with PBS, the cells were incubated with 100 μL of 1 × Apollo dye solution at room temperature for 30 min. We then counterstained the nuclei with 100 μL of Hoechst 33342 (1:2000 dilution) for 30 min. Images were acquired via a Nikon Eclipse Ti2 fluorescence microscope.
Apoptosis detection by flow cytometry
We assessed cellular apoptosis via flow cytometry. The cells were detached with 0.25% EDTA-free trypsin and suspended in binding buffer. The cell suspension was then treated with Annexin V-FITC and propidium iodide (PI) from an apoptosis detection kit (Life Technologies, V13242), with 5 μL of each stain added per 100 μL of cell suspension. After a 15-min incubation at room temperature in the dark, we analyzed the apoptotic rate via a BD FACSCanto II flow cytometer (BD Biosciences).
TUNEL assay
To further evaluate apoptosis, we employed the TdT-mediated dUTP nick end labeling (TUNEL) method with a commercial kit (Beyotime, C1086). The cells were grown to 75% confluence, fixed with 4% paraformaldehyde and permeabilized with a solution of 0.1% sodium citrate containing 0.1% Triton X-100. We then applied the TUNEL kit reagents to assess DNA fragmentation. Nuclear counterstaining was performed with DAPI (1:5000, Sigma-Aldrich, #D9542). We captured fluorescence images via a Nikon Eclipse Ti2 fluorescence microscope.
Cell invasion and migration assays
We evaluated cell invasion and migration capabilities via Transwell assays. For both assays, the cells were harvested and resuspended in serum-free DMEM. We seeded 2 × 10⁴ cells in 200 μL of this medium into the upper chamber of Transwell inserts (8 μm pore size; Corning, 354480). The lower chamber contained 500 μL of medium supplemented with 20% FBS as a chemoattractant.
For invasion assays, the upper chamber was precoated with Matrigel. After a 24-h incubation at 37 °C, we carefully removed noninvaded cells from the upper surface of the membrane. The cells that had invaded through the membrane were fixed with 4% paraformaldehyde and visualized by staining with 0.1% crystal violet. We captured images via a light microscope.
RNA‒protein interaction analysis
To investigate RNA‒protein interactions, we employed a Magnetic RNA‒Protein Pull-Down Kit (Thermo Fisher, 20164). We synthesized circCEACAM5 and its antisense RNA in vitro via T7 RNA polymerase and purified the transcripts with an RNeasy Mini Kit (Qiagen, 74104). The biotinylated RNA was then incubated with the cell lysates and streptavidin-coated magnetic beads for 1 h at 4 °C. After thorough washing, we eluted the bound proteins and analyzed them via western blotting.
Protein‒RNA complex immunoprecipitation
We performed RNA immunoprecipitation (RIP) using a Magna RIP RNA-Binding Protein Immunoprecipitation Kit (Millipore, 17–700). The cell lysates were incubated for 6 h at 4 °C with magnetic beads conjugated to either anti-METTL3 antibody (Abcam, ab195352) or control IgG. Following incubation, we washed the beads and treated them with proteinase K. We then extracted the RNA via TRIzol reagent and quantified the circRNA abundance via RT‒qPCR.
Subcellular RNA localization
To visualize the subcellular localization of specific RNAs, we conducted fluorescence in situ hybridization (FISH) using a commercial kit (RiboBio, Guangzhou, China). We fixed the cells with 4% paraformaldehyde and permeabilized them with 0.5% Triton X-100. The slides were then treated with proteinase K (20 μg/mL) for 10 min at room temperature, followed by incubation in prehybridization buffer for 1 h at 37 °C.
We performed hybridization overnight at 37 °C using a biotin-labeled probe (0.1 μg). After sequential washes with 2 × SSC and 1 × SSC, we incubated the slides with FITC-conjugated streptavidin (1:400 dilution) for 1 h at room temperature. Nuclei were counterstained with DAPI (1:5000, Sigma-Aldrich, D9542). We captured images via a Nikon Eclipse Ti2 fluorescence microscope.
In vivo tumor model
We conducted xenograft studies using five- to six-week-old female BALB/c nude mice (Beijing Vital River Company, Beijing, China) maintained under specific pathogen-free (SPF) conditions. The mice were kept in an independent ventilation cage, the temperature was strictly controlled at 23 ± 2 °C, the humidity was 50–60%, the diet and drinking water were provided ad libitum, the light conditions were automatically controlled, and the day and night cycle was 12 h. Following one week of acclimatization, we subcutaneously injected 1 × 10⁷ AsPC-1 cells suspended in 100 μL of normal saline into each mouse’s right flank.
Once the tumors reached approximately 100 mm3, we randomly assigned the mice to treatment groups (n = 5 per group). Each group received intratumoral injections of 1 × 10⁹ plaque-forming units (PFUs) of lentivirus carrying overcircCEACAM5, sh-circCEACAM5, or the control vector (Shanghai Genechem Co., Ltd., Shanghai, China). We administered injections every 3 days for a total of 5 treatments.
We measured tumor dimensions every 3 days via calipers and calculated the tumor volume via the following formula: V = (L × W2)/2, where V is the volume, L is the length, and W is the width. At 28 days postcell injection, we euthanized the mice via CO₂ inhalation and harvested the subcutaneous tumors for further analysis. All animal procedures were approved by the Animal Ethics Committee of Changshu Institute of Technology.
Histological analysis
We fixed the tumor tissues in 4% paraformaldehyde, embedded them in paraffin, and prepared 4-μm sections. For hematoxylin‒eosin (H&E) staining, we deparaffinized and rehydrated the sections and then stained them with hematoxylin (5 min) followed by eosin (2 min). After dehydration and clearing, we mounted the sections with coverslips and examined them under a light microscope to assess histoarchitectural changes.
Protein expression in tissue samples
We performed immunohistochemical (IHC) staining on 4-μm-thick tissue sections. After deparaffinization and rehydration, we conducted antigen retrieval via citrate buffer (pH 6.0) at 95 °C for 20 min. We then quenched endogenous peroxidase activity with 3% H₂O₂ for 10 min and blocked nonspecific binding with 5% normal goat serum for 1 h at room temperature.
The sections were incubated overnight at 4 °C with an anti-Ki67 antibody (1:200, Abcam, ab15580). Following PBS washes, we applied an HRP-conjugated secondary antibody (1:500, Jackson ImmunoResearch, 111-035-003) for 1 h at room temperature. We visualized the signals via DAB substrate (Vector Laboratories, #SK-4100) and counterstained the nuclei with hematoxylin. Finally, we dehydrated, cleared, and mounted the sections with coverslips.
Data analysis
We conducted the statistical analyses via SPSS 21.0 software (IBM Corp., USA). The data are expressed as the means ± standard deviations (SDs). For comparisons between two groups, we employed Student’s t test. For multiple group comparisons, we used one-way analysis of variance (ANOVA) followed by Tukey’s post hoc test. We considered p < 0.05 to indicate statistical significance. All experiments were performed in triplicate and repeated at least three times to ensure reproducibility.


Comments (0)