
Remember me
To compare the ability of Nb and minibody PET tracers to visualize lowly-expressed targets, we reformatted a previously described human TIGIT (hTIGIT)-targeting Nb into a minibody-like format, referred to as the minabody (Mnb) [15]. This hTIGIT-targeting Nb is highly stable and binds strongly to recombinant hTIGIT proteins (KD = 1.9 nM) and hTIGIT-overexpressing cells (KD = 1.0 nM) [15]. SPECT imaging with this Nb resulted in high target-to-background ratios and specific uptake in hTIGIT-overexpressing tumors and in hTIGIT knock-in mice, as confirmed by ex vivo analysis [15].
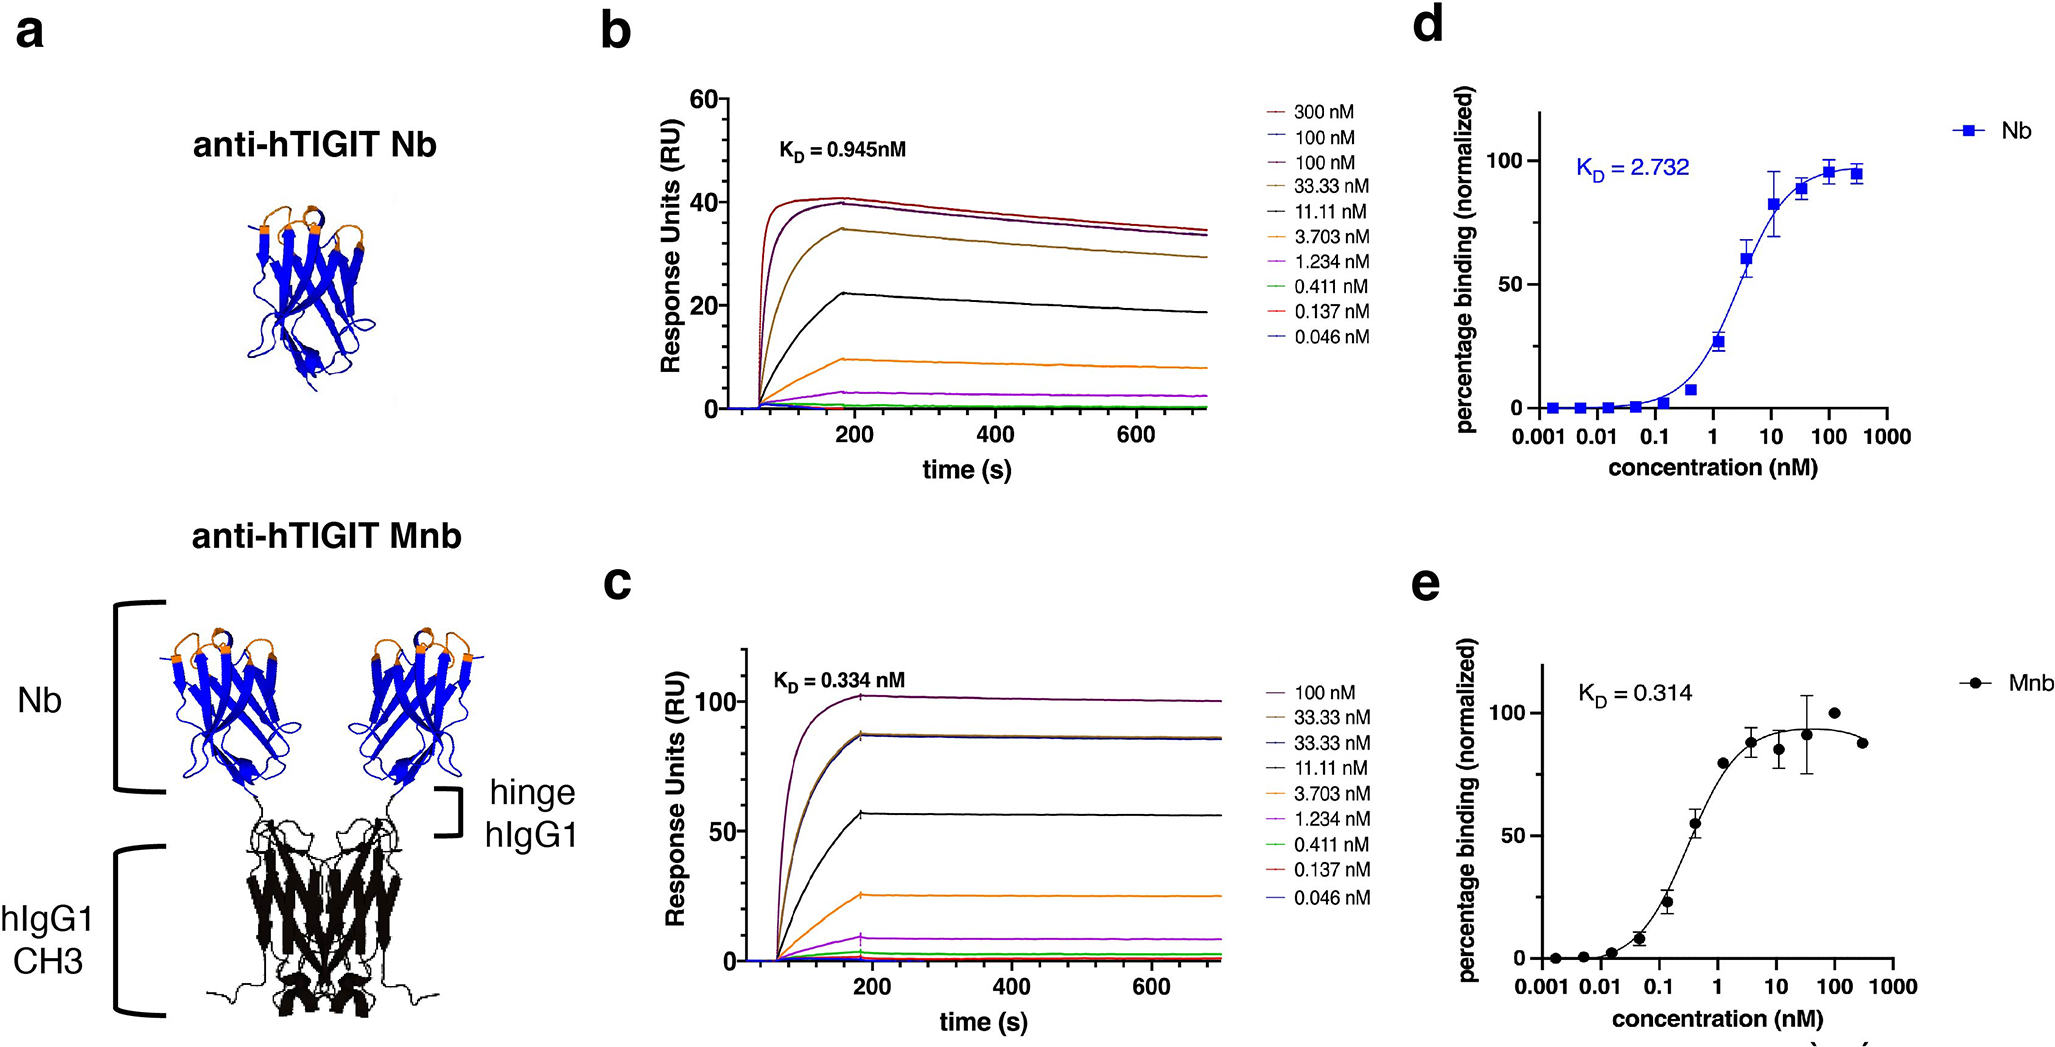
To mimic a minibody-format but still allow a head-to-head comparison, we reformatted the Nb to a Mnb construct (Fig. 1a, Supplemental Fig. 1). Compared to a standard minibody (~ 80 kDa), the Mnb is smaller, with an expected molecular weight (MW) of 55.66 kDa. To confirm the purity and the MW of each construct, SDS-PAGE was performed under reducing conditions, showing bands corresponding to the Nb and the reduced monomeric form of the Mnb at their theoretical MW of respectively,13.58 kDa and 27.83 kDa, respectively (Supplemental Fig. 2a). These results were further validated by intact mass spectrometry (MS) analysis (Supplemental Fig. 3a-b).
Fig. 1
Structure and affinity kinetics of the nanobody and minabody. a) Illustrative structure of the nanobody (Nb) and minabody (Mnb) with hTIGIT-Nb domain, hinge and the CH3 domain of human (h) IgG1. b-c) Nb (b) and Mnb (c) affinity kinetics were evaluated via binding of different compound concentrations to hTIGIT recombinant protein, as determined by surface plasmon resonance. d-e) Nb (d) and Mnb (e) binding affinities evaluated via binding of different compound concentrations to hTIGIT-overexpressing and wild-type TC-1 cells, percentage binding was evaluated by flow cytometry following staining with anti-His PE-labeled antibody. The graphs represent the normalized specific binding on hTIGIT-overexpressing TC-1 cells after subtracting the binding on wild-type TC-1 cells, n = 3. Data are presented as mean ± S.D
Fig. 2
Radioligand protein binding assay of 64Cu-labeled nanobody and minabody. a-b) Binding of different concentrations of [64Cu]Cu-NOTA-hTIGIT-Nb (a) and [64Cu]Cu-NOTA-hTIGIT-Mnb (b) to recombinant hTIGIT protein. Binding was displayed as counts per minute (CPM), representing binding to hTIGIT, n = 3. Data are presented as mean ± S.D
Fig. 3
In vivo PET/CT imaging and ex vivo biodistribution of tumor-bearing mice injected with [64Cu]Cu-NOTA-hTIGIT-Nb or [64Cu]Cu-NOTA-hTIGIT Mnb. a-b) Representative PET/CT images and ex vivo quantification of immunodeficient mice bearing untransduced TC-1 tumor (-) and hTIGIT-overexpressing TC-1 tumor (+) at opposing flanks injected with [64Cu]Cu-NOTA-hTIGIT-Nb (a) and [64Cu]Cu-NOTA-hTIGIT Mnb (b) at 1-, 4-, 8-, 24-, or 48-hour post-injection (n = 3 per time point). Ex vivo measured uptake in the untransduced TC-1 tumor (Blue) and the hTIGIT-overexpressing TC-1 tumor (Red) was shown as %IA/g on the top. 3D MIP images and a transversal section of the tumors, shown at the bottom with a color scale showing the percentage injected dose per cc (%ID/cc). Data are presented as mean ± S.D. Statistical analyses were performed using an unpaired t-test. H, heart; Ki, kidneys; B, bladder; L, liver; red arrows: tumors
Fig. 4
Target-to-background ratios of [64Cu]Cu-NOTA-hTIGIT-Nb and [64Cu]Cu-NOTA-hTIGIT-Mnb. a-b) Target (hTIGIT positive tumor)-to-blood ratios of [64Cu]Cu-NOTA-hTIGIT-Nb (a) and [64Cu]Cu-NOTA-hTIGIT-Mnb (b) at different time points post-injection (n = 3 per time point). c-d) hTIGIT positive tumor -to-hTIGIT negative tumor ratios of [64Cu]Cu-NOTA-hTIGIT-Nb (c) and [64Cu]Cu-NOTA-hTIGIT-Mnb (d) at different time points post-injection (n = 3 per time point). Data are presented as mean ± S.D. Statistical analyses were performed using an one-way ANOVA with multiple comparisons
Fig. 5
Clearance kinetics of [64Cu]Cu-NOTA-hTIGIT-Nb and [64Cu]Cu-NOTA-hTIGIT-Mnb over time. a-c)Ex vivo quantification (%IA/g) of [64Cu]Cu-NOTA-hTIGIT-Nb (Blue) and [64Cu]Cu-NOTA-hTIGIT-Mnb (Black) in blood (a), liver (b) and kidneys (c) at different time points post-injection (n = 3 per time point). Data are presented as mean ± S.D
Fig. 6
Binding assay of [18F]FB-hTIGIT-Nb to human TIGIT. (a) Binding of different concentrations of [18F]FB-hTIGIT-Nb to recombinant hTIGIT protein. Binding was determined via a radioligand protein binding assay and displayed as counts per minutes (CPM), representing binding to hTIGIT. (b) Binding of different concentrations of [18F]FB-hTIGIT-Nb on TC-1 hTIGIT-overexpressing and TC-1 wild-type cells, evaluated by flow cytometry following staining with anti-His PE-labeled antibody. The graph represents the normalized specific binding on hTIGIT overexpressing TC-1 cells after subtracting the binding on wild-type TC-1 cells. Data are presented as mean ± S.D
Fig. 7
In vivo PET/CT imaging and ex vivo biodistribution of tumor bearing mice injected with 64Cu-, 68Ga- or 18F-labeled nanobody. a-c) Representative PET/CT image and ex vivo quantification of immunodeficient mice bearing untransduced TC-1 tumor (-) and hTIGIT-overexpressing TC-1 tumor (+) at opposing flanks injected with [64Cu]Cu-NOTA-hTIGIT-Nb (a), [68Ga]Ga-NOTA-hTIGIT-Nb (b) or [18F]FB-hTIGIT-Nb (c) at 1-hour post-injection (n = 4 per time point). Ex vivo measured uptake in the untransduced TC-1 tumor (Blue) and the hTIGIT-overexpressing TC-1 tumor (Red) was shown as %IA/g on the top. 3D MIP images and a transversal section of the tumors, shown at the bottom with color scale showing the percentage injected dose per cc (%ID/cc). Data are presented as mean ± S.D. Statistical analyses were performed using an unpaired t-test. Ki, kidneys; B, bladder; red arrows: tumors
The anti-human TIGIT Minabody shows higher binding affinities compared to the nanobody formatNext, the binding characteristics of the Nb and the Mnb were evaluated. These include the evaluation of binding affinities on recombinant hTIGIT proteins and on hTIGIT-overexpressing TC-1 lung carcinoma cells. The Nb demonstrated a KD of 0.95 nM and 2.70 nM on protein and cells respectively, while the Mnb showed a binding capacity of 0.33 nM and 0.31 nM on protein and cells respectively (Fig. 1b-e). These results indicate an enhanced affinity of the Mnb, which can be attributed to the avidity effect conferred by the bivalent nature of the Mnb, and a visibly improved off-rate.
To compare the in vivo characteristics of both formats using in vivo PET/CT imaging, The Nb and Mnb were radiolabeled. Considering the Mnbs’s larger size and the slower clearance, copper-64 was chosen as the most suitable PET radionuclide. Consequently, the NOTA-chelator was randomly conjugated to lysine residues of both the Mnb and the Nb (Supplemental Fig. 2b) prior to radiolabeling. Mass spectrometry analysis revealed an average addition of 3.09 NOTA-chelators per Mnb, and 1.03 NOTA-chelators per Nb (Supplemental Fig. 3c-d). Binding affinity of the Nb and Mnb to hTIGIT remained unaffected post-conjugation, showing a KD of 2.29 nM for Nb-NOTA and a binding capacity of 0.24 nM for Mnb-NOTA (Supplemental Fig. 4a-b). We also evaluated the binding of NOTA-conjugated Nb and Mnb on hTIGIT overexpressing cells showing slightly lower affinity on cells, however remained in the nanomolar range (Supplemental Fig. 4c-d). The radiolabeling process of the NOTA-conjugated proteins to copper-64 only required 5 min of incubation at room temperature (RT) with 2 MBq/µg of protein, yielding radiochemical decay-corrected yields (RCY d.c.) of 93.5% for [64Cu]Cu-NOTA-hTIGIT-Nb and 92.2% for [64Cu]Cu-NOTA-hTIGIT-Mnb. We evaluated the radiochemical purity (RCP) of both radiolabeled proteins by radio-size exclusion chromatography (radio-SEC) and radio-instant thin layer chromatography (iTLC), showing a RCP > 95% for both the [64Cu]Cu-NOTA-hTIGIT-Nb and [64Cu]Cu-NOTA-hTIGIT-Mnb (Supplemental Figs. 5–6). The RCP on iTLC remained unchanged when we assessed the incubation time from 5 min up to 30 min. Further, a stability study in human serum was performed for up to 24 h at 37 °C. The [64Cu]Cu-NOTA-hTIGIT-Nb and [64Cu]Cu-NOTA-hTIGIT-Mnb showed a RCP > 95% after 2 and 24 h, respectively (Supplemental Fig. 7). To evaluate whether the radiolabeling process affected the binding capacity of the Nb and Mnb to hTIGIT, radioligand protein binding assays on recombinant hTIGIT protein were performed, showing binding capacities of 1.32 nM and 0.65 nM for the radiolabeled Nb and Mnb, respectively, indicating no loss of binding affinity upon radiolabeling (Fig. 2).
The [64Cu]Cu-NOTA-hTIGIT-nanobody provides better contrast PET imaging than [64Cu]Cu-NOTA-hTIGIT-minabody tumor-bearing miceThe ability of 64Cu-labeled Nb and Mnb formats to accumulate specifically in hTIGIT-positive tumors was assessed. Therefore, immunodeficient mice bearing wildtype (TIGIT-negative) and hTIGIT-overexpressing (TIGIT-positive) TC-1 tumors on opposite flanks were intravenously (i.v.) administered with comparable molar activities of [64Cu]Cu-NOTA-hTIGIT-Nb (apparent molar activity of 25.6 ± 1.1 GBq/µmol, specific activity of 1.8 ± 0.08 MBq/µg), or [64Cu]Cu-NOTA-hTIGIT-Mnb (apparent molar activity of 28.1 ± 1.1 GBq/µmol, specific activity of 0.5 ± 0.02 MBq/µg). PET/CT imaging was performed at 1-, 4-, 8-, 24-, and 48-hour post-injection, followed by ex vivo biodistribution studies to assess radiotracer uptake in dissected organs using gamma-counting (Fig. 3 and Supplemental Fig. 8). On PET/CT imaging, [64Cu]Cu-NOTA-hTIGIT-Nb uptake was observed in TIGIT-positive tumors but not in TIGIT-negative tumors from 1-hour post-injection onwards, remarkably lasting up to 48-hour post-injection (Fig. 3a, Supplemental Fig. 9a), despite the fast clearance of the Nb. This finding demonstrated the ability of [64Cu]Cu-NOTA-hTIGIT-Nb to allow early-time point PET imaging with high specificity. Moreover, the tumor signals of the Nb-radiotracer on the PET images correlated with the ex vivo gamma-counter measurements (Supplemental Fig. 10). In contrast, [64Cu]Cu-NOTA-hTIGIT-Mnb showed no early uptake difference between the TIGIT-positive and TIGIT-negative tumors (1- and 4-hour-post-injection). This may be attributed to the high blood circulation levels, causing elevated background signal, as indicated by PET signal from the heart and arteries. Ex vivo gamma-counting confirmed the high blood levels at 1-hour (9.47 ± 0.68%IA/g) and 4-hour (2.52 ± 0.26%IA/g) post-injection. A clear uptake difference between TIGIT-negative and -positive tumors appeared at 8-hour post-injection on PET/CT imaging, supported by ex vivo analysis showing significantly higher uptake in TIGIT-positive tumors compared to TIGIT-negative tumors (Fig. 3b; Supplemental Fig. 9b). At this time point, blood accumulation of Mnb-radiotracer decreased further (0.59 ± 0.13%IA/g), aligning more closely with Nb levels (0.19 ± 0.03%IA/g).
Notably, [64Cu]Cu-NOTA-hTIGIT-Nb showed high target (hTIGIT-positive tumor)-to-TIGIT negative tumor and target-to-blood ratios, peaking at 8-hour post-injection (11.45 ± 0.99 23.05 ± 4.22, respectively), before decreasing at later time points (Fig. 4a and c). This suggests that imaging at 4- or 8-hour post-injection could yield the highest target-to-background ratios. On the contrary, the target-to-blood and target-to-TIGIT negative tumor ratios continued to increase for the [64Cu]Cu-NOTA-hTIGIT-Mnb, reaching their highest values at 48-hour post-injection (13.89 ± 1.04; 1.75 ± 0.16, respectively) (Fig. 4b and d), though still lower compared to that of the Nb-radiotracer. Additionally, retention of [64Cu]Cu-NOTA-hTIGIT-Nb and [64Cu]Cu-NOTA-hTIGIT-Mnb was observed in the kidneys and bladder. While no liver uptake was observed with [64Cu]Cu-NOTA-hTIGIT-Nb, [64Cu]Cu-NOTA-hTIGIT-Mnb exhibited high liver uptake on PET/CT imaging, as further confirmed by ex vivo analysis, indicating additional hepatic clearance (Fig. 5).
In conclusion, the [64Cu]Cu-NOTA-hTIGIT-Nb allows high-specificity PET imaging at early and repeated time points with specific PET signals detectable up to 48-hour post-injection. In contrast, the Mnb-format showed unspecific accumulation in the TIGIT-negative tumor and higher liver retention.
In vitro characterization of anti-human TIGIT Nb labeled with three radionuclidesAs the Nb-format showed more optimal imaging properties in our model, we aimed to determine the ideal PET radionuclide for the Nb-based PET tracer. Short-lived radionuclides such as gallium-68 and fluor-18 are commonly used for Nb-based imaging due to the Nb’s fast clearance, whereas copper-64 is less commonly applied [19,20,21]. However, a side-by-side comparison between these radionuclides has not been performed yet for Nb-based PET imaging. Therefore, we compared the radiolabeling process, imaging resolution and mouse tumor uptake of the hTIGIT Nb labeled with each of these PET radionuclides.
In case of labeling with the radiometals copper-64 or gallium-68, the NOTA-conjugated Nb was used. The complexation process required 5 min for copper-64 and 10 min for gallium-68. Following purification, both [64Cu]Cu-NOTA-hTIGIT-Nb and [68Ga]Ga-NOTA-hTIGIT-Nb showed a RCP > 95% (Supplemental Fig. 11a-b and 12a-b). The apparent molar activities were 25.6 ± 1.1 GBq/µmol and 22.74 ± 2.87 GBq/µmol for [64Cu]Cu-NOTA-hTIGIT-Nb and [68Ga]Ga-NOTA-hTIGIT-Nb, respectively. The RCY d.c. was 93.5% for [64Cu]Cu-NOTA-hTIGIT-Nb and 75.69% for [68Ga]Ga-NOTA-hTIGIT-Nb.
Labeling of biomolecules with fluor-18, a radiohalogen, is more complex and typically requires an indirect approach. Here, the prosthetic group N-succinimidyl-4-[18F]fluorobenzoate ([18F]SFB) was employed to radiolabel the Nb [22]. The purified [18F]FB-hTIGIT-Nb was obtained with an RCP > 95% (Supplemental Fig. 11c and 12c), with an end-of-synthesis activity amounted to 5.84 ± 0.62 GBq. The apparent molar activity was 22.45 ± 3.17 GBq/µmol. The entire production process required 95 min from receiving the activity from the cyclotron onwards, resulting in an overall RCY d.c. of 11 ± 2%. Notably, the production time of the 18F-tracer is significantly longer compared to that of the 68Ga- and 64Cu-labeled tracer (Table 1) due to the complexity of radiofluorination. To evaluate whether the radiofluorination affected the binding ability and affinity of the Nb to hTIGIT, we performed binding assays on recombinant hTIGIT protein (Fig. 6a) and hTIGIT-overexpressing cells (Fig. 6b). In both assays, similar binding affinities of the [18F]FB-hTIGIT-Nb, compared to the unconjugated Nb, to hTIGIT were observed.
Table 1 Comparison of the 68Ga-, 64Cu- and 18F-labeled Nbs in terms of production time and stability in human serum and competition with EDTAAdditionally, in vitro stability of the three radiotracers were evaluated in human serum at 37 °C and a 1000-fold molar excess of ethylenediaminetetraacetic acid (EDTA) to assess potential transchelation. These tests are important to mimic the in vivo behavior of the radiotracers (Table 1). All three radiotracers were found stable for ≥ 2-hour in human serum (RCP > 95%). Additionally, no transchelation was observed up to 3-hour for the 64Cu-labeled tracer and up to 2-hour for the 68Ga-labeled tracer (RCP > 95%).
64Cu shows superior tumor uptake and contrast for nanobody imaging compared to 68Ga and 18FNext, we evaluated the potential of the anti-hTIGIT Nb labeled with copper-64, gallium-68, or fluor-18 to specifically visualize hTIGIT by in vivo PET imaging one hour after i.v. administration in tumor-bearing mice. All three radiotracers showed specific uptake in the hTIGIT-positive tumors. Mice injected with [64Cu]Cu-NOTA-hTIGIT-Nb displayed PET images with the highest resolution and uptake in the hTIGIT-positive tumors, as evaluated ex vivo (3.26 ± 0.15%IA/g). While the spatial resolution of PET images obtained from [68Ga]Ga-NOTA-hTIGIT-Nb was relatively low, the uptake in hTIGIT-positive tumors was comparable to that of [64Cu]Cu-NOTA-hTIGIT-Nb, with an uptake of 3.13 ± 1.29%IA/g. Interestingly, PET images from mice injected with [18F]FB-hTIGIT-Nb showed better resolution compared to [68Ga]Ga-NOTA-hTIGIT-Nb, despite nearly two-fold lower uptake (1.68 ± 0.13%IA/g) in the hTIGIT-positive tumor, as demonstrated by ex vivo analysis (Fig. 7 and Supplemental Fig. 13). Renal clearance of the radiolabeled Nbs resulted in high uptake in the kidneys and the bladder. Yet, renal retention of [18F]FB-hTIGIT-Nb (80.60 ± 17.51%IA/g) was 1.5 to 2-fold lower compared to the [64Cu]Cu-NOTA-hTIGIT-Nb or [68Ga]Ga-NOTA-hTIGIT-Nb (118.07 ± 19.84, 166.99 ± 14.89%IA/g, respectively) (Supplemental Fig. 13). Overall, the straightforward labeling strategy, high specific uptake, and good spatial resolution indicate that copper-64 may be a more suitable radionuclide for Nb-based PET imaging compared to the more commonly used gallium-68 or fluor-18 radionuclides.
Comments (0)