
Remember me
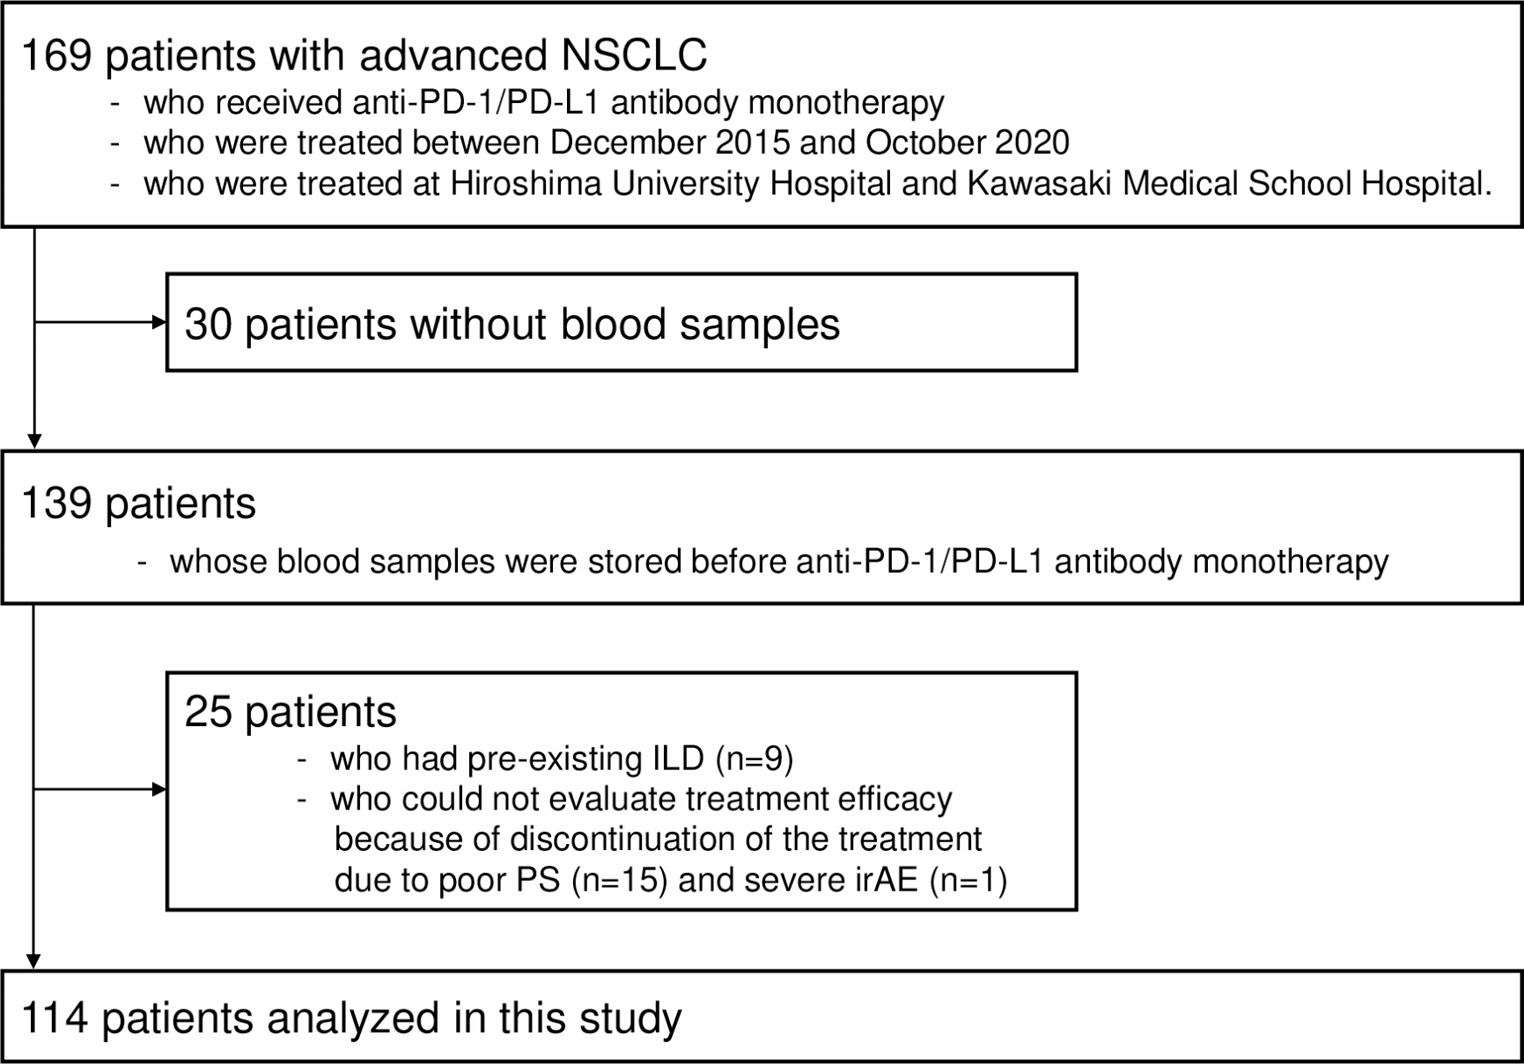
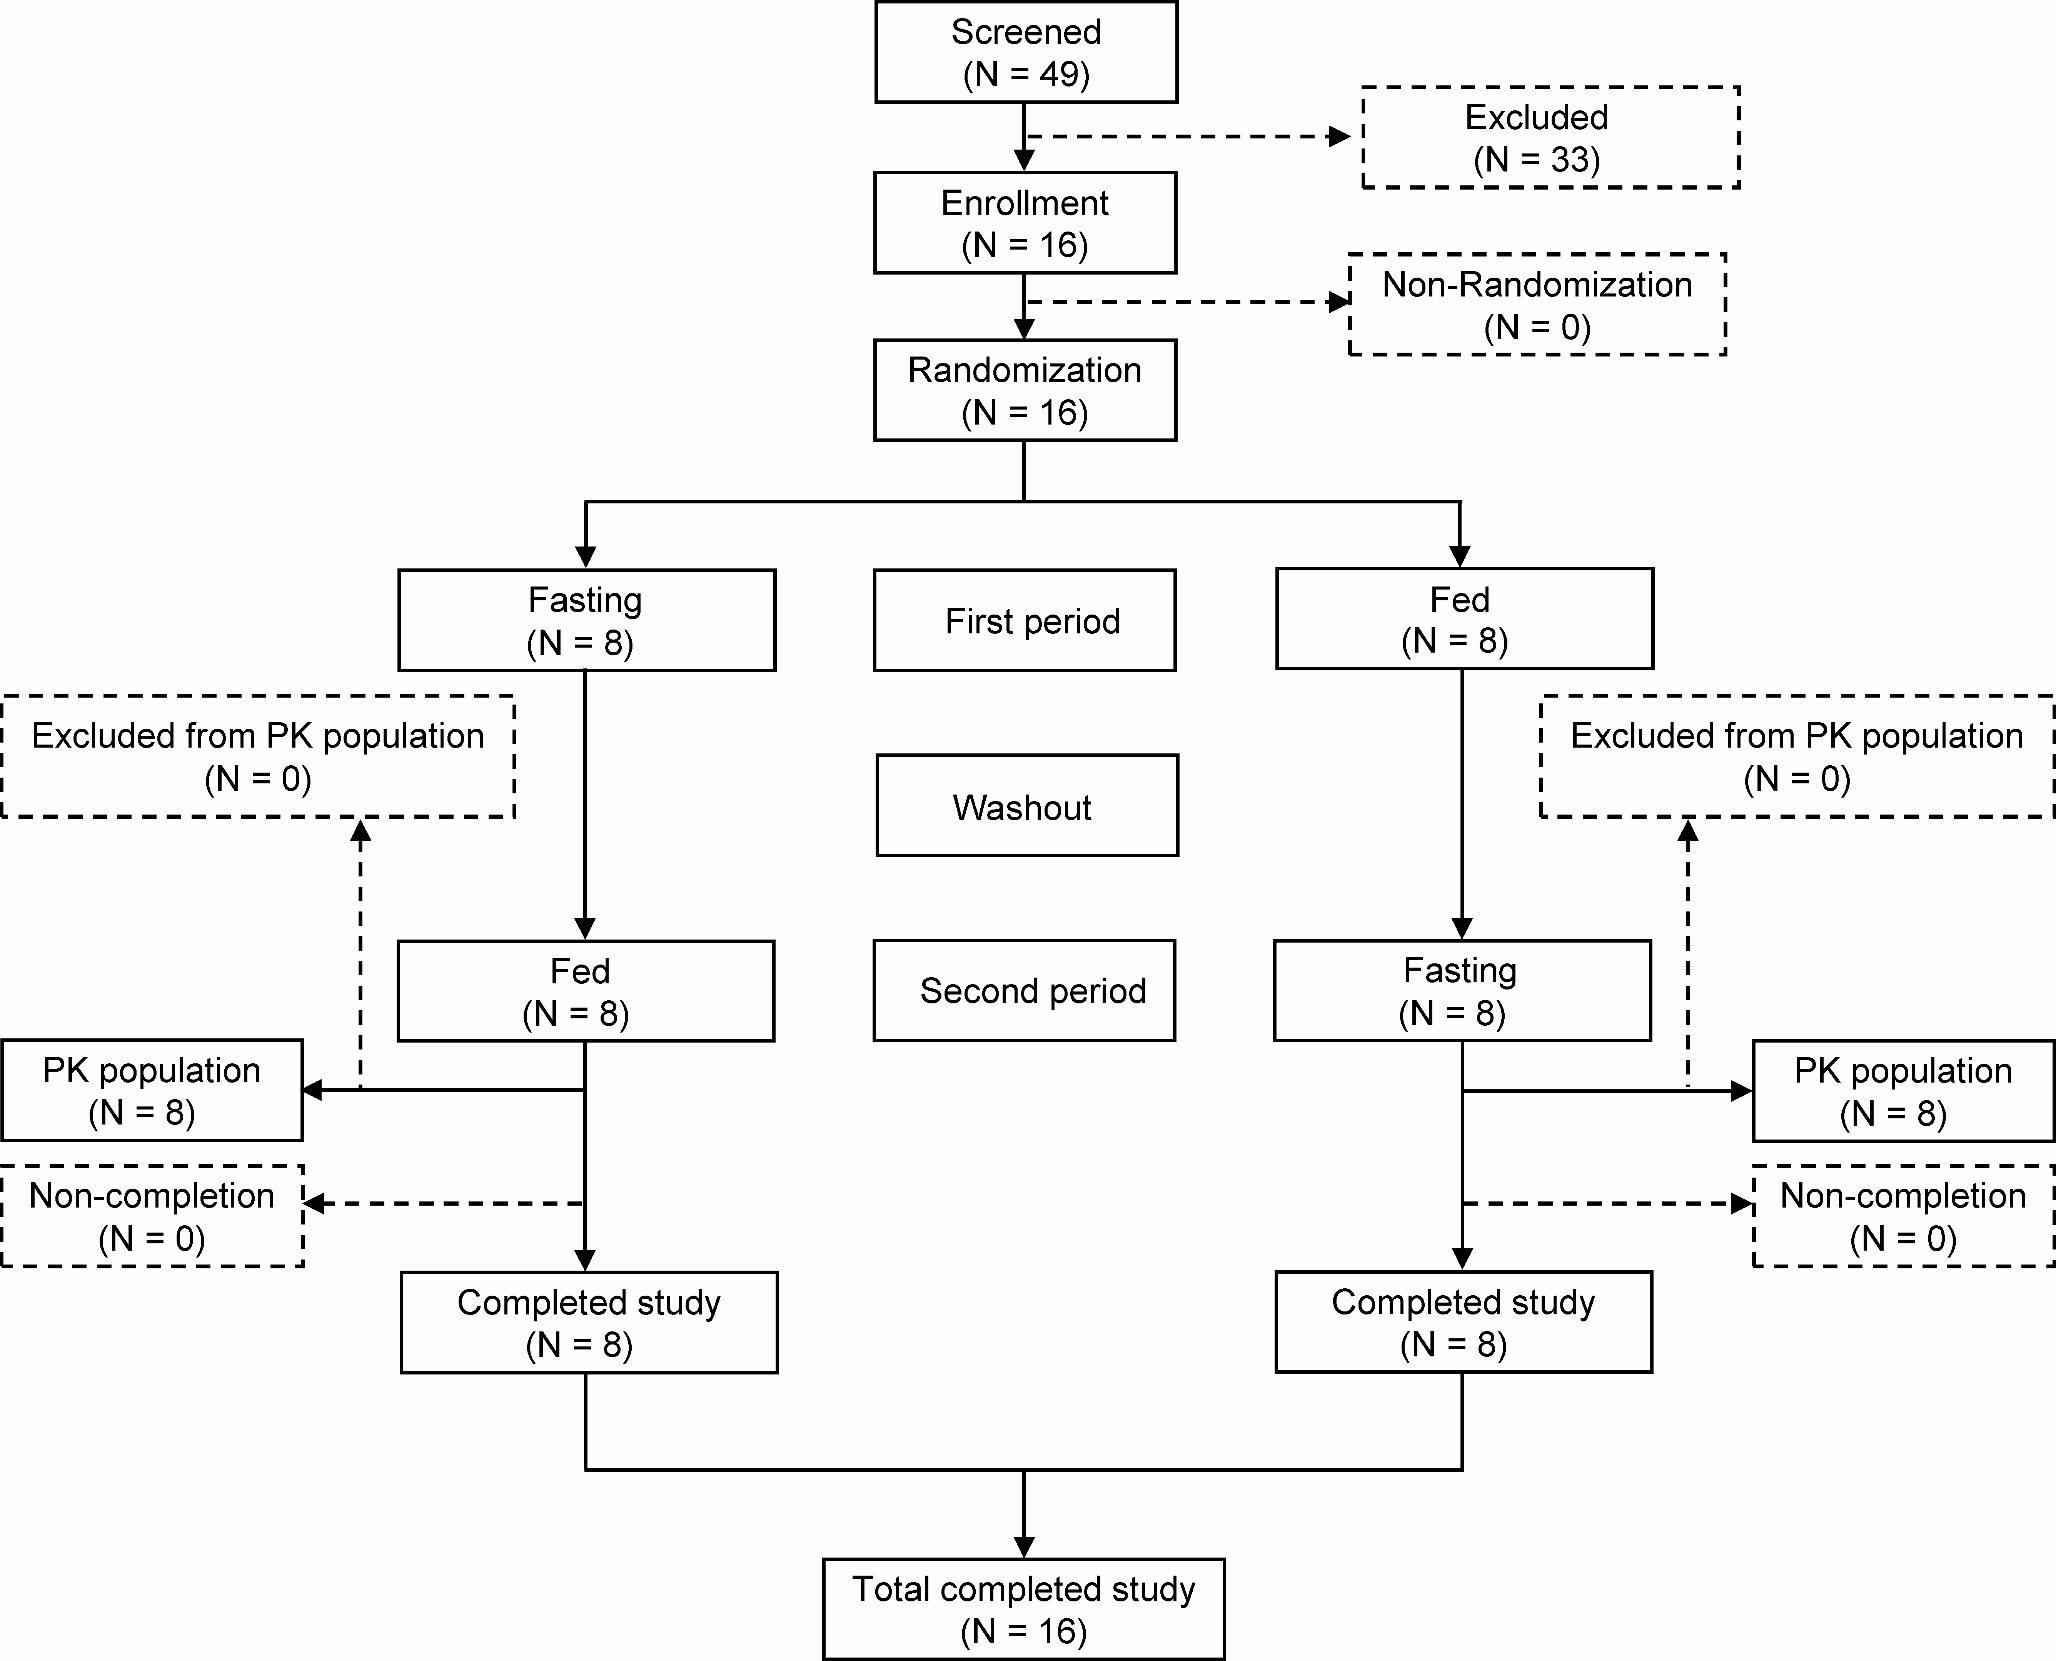

As shown in Fig. 1, this study consecutively enrolled 169 patients. Blood samples were collected and stored from 139 patients before treatment. Twenty-five patients with preexisting ILD or whose treatment efficacy could not be evaluated were excluded. Ultimately, 114 patients were included in this retrospective biomarker study.
Fig. 1
Flowchart of patient enrollment. This study consecutively included 169 advanced NSCLC patients who were treated with anti-PD-1/PD-L1 antibody monotherapy between December 2015 and October 2020 at two University Hospital. Among these, blood samples were prospectively stored before treatment from 139 patients. After excluding 25 patients who had pre-existing ILD or who could not evaluate treatment efficacy, 114 patients were analyzed in this biomarker study
Patient characteristicsThe baseline characteristics of the study population are shown in Table 1. The majority of patients were male and had a history of smoking. Of the 114 patients, 84 (74%) were histologically diagnosed with non-squamous NSCLC and 88 (77%) were treated with anti-PD-1/PD-L1 antibody monotherapy in second- or later-line settings. The percentage of patients with NSCLC with PD-L1 TPS ≥ 50% was 32% (36 out of 114 patients).
Table 1 Baseline characteristics (n = 114)Association between serum HMGB1 levels and ORRSerum HMGB1 levels were significantly higher in patients with complete response (CR) or partial response (PR) than that in the patients with stable disease (SD) or progressive disease (PD) (5.26 ng/mL [3.62–13.94] vs. 3.87 ng/mL [1.99–8.52], p = 0.02; Fig. 2). The optimal cut-off serum HMGB1 level for predicting treatment response as determined by ROC curve analysis (area under the curve = 0.636) was 3.83 ng/mL (Supplementary Fig. 1). The ORR was significantly higher in patients with higher levels of serum HMGB1 (≥ 3.83 ng/mL) than in those with lower levels of serum HMGB1 (40.9% vs. 18.7%, p = 0.01; Fig. 3a). In patients with NSCLC expressing PD-L1 TPS ≥ 50%, the ORR tended to be higher in the HMGB1high group than that in the HMGB1low group (60.0% vs. 22.2%, p = 0.06; Fig. 3b); however, there was no significant difference in ORR between the HMGB1high and HMGB1low groups in patients with NSCLC expressing PD-L1 TPS < 50% or unknown (29.3% vs. 16.2%, p = 0.17; Fig. 3c).
Fig. 2
Serum high-mobility group box 1 (HMGB1) levels based on the tumor response to anti-PD-1/PD-L1 antibody. Serum HMGB1 levels in patients with complete response (CR) or partial response (PR) were significantly higher than those in patients with stable disease (SD) or progressive disease (PD) (5.26 ng/ml [3.62–13.94] vs. 3.87 ng/ml [1.99–8.52], p = 0.02). Boxes represent the 25th to 75th percentiles; solid lines within the boxes show the median values; whiskers represent the 10th and 90th percentiles; the dots represent outliers. * p < 0.05 using the Mann-Whitney U test. CR, complete response; PR, partial response; SD, stable disease; PD, progressive disease; HMGB1, high-mobility group box 1
Fig. 3
Objective response rate (ORR) and progression free survival (PFS) stratified by serum levels of high mobility group box 1 (HMGB1). In the all subjects, the ORR in the patients with HMGB1 (≥ 3.83 ng/ml) was significantly higher than those without (40.9% vs. 18.7%, p = 0.01) (a). The same tendency was observed in the patients with NSCLC expressing PD-L1 TPS ≥ 50% (60.0% vs. 22.2%, p = 0.06) (b), but there was no significant difference in the ORR between the patients with and without HMGB1 (≥ 3.83 ng/ml) in the patients with NSCLC expressing PD-L1 TPS < 50% or unknown (29.3% vs. 16.2%, p = 0.17) (c). Kaplan–Meier curve analysis revealed that PFS was significantly longer in the patients with HMGB1high than those without (median PFS, 4.3 months vs. 2.3 months, p = 0.02) (d). The significant difference in PFS was also observed in the patients with NSCLC expressing PD-L1 TPS ≥ 50% (median PFS, 12.4 months vs. 4.4 months, p = 0.03) (e), but not in the patients with NSCLC expressing PD-L1 TPS < 50% or unknown (median PFS, 2.8 months vs. 2.3 months, p = 0.46) (f). * p < 0.05 using Pearson’s chi-square tests. ORR, objective response rate; HMGB1, high-mobility group box 1; NSCLC, non-small cell lung cancer; PD-L1, anti-programmed cell death ligand-1; TPS, tumor proportion score; PFS, progression free survival
Predictive accuracy of the combination of HMGB1 and PD-L1 TPS for anti-tumor responseAs shown in Table 2a, an HMGB1 cut-off level of 3.83 ng/mL provided a sensitivity of 75.0%, specificity of 50.0%, and positive likelihood ratio (LR) of 1.5 to predict the response to anti-PD-1/PD-L1 antibody monotherapy. High expression of PD-L1 TPS (≥ 50%) provided a sensitivity of 50.0%, specificity of 76.9%, and positive LR of 2.2. Additionally, the combination of HMGB1 and PD-L1 TPS provided higher specificity and positive LR than HMGB1 or PD-L1 alone; the combination provided a sensitivity of 41.7%, specificity of 87.2%, and a positive LR of 3.3. The ORR was the highest (60.0%) in patients with HMGB1 ≥ 3.83 and PD-L1 TPS ≥ 50% in the analyses (Table 2b).
Table 2 Association of tumor response with PD-L1 and HMGB1Correlation between serum HMGB1 levels and PFSOur study also revealed that higher serum HMGB1 level was associated with longer PFS. Kaplan-Meier curve analysis revealed that PFS in patients with higher serum HMGB1 levels (≥ 3.83 ng/mL) was significantly longer in comparison with that in patients with lower serum HMGB1 levels (< 3.83 ng/mL) (median PFS, 4.3 months vs. 2.3 months, p = 0.02; Fig. 3d).
The significant association between higher level of serum HMGB1 and longer PFS was also observed in patients with NSCLC expressing PD-L1 TPS ≥ 50% (median PFS, 12.4 months vs. 4.4 months, p = 0.03; Fig. 3e), but not in patients with NSCLC expressing PD-L1 TPS < 50% or unknown (median PFS, 2.8 months vs. 2.3 months, p = 0.46; Fig. 3f).
Univariate cox proportional hazards analysis revealed that higher levels of serum HMGB1 (≥ 3.83 ng/mL) was significantly associated with longer PFS in the entire cohort of patients (HR = 0.62, 95% CI: 0.41–0.94, p = 0.025; Table 3) and the patients with NSCLC expressing PD-L1 TPS ≥ 50% (HR = 0.41, 95% CI: 0.18–0.97, p = 0.042; Table 3). Additionally, multivariate analysis revealed a significant association only in the patients with NSCLC expressing PD-L1 TPS ≥ 50% (HR = 0.30, 95% CI: 0.12–0.76, p = 0.011; Table 3).
Table 3 Cox proportional hazard analysis to identify the significant factors prolonging PFS
Comments (0)