Population
Patients with malignant (n = 172) and non-malignant (n = 156) diseases treated with hematopoietic stem cell transplant (SCT) after conditioning with a busulfan-containing regimen at the Children’s Hospital of Philadelphia between Feb 2007 and May 2023 were included in this study if they had plasma busulfan concentrations monitored after their first dose of busulfan at the University of Pennsylvania Clinical Toxicology Laboratory. This retrospective study was reviewed by Penn Institutional Review Board and qualified for an IRB review exemption.
Data elements abstracted from each subject’s medical record are listed in Supplemental Table 1. Patient age was calculated from the date of birth and the date that the first dose of busulfan was administered. Laboratory values for assessing kidney and liver function were within the reference interval for essentially all subjects and, therefore, were not included as covariates in the population pharmacokinetic analyses.
Busulfan dosing and sampling schedule
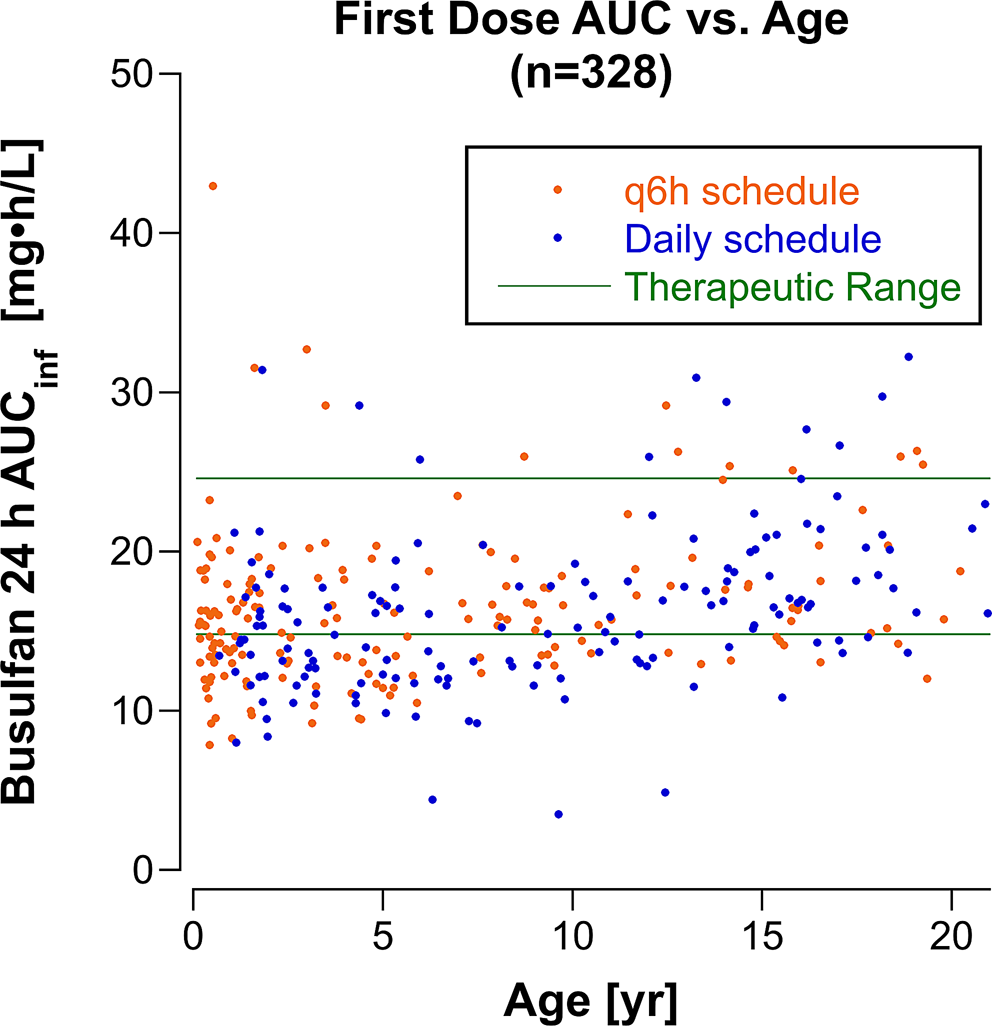
Busulfan was administered in divided doses over 4 days in most patients. Prior to 2016, busulfan was given in 16 divided doses every 6 h (q6h) over 96 h, and from 2016 onward busulfan was administered as four daily doses, except for seven children with neuroblastoma treated with four daily busulfan doses prior to 2016 and 22 infants < 12 months of age treated on the q6h dosing schedule after January, 2016. Twenty-nine subjects received fewer doses of busulfan administered over 48 h, including 26 patients (17 with non-malignant disorders) treated with 50% of the total dose administered in 8 divided doses q6h and three patients with Fanconi anemia treated with 20% of the standard dose administered every 12 h for 4 doses.
The starting dose of busulfan was scaled to body weight. The dose was 3.2 mg/kg/dose (12.8 mg/kg/course) infused over 3 h on the daily x 4 schedule and 0.8 mg/kg/dose (12.8 mg/kg/course) infused over 2 h on the q6h x 16 schedule. Thirty-eight children who were > 10 kg and < 48 months of age received a 25% higher dose (4 mg/kg/dose) on the daily schedule. Forty-four patients who were treated on the q6h schedule received 1 mg/kg/dose, including 36 patients who were > 10 kg and < 48 months old and 5 patients who were < 3 months old. The dose was scaled to adjusted ideal body weight (AIBW) in 9 patients who were obese. The actual administered doses were used for pharmacokinetic analyses.
Six or seven plasma samples were drawn after the first infusion of busulfan on the first day, and 6 plasma samples, including a pre-infusion sample and 5 post-infusion samples, were drawn on days 2 and 3, if necessary. Supplemental Table 2 lists the sampling times for the daily and q6h dosing schedules. The actual sample times for each patient were used for pharmacokinetic analyses.
The busulfan dose was adjusted to achieve an AUCinf (AUC extrapolated to infinity) between 3600 and 6000 µM•min (14.8 and 24.6 mg•h/L) assuming a linear relationship between busulfan dose and busulfan AUCinf. Most patients who had dose adjustments were monitored after the first busulfan infusion on day 2 and after the first busulfan infusion on day 3, if a second dose adjustment was required on day 2, to ensure that the busulfan AUCinf was within the therapeutic range.
Busulfan assay
Plasma samples were analyzed for busulfan using a gas chromatography/mass spectrometry method with selected ion monitoring as previously described [11]. Busulfan concentrations were reported as ng/mL.
Pharmacokinetic analysis
For clinical purposes, the busulfan AUCinf was estimated in real time by fitting a one-compartment model with first-order elimination to the busulfan concentration-time data using Phoenix WinNonlin, versions 7 and 8 (Certara, Princeton, NJ) in compliance with the vendor’s ‘Acceptable Use Policy.’ AUCs for all monitored doses were recalculated using the trapezoidal rule in Phoenix’s NCA module and were in close agreement (mean difference 1.7%) with the clinically reported values. We use the harmonized busulfan plasma exposure unit (mg•h/L) for reporting AUCinf [12]. For population pharmacokinetic modeling, we used Phoenix NLME v.8.3 (Certara USA, Inc, Princeton, NJ). Population pharmacokinetic analyses used a one-compartment model with first-order elimination, parameterized with clearance (CL) and volume of distribution (V). This model has been used in 78% of prior population pharmacokinetic models for busulfan [2]. Supplemental Table 3 lists the 20 model fits performed. The actual dose was input as ng, ng/kg, or ng/m2, and the dose per kg and dose per m2 were calculated from each patient’s actual dose and their pre-treatment weight and BSA. A multiplicative random error model and the FOCE-ELS (First-Order Conditional Estimation, Extended Least Squares) algorithm in the Simple run mode were used for all population pharmacokinetic model fits. The Covariate Search Stepwise run mode was used to evaluate body weight and BSA as covariates for V and CL. Covariates were normalized to median values of BSA (0.81 m2) and body weight (20.5 kg). -2•log likelihood was the objective function used to discriminate among scenarios, and the p-value to add a covariate was 0.01 and to remove a covariate was the p-value was 0.001. Goodness of fit of models was assessed from Phoenix log plots of measured vs. predicted individual concentrations (log DV vs. log iPRED) and from conditional weighted residual plots (CWRES). A bootstrap analysis with 1,000 samples and a maximum of 10 tries was performed with the final model incorporating covariates to test robustness of the model. Individual patient parameters (Vi and CLi) were obtained from Phoenix’s Post Hoc analysis table. Individual parameters are derived from the population typical values of the parameters (tvCL and tvV), which represent the fixed effects, and the post hoc values of the random effects (hV and hCL) with the equations:
$$\:_=tvV\cdot\:^}\:\text\text\text\:_=tvCL\cdot\:^}$$
.
Busulfan AUCinfs were simulated for each patient for BSA-scaled doses of 100 mg/m2. For patients with a BSA < 0.5 m2, AUCinfs were also simulated using a dose taken from a BSA-banded infant dosing table (Table 1). AUCs were calculated using the equation:
The BSA-banded infant dosing table was developed by grouping patients with a BSA < 0.5 m2 into bands at 0.05 m2 increments and estimating the dose (in mg) required to achieve a busulfan AUCinf in the middle of the therapeutic range using the patients’ individual CLis (Dosei= [desired AUC]•CLi) and taking the average of Dosei for each BSA band.


Comments (0)