
Remember me


As has been previously defined, ‘epigenes’ are a broad class of genes which are recruited to specific genomic regions to facilitate modification and maintenance of epigenetic state [1, 28]. These epigenetic-related events often require the binding of multiple distinct proteins into larger complexes that often modulate: where in the genome the epigenes' effect is targeted [29], what modification will be added [30,31,32], and what signals the epigene will respond to [33,34,35]. In our previous work [1], we curated epigenes based on the ability of protein-coding human genes to influence the epigenome of a cell, while excluding histone-coding and protamine-coding genes [28], resulting in a list of 720 epigenes. While histone-coding genes are foundational to the epigenome and its regulation, and variant histone proteins are known to modulate various epigenetic processes [36], we argue for the conceptual distinction of epigenes as those involved in the regulation of epigenetic architecture apart from those which are the substrate of epigenetic architectures such as histones. Our separate treatment of the histones from epigenes also had a substantial technical basis, which is that accounting for histones in genetic analysis is notoriously complex as they have an extreme degree of gene redundancy, with multiple copies of genes existing encoding identical protein products [37, 38]. The genes we included in our epigene set encompass the more stringently defined chromatinopathy gene sets that make up the mendelian disorders of the epigenetic machinery [9], which are limited to proteins that function as readers, writers, erasers, remodelers and insulators or any combination of these. As histones are foundational for epigenomic structure, for various analyses we included these as an additional contrast set with the epigene set.
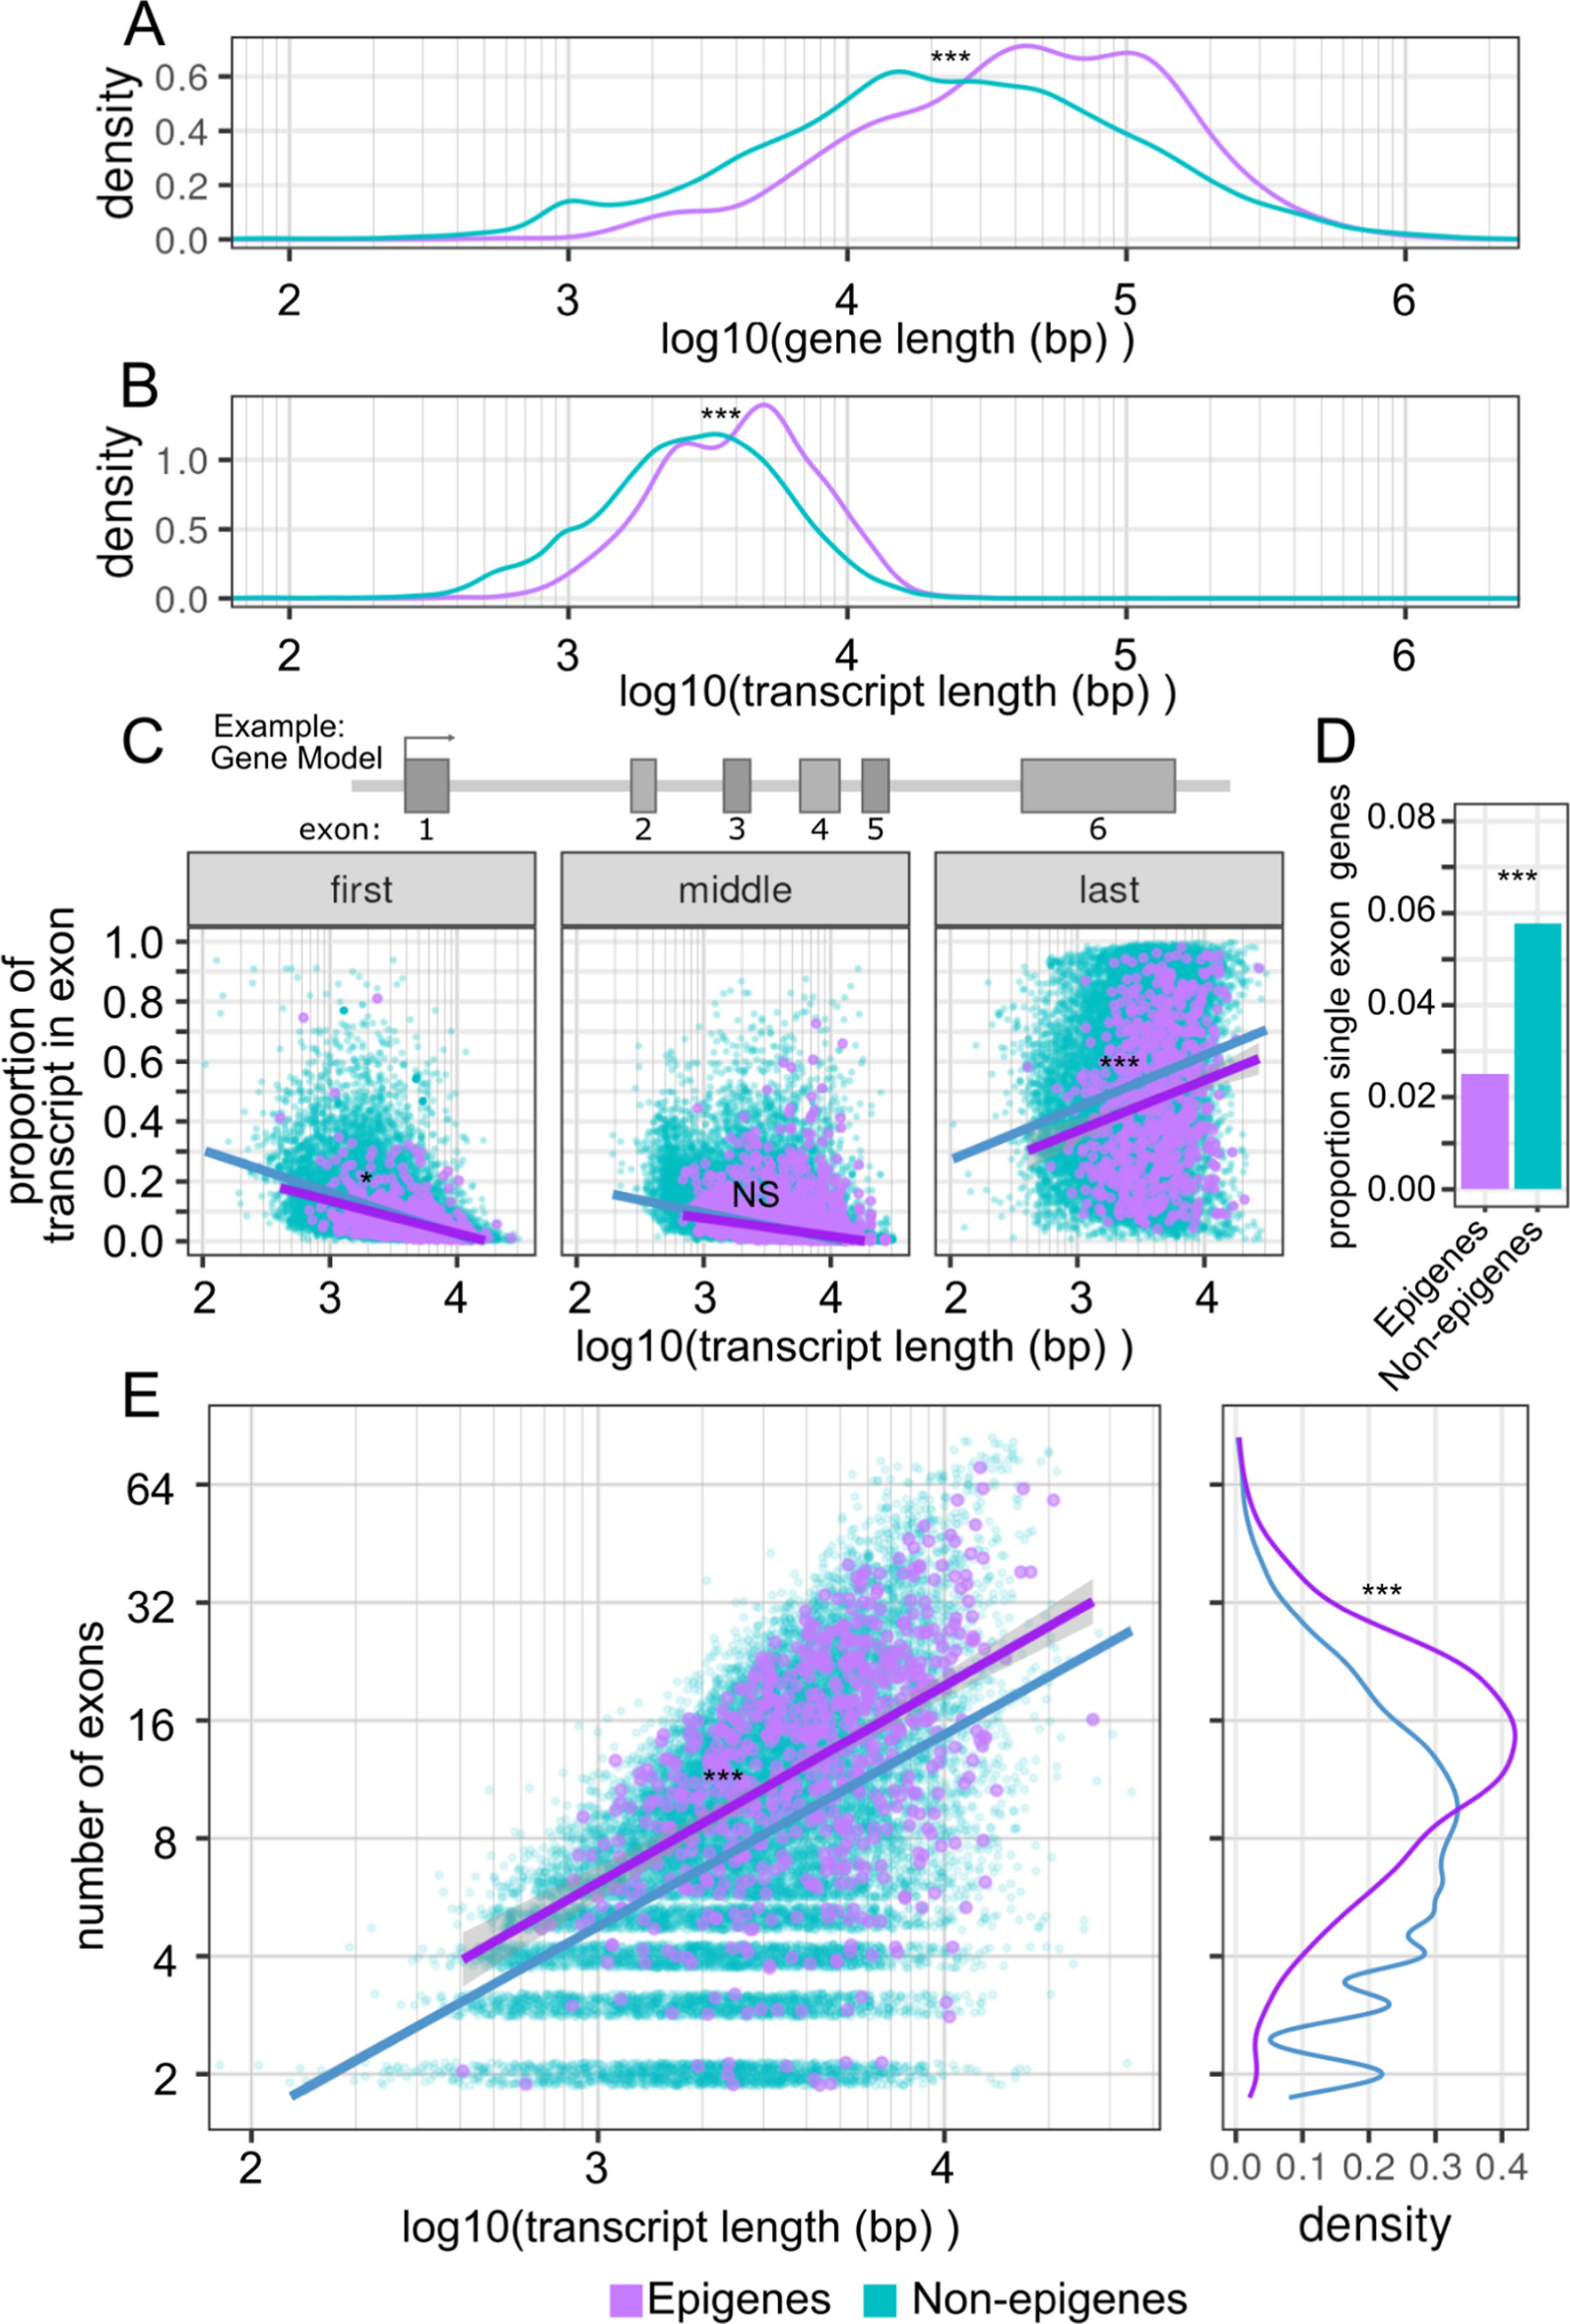
Epigenes are significantly longer genes, transcripts, and have a greater number of exonsWe began our characterization of epigenes by looking at the gene structure of epigenes. Structural annotations for genes were obtained from Ensembl [39, 40]. We observed that the gene size for epigenes was substantially longer compared with all non-epigenes (epigene: geometric mean = 41.4 kb, interquartile range (IQR) = 17.4 to 107.5 kb; non-epigene: geometric mean = 21.8 kb, IQR = 8.3 kb to 62.7 kb; p < 1e−5, permutation test) (Fig. 1A). Similarly, epigenes mRNA transcripts were also significantly longer than those of non-epigenes (epigene: geometric mean = 4.0 kb, IQR = 2.5 to 6.3 kb; non-epigene: geometric mean = 2.7 kb, IQR = 1.7 to 4.7 kb; p < 1e−5, permutation test) (Fig. 1B). This is in contrast to canonical and variant histones, which are small genes (geometric mean: 1.5 kb, IQR = 495 bp to 2.9 kb) that encode correspondingly small transcripts (geometric mean: 603 bp, IQR = 469 to 633 bp) (Figure S1A, B). As a note, we use the geometric mean for comparison where distributions are approximately log normal; the geometric mean being a measure of central tendency on the log scale [41].
Fig. 1
Epigenes are larger and have more exons than other genes. A Density distribution of gene lengths for epigenes and all other genes. B Density distribution of transcript lengths for epigenes and all other genes. C Transcript length plotted against the proportion of the transcript in each exon partitioning by first, middle, and last exons. Each point represents a single exon from a canonical transcript. Regression lines shown for epigene and all other genes groups. Genes encoded by a single exon were excluded. D Proportion of epigenes and other genes that are encoded by single exon genes. E Transcript length against exon count for each gene. Only the canonical transcript is considered. Regression lines shown for epigene and all other gene groups. Single exon genes were excluded. Significance level is indicated by asterisks: NS = not significant, * < 0.05, ** < 0.01, *** < 0.001
The increase in transcript length for epigenes was not attributable to an increase in exon size, and in fact we observed that in epigenes first and last exons tended to account for an overall smaller proportion of the transcript length than those same exons in non-epigenes (p = 2.7e−5, p = 0.11, p < 1e−5, permutation test. First, middle, last exon respectively) (Fig. 1C, Table S1). Single exon genes make up a disproportionately small minority of epigenes (2.5%, 18/720) compared to all non-epigenes (5.8%, 1117/19,329) (p < 2.2e−16, two-sample test of proportions) (Fig. 1D). This is in contrast to histones, the vast majority (86%, 86/100) of which are single exon genes (Figure S1C). We excluded single exon genes and histones from the analysis of exon structure. When we regressed the proportion of the transcript encoded by exons against overall transcript size, partitioned for "first',"middle", and "last" exons, we observed that the last exon had a strong positive correlation to overall transcript size (similar for both epigenes and non-epigenes; epigenes R2 = 0.69; non-epigenes R2 = 0.71, p = 0.36 permutation test), as has been previously reported [42].
As the exons of epigenes were not longer in size than for non-epigenes, we asked whether epigenes have an inflated number of exons for a given transcript size. Indeed when we regressed the number of exons against the overall transcript length we found this to be the case with epigenes having an increased number of exons relative to non-epigenes for a given transcript length (Fig. 1E).
Higher complexity of isoform expression for epigenesWe next investigated the potential functional consequence of this structural difference between epigenes and non-epigenes. Since epigenes have more exons for a given transcript length, we hypothesized that the increased exon count allows for larger possible combinations of exons and potentially increased transcriptional diversity of epigenes. The relation between exon structure, alternative splicing, and isoforms is illustrated in Fig. 2A.
Fig. 2
Epigenes have a greater number of expressed isoforms than other genes but a lower level of tissue specific patterns of relative isoform usage. (A) Toy diagram showing conceptual relation between exons, splice patterns, and isoforms for a single gene. (B) Density plot of the number of annotated isoforms associated with each gene. Single isoform genes were excluded. (C) Proportion of genes for which only a single isoform has been annotated. (D) Toy representation of entropy calculation. For each gene, the isoform proportion estimates are treated as a probability distribution on which entropy is calculated. Given a number of distinct isoforms, entropy is minimized when a single isoform dominates and is maximized as isoform expression proportions become uniform. See methods for precise method of calculation. (E) Number of annotated isoforms against mean intratissue entropy. Regression lines shown for epigene and all other genes groups. Density distribution of the entropy measure is shown to the right of the scatterplot. (F) Toy representation of Kullback-Leibler divergence, DKL(P||Q). For probability distribution P, DKL(P||Q) is minimized when P is equal to distribution Q, and increases as P becomes more dissimilar from Q. Here we define Q for a given gene as the weighted mean of all tissue or biosample isoform proportions. See methods for precise method of calculation. (G) Number of annotated isoforms against mean intertissue divergence as measured by Kullback-Leibler divergence. Regression lines shown for epigene and all other genes groups. Density distribution of the divergence measure is shown to the right of the scatterplot. Significance level is indicated by asterisks: NS not significant, *< 0.05, **< 0.01, ***< 0.001
In the Ensembl data, we could see that epigenes have an increased number of annotated isoforms (epigene: geometric mean = 8.8 isoforms, non-epigene: geometric mean = 6.5 isoforms, p < 1e−5 permutation test) (Fig. 2B) and a significantly smaller proportion of epigenes (3.1%, 22 of 720) were annotated as single-isoform genes compared to non-epigenes (17.7%, 2904 of 19,329) (p < 2.2e−16, 2-sample proportion test) (Fig. 2C). We wanted to further test whether there was evidence that these multiple transcripts contributed to the functional diversity of epigenes. For our isoform analyses, we excluded genes that were annotated as single isoform genes.
We next wanted to determine whether epigenes were expressing a greater diversity of isoforms compared with non-epigenes within a given tissue. For this analysis, we used transcript abundance estimates from the GTEx project [43, 44] which uses the RSEM algorithm [45] for transcript isoform abundance predictions from short-read RNA-seq data. We considered using long-read datasets to direct quantification of transcripts, but at this point, publicly available long-read data for large transcripts like epigenes are under-sequenced [46, 47]. We used two measures of functional diversity for isoform usage: (1) a measure of isoform diversity expressed within a biological context, e.g. intratissue or intracellular and (2) a measure of isoform diversity between distinct biological contexts. First, to measure functional diversity within tissue diversity, we used a weighted mean of intratissue entropies. Intratissue entropy balances, within a given tissue or biological sample, the number of expressed isoforms with their relative level of expression [48]. A basic intuition for the meaning of entropy here can be established by considering two behaviors of entropy. First, the minimum entropy occurs when only one isoform of a gene is expressed (Fig. 2D, entropy = 0 bits) while the maximum entropy for a given number of distinct isoforms occurs when all isoforms are equally expressed. This can be expressed in terms of bits, where bits are a unit of information in base 2, a syntax commonly used in computer science. For example, for equal expression of 4 distinct isoforms, entropy = 4 * −(¼ log2(¼)) = 2 bits, where bits are a unit of information in base 2. Entropy as measured in bits can also be considered as the average number of binary characters needed to represent a message made up of the results from a random draw of a gene's isoforms following their relative expression densities if we know a priori the number of draws that were made (e.g. if only one transcript, we need no additional information beyond that a transcript was drawn to know which transcript was pulled). Second, given the case where all isoforms of a gene are equally expressed, entropy will be greater for a gene with more isoforms than for a gene with fewer (see “Methods” section, Table S2).
For both epigenes and non-epigenes we found a strong correlation between the log number of annotated isoforms and mean intratissue entropy (R2 = 0.81 and R2 = 0.84 respectively), but no significant differences were identified between these two groups. Epigenes had a higher overall level of mean intratissue entropy compared to non-epigenes (epigenes: mean = 2.1 bits, sd = 0.92 bits; non-epigenes: mean = 1.7 bits, standard deviation (sd) = 0.94; p < 1e−5 permutation test) (Fig. 2E). For a gene with equal expression of all isoforms, these entropy values would correspond to 22.1 = 4.3 unique isoforms and 21.7 = 3.3 unique isoforms for epigenes and non-epigenes respectively. Thus within a given biological context, such as a tissue or cell, individual epigenes on average tend to express a greater diversity of isoforms than non-epigenes. Next we tested whether epigenes have a greater diversity of isoform expression profiles between different biological contexts than non-epigenes. For this, we used another measure based on entropy, Kulback-Leibler divergence (DKL) [49]. DKL measures the dissimilarity between two probability distributions; by using this divergence metric we can compare for a given gene the isoform proportions expressed in one tissue with the typical proportions expressed across all tissues. If all tissues have similar isoform profiles, the mean DKL will be relatively low, while if tissues have highly divergent profiles, the mean DKL will be relatively high (Fig. 2F, “Methods” section).
Given our previous observation that epigenes had an overall higher level of intratissue entropy compared to non-epigenes, we were somewhat surprised to find that epigenes had a slightly depressed mean intertissue divergence relative to non-epigenes (epigenes: mean DKL = 0.10, IQR = 0.05 to 0.13; non-epigenes: mean DKL = 0.13, IQR = 0.05 to 0.18; p < 1e−5 permutation test) (Fig. 2G). Together these observations indicate that within tissues epigenes tend to express a greater diversity of isoforms, but between different tissues, epigenes tend to express isoform profiles that are more similar than non-epigenes.
We looked at relations of intratissue entropy and intertissue divergence with the specificity of gene expression and the number of paralogs each gene has in the human genome (Figure S2). Regressing the entropy measures against expression specificity, epigene status, and the interaction term, we observed that the specificity of gene expression had a modest and significant negative association with intratissue entropy (R2 = 0.09) and a small but significant positive association with intertissue divergence (R2 = 0.02). This indicates that genes with more specific patterns of expression tend to have lower average within tissue isoform diversity while also having a higher average between tissue divergence. However the binary epigene label (i.e. is epigene and is not epigene) did not have a significant effect for either of these regression models. In similar regressions of these entropy measures against the number of paralogs we also observed small but significant negative and positive associations with intratissue entropy (R2 = 0.007) and intertissue divergence (R2 = 0.006) respectively, again with no significant effect associated with the epigene label or the interaction term.
Epigenes are associated with a large number of variable binding partnersIn addition to isoform diversity, interactions with other proteins add another potential layer of complexity to the function of epigenes. In multiprotein complexes, a protein may have constitutive interaction partners, without which they cannot carry out their core functions, as well as variable partners which can modulate the function of the overall complex. This situation is exemplified in Fig. 3A for the KAT6A (a.k.a. MOZ, MYST3) where KAT6A participates in three distinct complexes, each with ING5 and MEAF6, distinguished by the species of BRPF they incorporate, one of either BRPF1, BRPF2, or BRPF3 [27].
Fig. 3
Epigenes have an increased number of variable binding partners compared with non-epigenes. A Toy figure demonstrating how distinct complexes and variable partners are counted. B Proportion of genes associated with some complex. C For genes associated with a protein complex, empirical cumulative density function (eCDF) of the number of variable complex partners for epigenes (purple) and all other genes (teal green). Excluded are all genes not associated with any complex. D Density of mean number of distinct proteins in complexes associated with each gene. For example, in the KAT6A example, there are 3 complexes associated with KAT6A, each of which has 4 distinct proteins, so the mean would be 4 proteins per complex for KAT6A. E Density of number of variable partners associated with each gene, excluding genes associated with one or fewer complexes. Significance level is indicated by asterisks: NS = not significant, * < 0.05, ** < 0.01, *** < 0.001
To investigate epigene complexes, we pulled annotated protein complex data from the EMBL-EBI Complex Portal which includes a curated list of protein complexes which have experimental evidence for physical binding, have been reconstituted in vitro, and which have some demonstrable molecular function [50, 51]. Compared to non-epigenes, epigenes are much more likely to be associated with at least one unique multiprotein complex (45% for epigenes; 13% for non-epigenes; p < 2.2e−16, 2-sample test of proportions) (Fig. 3B). Of genes that are known to associate in multiprotein complexes, epigenes tend to associate with a larger number of distinct complex species. For instance 65% of epigenes associated with a complex associate with more than one distinct complex compared to only 33% for non-epigenes, and 28% of epigenes participate in at least 4 unique complexes whereas the same is true for only about 5% of non-epigenes that exist in multiprotein complexes (Fig. 3C).
Related to the number of distinct complexes a gene's products associate with is the number of variable complex partners the gene's product has. Epigenes tend to have an intermediate number of distinct complex members in their associated complexes (geometric mean = 7.2, sd = 2.2) similar to that for non-epigenes associated with complexes (geometric mean = 6.3, sd = 2.9) (p = 0.79 permutation test) (Fig. 3D, Table S3). While roughly similar in terms of the number of distinct proteins that compose their associated complexes, epigenes have a significantly larger number of variable complex partners. Even when looking only at the 65% of epigenes and 33% of all non-epigenes which are associated with more than one complex, the number of variable partners is substantially greater for epigenes (geometric mean = 4.3, sd = 3.7) compared to non-epigenes (geometric mean = 1.7, sd = 2.4) (p < 1e−5, permutation test) (Fig. 3E) compared to all non-epigenes. Much of the broad range of epigene targeting and function can be explained by the additional layer of protein complexes with significantly increased numbers of variable binding partners.
Extensive prevalence of disordered domains in epigenesMultiprotein complexes are just one of the types of functional aggregations that a gene's encoded products can contribute to, others, such as subcellular condensates and protein-RNA tethering, can also be critical to a gene's overall function. Recent studies have identified intrinsically disordered domains as critical to these roles enabling subnuclear organization of various epigenes [52] as well as interactions with RNAs [53, 54]. In contrast to structured regions of a protein, intrinsically disordered domains are characterized by a lack of rigid structure in their 3D organization (Fig. 4A). Based on the previously described potential for disordered domains to contribute to various facets of epigene function, such as in subnuclear organization or the targeting of specific genomic regions, we next tested whether disordered domains were common amongst epigenes.
Fig. 4
Epigenes are enriched in intrinsically disordered domains. A Toy diagram of disordered vs structured domains. While structured domains are relatively rigid, disordered domains are conformationally labile. B Proportion of genes with at least one disordered domain. C Proportion of protein that is annotated as belonging to a disordered domain. Each point is an individual gene which has at least one annotated disordered region. Regression lines shown for epigene and all other gene groups. Density of proportion of protein in disordered domain shown to the right of the scatterplot. Excludes all genes with no annotated disordered domains. D Density distribution of maximum disordered domain size for each protein with at least one annotated disordered region. Significance level is indicated by asterisks: NS = not significant, * < 0.05, ** < 0.01, *** < 0.001
To investigate disordered domains in epigene encoded proteins we pulled annotations from the UniProtKB resource [55, 56] in which disordered domain annotations are based on high confidence predictions from the MobiDB-Lite software [57]. In this dataset we observed that epigenes are more likely to contain a disordered domain than non-epigenes (83% epigenes; 55% non-epigenes; p < 2.2e−16, two-sample proportion test) (Fig. 4B). Additionally, of those genes which contain a disordered domain, a larger proportion of the epigene's encoded protein product falls in these domains (median = 22%, IQR = 13 to 36%) than for non-epigenes (median 16%, IQR 8 to 30%) (p < 1e−5, permutation test), and this proportion is more consistent between proteins of varying sizes whereas the expected proportion drops off more steeply for non-epigenes (Fig. 4C). Additionally, the largest contiguous disordered domain of epigenes tends to be substantially larger (median = 83 a.a., IQR = 47 a.a. to 144 a.a.) than that of non-epigenes (median = 51 a.a., IQR = 31 a.a. to 93 a.a.) (p < 1e−5, permutation test) (Fig. 4D, Table S4). It is widely known that nearly all histones contain a disordered tail domain. This domain, while shorter in absolute length than the disordered domain of most epigenes (median = 35 a.a., IQR = 22 a.a. to 45 a.a.) comprises a similar fraction of overall protein size (median = 28%, IQR = 17 to 31%) (Figure S3). These results are consistent with the overlap between the described functions of disordered domains and the processes which would intuitively seem important for epigenes to function, namely in enabling subnuclear organization of the protein complexes and in targeting protein complexes to specific regions of the genome via interactions with RNAs.
Multivariate analysis of disordered domain content and protein complex structureWe next looked at some additional relations of disordered domain content with protein and protein complex size features (Figure S4). The regression of the overall average protein complex size, measured as the average number of distinct protein subunits per complex for the protein, to protein disordered domain content did not show a significant relation for either epigenes or non-epigenes. However, there was a modest positive correlation between the number of variable binding partners and the proportion of a protein in disordered domains for non-epigenes which was inverse for epigenes where a modest negative correlation was observed.
Epigene associated disorders tend to follow dominant patterns of inheritanceHaving looked at some of the sources of functional diversity in the species and structure of epigene encoded products, we next wanted to relate our results to the clinical outcome of perturbed epigene function or loss of function. Previous studies have shown an enrichment of epigene mutations in autism [58] and congenital heart defects [59, 60]. Our previous work showed that 20.6% of epigenes (148/720) cause at least one monogenic developmental germline syndrome [1] and the number of disease associated epigenes is substantially larger than previous reports with more stringent definitions for this class of monogenic disorders. They are often referred to as chromatinopathies [1, 61, 62] or epigenetic disorders of mendelian machinery [63], but the lists of included genes and syndromes are more restricted to epigenetic readers, writers, erasers and movers. Given their importance in monogenic disease, we next assessed the zygosity of genetic variants required for disease.
The Online Mendelian Inheritance in Man (OMIM) database reports associations with mendelian diseases for 29% (206/720) of epigenes compared with 21% of non-epigenes (4065/19,329). (p = 1.4e−6, 2-sample proportion test) (Fig. 5A, Table S5). Notably, a substantial majority of epigene associated mendelian disorders follow a dominant pattern of inheritance (epigenes 140/206 or 68%; all non-epigenes 1599/4065 or 39%; p = 6e−16, two-sample proportion test) (Fig. 5B). Consistent with this trend, for those genes not associated with any mendelian disease, epigenes are much more likely to have a high probability of loss of function intolerance (pLI), indicating probability of dominant-like deleterious effects upon loss of a single copy of the gene (pLI > 0.9: 229/514 or 45% for epigenes; 1809/15,264 or 12% for non-epigenes; p < 2.2e−16 two-sample proportion test) (Fig. 5C). Conversely, epigenes' associated disorders are less likely to follow a recessive inheritance pattern (epigenes 81/206 39%; non-epigenes 2959/4065 73%; p < 2.2e−16 two-sample proportion test) (Fig. 5B). However, of those genes not associated with any mendelian disorder, a roughly similar probability of recessive effects of gene loss (pRec) are predicted (epigenes 104/514 or 20%; non-epigenes 2996/15,264 or 20%; p = 0.78 two-sample proportion test) (Fig. 5C). Together these patterns of inheritance suggest that epigene function is dosage sensitive with a single gene copy being insufficient to maintain the normal development and health of the organism.
Fig. 5
Epigene-associated monogenic disorders are characterized by dominant modes of inheritance and ubiquitous transcript expression profile across multiple body systems. A Proportion of genes associated with at least one mendelian disease. B Of genes associated with some mendelian disease, proportion associated with dominant and recessive modes of inheritance. C Of genes not associated with some mendelian disease, proportion associated with predicted dominant effects, pLI > 0.9, and predicted recessive effects, pRec > 0.9. D Of genes associated with some mendelian disease, proportion associated with some phenotype affecting the major body system indicated. E Center: Scatterplot of specificity of gene expression against number of body systems affected. Regression lines for epigenes and all other genes groups shown. Left margin: boxplot of number of major systems affected by each gene's associated diseases. Mean shown as diamond. Top margin: density distribution of specificity of gene expression. Significance level is indicated by asterisks: NS = not significant, * < 0.05, ** < 0.01, *** < 0.001
Histones genes in contrast remain largely unassociated with mendelian disease, with a few notable exceptions [64, 65]. Part of this may stem from the exceptional degree of genetic redundancy found in histones with each major histone having numerous genetic copies in the genome [38].
Multiorgan phenotypes of epigene-associated syndromesWe next looked at the organ and body systems affected in epigene associated syndromes. When looking at the prevalence of phenotypes affecting each major body system, as defined by the human phenotype ontology (see “Methods” section). We found that epigene-associated syndromes (a.k.a. chromatinopathies, disorders of the epigenetic machinery) were more likely than non-epigenes to affect multiple body systems, with the exception of defects in blood/blood forming tissues, and metabolism (Fig. 5D, Table S5). The body systems most commonly affected in epigene syndromes were the nervous system and the musculoskeletal system, each found in over 80% of epigenes-associated syndromes. This is consistent with previous studies and highlights the role of epigenes in energy-intensive organs. Among all non-epigenes, 68% and 67% are associated with syndromes affecting the nervous and musculoskeletal systems respectively (p = 1.2e−7 and p = 8.2e−7 respectively, two-sample proportion test, bonferroni corrected for 11 tests) (Fig. 5D). Overall, epigene associated syndromes affect a greater number of body systems compared with non-epigene associated syndromes (p < 1e−5, permutation test) (Fig. 5E, left margin), which in part was reflective of the tendency of epigenes to be more ubiquitously expressed (p < 1e−5, permutation test) (Fig. 5E, top margin). However, even at similar levels of specificity of gene expression, the disorders associated with epigenes still had an inflated number of systems affected (Fig. 5E, center). Overall, the pervasive role of epigenes across multiple body systems cannot be entirely explained by their gene expression profile and likely is at least partially derived by their role in early developmental processes.
Epigenes expressed in early neurodevelopment can be modulated by repurposed drugsWe next examined the gene expression patterns of epigenes in the developing human brain using bulk RNA-seq data from BrainSpan [66] as detailed in Figure S5. Only genes with expression quantified in the original BrainSpan analysis were included for our analysis (711 of the 720 epigenes, and 18,191 of 19,329 non-epigenes). From this analysis, we found that a majority of epigenes (693 of 711 mapped epigenes were expressed in at least one tissue and time point at 1 TPM or greater) were expressed in the human brain at some point between development through adulthood. Clustering epigenes based on their expression over prenatal brain development revealed that epigenes exhibit dynamic gene expression that increase, decrease, or oscillate overtime across brain regions (Figure S6A). We filtered the BrainSpan data to focus on gene expression occurring during prenatal development, which spanned post conception weeks 8–40 after filtering, to uncover how epigene expression varies along side genes critical for human fetal neurodevelopmental since pathogenic mutations in epigenes are enriched in pediatric syndromes characterized by intellectual disability and autism [67, 68]. Upon performing clustering analyses on the expression of epigene and non-epigene over prenatal brain development—we identified 97 metaclusters (MCs) composed of multiple gene clusters that display consistent co-expression across the developing human fetal brain (Figure S6A). Some of the most notable MCs were MC1, MC8, MC17, MC25, MC58, and MC92—which all decreased in expression across time as the genes in these MCs were significantly overrepresented in gene ontology (GO) terms related to cell cycle dynamics and proliferation (Figure S6B). Another notable set of MCs were those which increased gene expression over early brain development and were enriched for GO-terms relating to neuro
Comments (0)