
Remember me


BLM-induced fibrosis in mouse models is widely recognized as the gold standard in preclinical studies due to its histological similarities to human lung fibrosis [11, 42]. Consequently, we have chosen to dissect the epigenomic and chromatin dynamics of this model to gain a deeper understanding of the molecular mechanisms underlying fibrotic progression. The histopathological assessment revealed that the BLM-treated mice exhibited marked alterations in lung architecture, characterized by increased collagen deposition and fibroblast proliferation, as evidenced by hematoxylin and eosin (H&E) and Masson’s trichrome staining. These findings were further corroborated by microcomputed tomography (Micro-CT) imaging, which provided a three-dimensional visualization of the lung structure, clearly delineating the decrease of aerated lung compartments and increase of dense fibrotic tissue (Fig. 1A). Our results indicated a significant increase in hydroxyproline levels in the BLM-treated group compared to the controls, confirming the presence of excessive collagen accumulation (Fig. 1B). Furthermore, we assessed the inflammatory component of the disease by analyzing the proportion of inflammatory cells in the bronchoalveolar lavage (BAL) fluid. The findings revealed an elevated percentage of inflammatory cells, including neutrophils and macrophages, in the BAL of BLM-treated mice, suggesting an ongoing inflammatory response that contributes to the fibrotic process (Fig. 1C).
Fig. 1
Pathological characteristics of BLM-induced model of lung fibrosis. (A) Representative H&E, Masson-stained lung sections and micro-CT images at d21 after BLM. More collagen deposition/fibrosis in the pulmonary parenchyma was found in the BLM-treated mice. (B) Right lung hydroxyproline contents. (C) white blood cell count in BALF
Mapping 3D chromatin conformation and identification of alternations in A/B compartment in BLM-induced PFIn order to investigate the alterations in chromatin architecture associated with BLM-induced lung fibrosis, Hi-C libraries were generated from three independent biological replicates of BLM-treated mice and two replicates of control mice. After stringent sequence quality filtering, approximately 119 million and 228 million valid contacts were obtained from the BLM-treated and control samples, respectively (Figure S1A). Within the Hi-C libraries, we observed no significant difference in the number of cis- and trans-interactions between the PBS and BLM groups. The ratio of cis- to trans-interactions indicated that approximately three-quarters of the interactions occurred within chromosomes, while the remaining quarter involved interactions between chromosomes (Figure S1B).
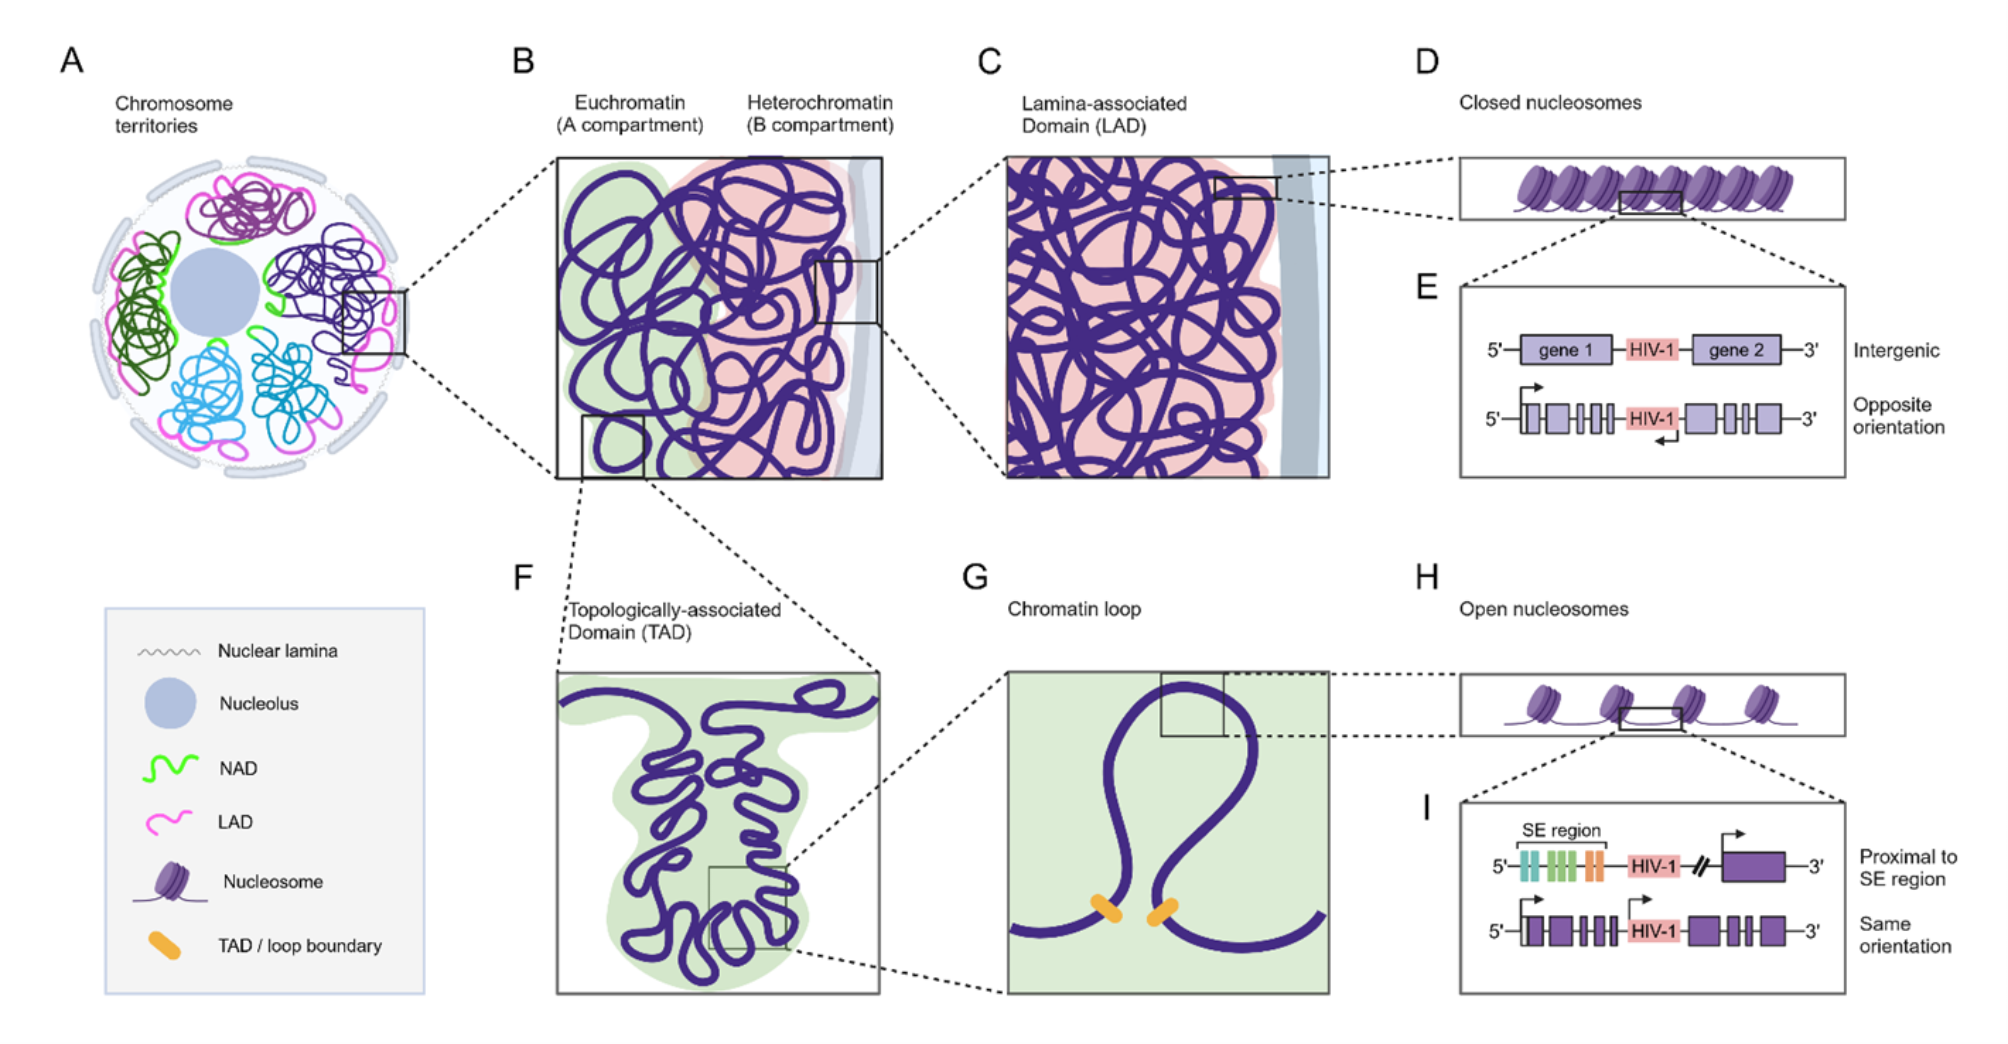
Heatmaps were utilized to represent the normalized Hi-C contact matrices, with each chromosome being compared to another. In these visualizations, a deeper shade of red denotes a greater frequency of interactions, whereas white regions imply a decreased frequency of such interactions (Fig. 2A-B). This analysis highlighted a pronounced prevalence of intra-chromosomal interactions over inter-chromosomal interactions (Fig. 2A-B and Figure S1B), echoing the established concept of “chromosome territories” observed in previous Hi-C data and chromosome imaging investigations [13]. The alternating pattern of high and low interaction frequencies across the heatmap suggests the existence of distinct chromatin compartments, likely corresponding to active (A) and inactive (B) chromatin in both the control and fibrosis groups (Fig. 2A, B). This compartmentalization reflects the functional organization of the genome, with active regions being more transcriptionally active and accessible.
Fig. 2
BLM-induced alterations in 3D chromatin architecture and compartmentalization in lung fibrosis. (A,B) Detailed heatmaps illustrating all-by-all chromatin interactions across the genome at a 500-kilobase resolution were produced for the control (A) and fibrotic (B) conditions. Chromosomes are displayed in numerical sequence from left to right and top to bottom, alongside a color scale representing the frequency of Hi-C interactions. The lower sections offer zoomed-in perspectives of chr9 at a 500-kb resolution, matching the upper sections. (C) The heatmap spans the entire genome, showcasing the log2 ratio comparisons of Hi-C interaction frequencies at a 500-kilobase resolution in fibrosis as opposed to the parental control. The log2 ratio values are indicated by the color gradient. The lower section of the image provides a zoomed-in perspective of chr9 at a 500-kb resolution, mirroring the area highlighted in the upper section. (D) The scatter plot showcases the transition rates of AB compartments between BLM and PBS treatments. The horizontal axis marks the discrepancies in conversion rates, and the vertical axis represents the log10(adjusted p-value). The data points are distinguished by color, with blue indicating BLM and red signifying PBS. (E, F) Histograms illustrate the distribution of BLM (blue) and PBS (red) across individual chromosomes. Each bar indicates the occurrence frequency of BLM versus PBS for a specific chromosome, with the x-axis showing chromosome number and the y-axis depicting the number of instances. (G-H) A representative image from the Integrated Genome Browser (IGV) illustrates the compartmentalization of chromosome 15 or 7, with open A-type compartments in red and closed B-type compartments in blue. Regions demonstrating stable (light shading) and differential (dark shading) compartmentalization are highlighted for clarity
We identified differences in interaction frequency between specific chromosome loci, as evidenced by color changes in the heatmap from blue in the control group to light red in the fibrosis group, indicating closer proximity and stronger interactions between these loci in the fibrosis group (Fig. 2C). Notably, the intra-chromosomal interaction matrices displayed a clear shift in interaction patterns, particularly evident in chromosome 9, demonstrating that BLM treatment can indeed alter chromatin compartmentalization (Fig. 2C).
The analysis of interaction matrices at a genome-wide level, contrasting the PBS and BLM groups, revealed a spectrum of changes in the interactions and compartmentalization of chromosomes. To gain further insights into the compartment switching associated with BLM-induced fibrosis, we classified the genome into A and B compartments at 40-kb and 80-kb resolutions. Principal component analysis (PCA) revealed distinct differences in eigenvalues between control and fibrosis groups, with samples clustering into two separate groups (Figure S1C). A total of 305 genomic regions were identified that switched from A compartments in the control samples to B compartments in the fibrosis samples, with chromosome 15 showing the highest number of these transitions (Fig. 2D, E). Conversely, 264 genomic regions exhibited the opposite switch from B compartments in the PBS group to A compartments in the BLM group, with the highest number of switches occurring on chromosome 6 (Fig. 2D, F). We also identified 10 contiguous genomic regions that switched from A compartments to B compartments and 5 contiguous regions that switched from B compartments to A compartments (Fig. 2G, H).
Further analysis revealed that 172 genes (133 protein-coding genes) transitioned from A compartments to B compartments, while 196 genes (154 protein-coding genes) transitioned from B compartments to A compartments during BLM-induced lung fibrosis (Figure S1D). Genes transitioning from B to A compartments were enriched in pathways related to stimulus response, signal transduction, amino sugar metabolism, immune system processes, and biological regulation (Figure S1E). Conversely, genes transitioning from A to B compartments were enriched in pathways related to cell adhesion and junctions, development and morphogenesis, signaling and regulation, cell regulation and differentiation, and vasculature development (Figure S1E).
ATAC-seq identifies differential chromatin accessibility in lung fibrosisChromatin remodeling plays a crucial role in coordinating gene transcription, prompting us to analyze chromatin accessibility in lung tissues from control and BLM-induced lung fibrosis mice using ATAC-seq. We obtained a total of 900,292,308 raw reads, which were filtered to yield 900,223,486 cleaned reads. Notably, > 82% of these reads mapped to the mouse reference genome (Figure S2A-C, Table S1). The libraries presented multimodal fragment length distributions, including both nucleosome-free and mononucleosome fragments, a signature of open chromatin (Figure S2D, Table S1). We identified 97,344 ATAC-seq peaks from the samples, primarily enriched 3 kb upstream and downstream of the transcription initiation site, indicating that open chromatin regions contribute to transcriptional regulation (Figure S2E, F). Additionally, 34,276 ATAC-seq consensus peaks were identified and distributed across all chromosomes (Fig. 3A). The genome-wide distribution of the consensus peaks revealed a predominant localization in promoter and intron regions (Fig. 3B), suggesting potential involvement in gene expression regulation through interaction with transcription start sites or long-range regulatory elements.
Fig. 3
The landscape of chromatin accessibility in normal and fibrotic mouse lung. (A) Genome-wide ATAC-seq consensus peaks in lung tissues. Each column represents one peak. The color represents the intensity of chromatin accessibility (red/more accessible and blue/less accessible). (B) Genomic distribution of consensus peaks across all samples. (C) Principal component analysis (PCA) of accessible loci as determined by ATAC-seq from control and fibrotic mice, either Sham operated and 21 days after intratracheal BLM delivery. Each dot represents an individual mouse. (D) Boxplots display principal component two across PBS samples (orange) and BLM samples (blue) for the study. (E) Volcano plot, visualizing the statistical difference of the differentially accessible regions. (F) Genomic distribution of differentially accessible regions between control and BLM-induced fibrotic mice. (G-H) Visualization of chromatin accessibility region of Mmp19 (G) and Bmp4 (H) in control and BLM-induced fibrotic mice. (I-J) Pathway enrichment analysis of differentially accessible regions between control and BLM-induced fibrotic mice. (K-L) De novo DNA motif analysis of differentially accessible chromatin sites between control and BLM-induced fibrotic mice
After performing dimension reduction using PCA, we observed the first principal component separated BLM and PBS samples (Fig. 3B-C), indicating data suitability for bioinformatic analysis. This analysis identified 1300 differentially accessible chromatin regions (DARs) with adjusted p-value < 0.05. Among these, 48% (620) exhibited reduced accessibility, while 52% (680) displayed increased accessibility in fibrosis compared to control (Fig. 3E, S2G). Strikingly, 65% of DARs were located within intragenic and intergenic regions, with approximately 35% found within promoters or untranslated regions (UTRs) (Fig. 3F, S2H). This suggests that these specific open regions may regulate gene expression at various stages by influencing either the gene body or promoter region. For example, Mmp19 exhibited significantly increased peak intensity in BLM group, with chromatin accessibility within its promoter region playing a crucial role in fibrogenesis [43] (Fig. 3G). In contrast, Bmp4, which promotes epithelial cell differentiation [44], showed a specific peak in control, with significant changes in chromatin accessibility within its gene body (Fig. 3H).
Pathway enrichment analysis of the 1300 DAR-related genes revealed that BLM treatment significantly upregulated chromatin accessibility of genes involved in TNF-alpha signaling via NF-kB, inflammatory response, IL-2/STAT5 signaling, cytokine production, p53 pathway, hypoxia, adipogenesis, and apoptosis (Fig. 3I). Conversely, BLM downregulated chromatin accessibility of genes related to signal transduction, pluripotency of stem cells, receptor Ser/Thr kinase signaling, RAC1 GTPase cycle, signaling by NOTCH1, TGF-beta signaling pathway, signaling by RTK, integration of energy metabolism, and Wnt signaling pathway (Fig. 3J).
To identify potential lung TFs of fibrosis-associated chromatin alterations, we performed motif enrichment analysis on the ATAC-seq datasets using Homer. This analysis revealed significant enrichment of motifs associated with AP-1 family members (Fosl2 and Atf1), interferon regulatory factor 4 (IRF1), nuclear factor kappa B (NF-kB), and Spi-B Transcription Factor (Spi-1/PU.1 Related/SpiB) in the BLM group (Fig. 3K). Conversely, motifs associated with TFs such as Sp1, NFYC, Foxj2, NFY, ZNF263, and ZNF711 were significantly enriched in the control group (Fig. 3L).
RNA-seq analysis identifies transcriptional signatures in the fibrotic lungsTo investigate gene expression patterns associated with BLM-induced lung fibrosis, we performed RNA-seq analysis on lung tissues from control and fibrosis groups at two time points, with three biological replicates per group. After processing, 668 million cleaned reads were retained, with over 94% achieving a Q30 quality score, indicating high data quality. The RNA-seq data shows that 95.4–96.9% of reads were aligned to the mm10 reference genome, as detailed in Table S2. PCA revealed distinct clustering of samples from the two groups, indicating significant differences in gene expression patterns (Fig. 4A). Correlation analysis further confirmed high similarity within each group (Fig. 4B). Using a general threshold of|log2 Fold change| ≥ 1 and adjusted p-value < 0.05, we identified 926 differentially expressed genes (DEGs), including 573 up-regulated genes and 353 down-regulated genes (Fig. 4C).
Fig. 4
RNA-seq analysis identifies unique transcriptional signatures in lungs of BLM-induced fibrotic mice. (A) Principal components analysis (PCA) of RNA-seq data from control and BLM-induced fibrotic mice. (B) Spearman correlation heatmap across all samples. (C) Volcano plot, visualizing the statistical difference of the differentially expression regions. (D-E) Pathway enrichment analysis of differentially expression regions between control and BLM-induced fibrotic mice. (F) Pathway activity inference of differentially expression regions between control and BLM-induced fibrotic mice. The observed activation of TNFa (G) and TGFb (H) is due to the fact that majority of its target genes with positive weights have positive t-values (1st quadrant), and the majority of the ones with negative weights have negative t-values (3d quadrant). (I) The dotplot illustrates the combined score and corresponding odds ratio for various signaling pathways, with a color gradient indicating the adjusted p-value. Yellow dots represent higher scores and odds ratios, while black dots indicate lower scores and ratios. (J) This GSEA plot presents a gene set enrichment analysis for the term “EPITHELIAL_MESENCHYMAL_TRANSITION,” focusing on the enrichment score and ranked metric across different ranks. The enrichment score shows a significant peak at the beginning, indicating high enrichment. (K) The barplot illustrates the activity levels of transcript factor in response to BLM, with each column representing a different transcript factor and each row indicating the activity level. Higher activity level is represented by red, while lower activity level is depicted in blue. (L) The TF-Gene co-regulatory network for Spi1, Spic, Jun and Mafb
Our pathway enrichment analysis showed BLM treatment upregulates immune-related pathways, including “Neutrophil Degranulation” and “Innate Immune System,” suggesting immune response disruption. It also induces “Epithelial Mesenchymal Transition” and impacts “Extracellular Matrix Organization,” affecting cell behavior and tissue homeostasis (Fig. 4D). BLM treatment reduced pathways like “Salivary secretion” and “Surfactant Metabolism Diseases,” indicating suppression of secretion and metabolic functions. Alterations in pathways like “cGMP-PKG signaling” highlight the intricate effects of BLM on cellular signaling (Fig. 4E).
To enhance the robustness of pathway enrichment analyses, we applied a multivariate linear model (MLM) incorporating pathway-specific gene weights from the PROGENy database [41]. We observed the activation of several immunologically relevant pathways in response to BLM treatment, including the TNFα, NFκB, and JAK-STAT signaling pathways (Fig. 4F). Within the TNF signaling cascade, key effectors such as TNF Alpha Induced Proteins (Tnfaip3), chemokines (Cxcl1 and Cxcl2), and proteases (Mmp12 and Ctss) exhibited significant upregulation following BLM exposure (Fig. 4G). The TGFβ pathway was substantially activated, leading to a marked increase in the expression of extracellular matrix genes, such as Fn1 and Col1a1 (Fig. 4H). In addition to validating the results obtained from traditional pathway enrichment analysis, the MLM further expanded our understanding of the molecular pathways implicated in BLM-induced lung fibrosis. Notably, the WNT pathway, which is known to regulate stem cell proliferation, as well as the VEGF and hypoxia pathways, which are crucial for angiogenesis, were identified as prominently activated in response to BLM treatment (Fig. 4F).
To further investigate the functional implications of the DEGs, we performed gene set enrichment analysis using the Hallmark gene sets from the MsigDB database [39]. This analysis revealed significant enrichment of pathways related to epithelial-to-mesenchymal transition (Fig. 4I-J), JAK-STAT signaling, angiogenesis, hypoxia, TNFα signaling, inflammatory response, apoptosis, and WNT signaling (Fig. 4I). These findings were in concordance with the results of our pathway enrichment analysis.
Transcriptome data can also be utilized to infer TF activity. Using the univariate linear model in the CollecTRI network [45], we predicted the enrichment scores of TFs and identified the top 30 active TFs, with 29 of them significantly activated following BLM treatment (Fig. 4K). Notably, the TFs exhibiting significant activation were consistent with those identified by motif enrichment analysis of ATAC-seq data, further validating our findings. The activated TFs included members of the AP-1 family (Jun, Fos, Jund, Fosb, Fosl2, etc.), Spi1 (Sfpi1), interferon regulatory factors (Irf8), PU.1-related factors (Spic), members of the Maf TF family (Mafb), ETS TF family members (Ets1, Ets2), hypoxia-associated factors (Hif1a), and TGFβ-associated factors (Smad4), among others (Fig. 4K). The regulatory interactions network revealed that Spi1 and Jun collaborate to regulate the expression of Fn1 and promote the expression of Csf1r in monocytes and Itgax, a marker of interstitial macrophages, suggesting the generation of monocyte-derived macrophages. Additionally, Mafb, Jun, and Spic collectively enhance the gene expression of Mmp12, with Jun regulating Col3a1 and Mafb regulating Mmp3 and Mmp13, highlighting the crucial role of matrix remodeling in the context of BLM-induced lung fibrosis (Fig. 4L).
Integrated analysis of gene expression, chromatin accessibility and chromosome conformation dataWhile the switch from A to B compartment in certain genomic regions was evident following BLM treatment, this compartmental reorganization did not correlate significantly with ATAC-seq measured tag density (Fig. 5A-B). The analysis of transcriptomes showed that the majority of DEGs within genomic regions shifted from the B to A chromatin compartment were predominantly upregulated, with significant higher log2 fold changes. Conversely, DEGs in genomic regions changed from A to B were mainly downregulated (Fig. 5C). Additionally, the expression of DEGs within compartments undergoing transition was observed to be positively correlated with the direction of the switch. In fibrosis, gene expression levels in compartments transitioning from state B to A were significantly higher in the BLM group compared to the PBS, with a median increase of 0.31 (BLM: 9.64, PBS: 9.33) and a mean increase of 0.22 (BLM: 8.50, PBS: 8.28). Conversely, for regions transitioning from state A to B, the BLM group exhibited lower expression levels than PBS, with a median decrease of 0.01 (BLM: 8.09, PBS: 8.10) and a mean decrease of 0.20 (BLM: 7.45, PBS: 7.65).
Fig. 5
Integrated analysis of gene expression, chromatin accessibility and chromosome conformation data. The profiles showing the normalized ATAC-seq tag density surrounding the center of the regions of A to B (A) and B to A (B) across a genomic window of ± 2 kb in mice with BLM-induced fibrosis, contrasted with the control. (C) The violin plot represents the log2 fold change (FC) between fibrosis and control for DEGs situated in regions associated with diverse compartmental switch categories. (D-E) Violin plot shows the expression levels [log2(FPKM + 1)] of DEGs found in regions associated with different compartmental switch categories. (F-G) Profiles illustrate the pattern of average PC1 values, as determined by the HOMER software (version 4.10), in the vicinity of the central areas of hyper- and hypo-accessible regions across a genomic span of ± 100 kb in BLM-induced fibrotic mice, contrasted with the control. (H) Scatter plot shows the correlation between the accessibility of chromatin and the expression of genes. ATAC-seq peaks with an adjusted p-value < 0.05 and genes found by RNA-seq with an adjusted p-value < 0.05 were plotted to analyze the variations in accessible peaks and gene expression. (I) Violin plot shows the log2 fold change (FC) between fibrosis and control for DEGs situated in regions linked to distinct accessible peaks. (J-K) Violin plot shows expression level [log2(FPKM + 1)] of DEGs residing at regions for different accessible peaks. (L-M) Profiles illustrate the distribution of average PC1 values surrounding the center of upregulated or downregulated genes across a genomic window of ± 100 kb in BLM-induced fibrotic mice compared to control. (N-O) The profiles present the normalized ATAC-seq tag density surrounding the center of the DEGs across a genomic window of ± 2 kb in BLM-induced fibrotic mice compared to control. (P) Venn diagram illustrates the distribution of gene categories in three different omics datasets. The overlapping areas represent genes common to multiple omics datasets, while distinct areas indicate unique genes within each dataset
Our research exhibited that the mean PC1 values adjacent to regions of heightened chromatin accessibility were significantly elevated in the fibrosis group compared to the control group. Conversely, for regions with decreased chromatin accessibility, the average PC1 values were lower in fibrosis compared to the control (Fig. 5F-G). We investigated whether changes in gene expression during fibrosis were directly caused by changes in chromatin structure that could impact transcription. By comparing gene expression (using RNA-seq with a cutoff of adjusted p < 0.05) with chromatin accessibility (using ATAC-seq with a cutoff of adjusted p < 0.05), we found that there was a moderate correlation between the changes in chromatin accessibility and gene expression (with a Spearman correlation coefficient of R = 0.63) (Fig. 5H). It demonstrated that the majority of DEGs located in hyper-accessible regions were up-regulated. Conversely, DEGs situated in hypo-accessible regions were mostly down-regulated (Fig. 5I). Additionally, the analysis revealed that the pattern of gene expression alterations within the DARs aligned positively with the direction of accessibility changes. Genes within the more open regions in fibrosis exhibited a marked elevation in expression relative to the control, with a reciprocal pattern observed in less open regions (Fig. 5J-K). The findings indicated a positive correlation between the level of chromatin accessibility and the expression of the related genes (p-value = 2.85e-53).
We further explored the chromatin structural activity and accessibility surrounding DEGs in response to BLM treatment. Intriguingly, among the 573 genes upregulated by BLM, the average PC1 value in the BLM group was significantly higher than that in the saline group (Fig. 5L), suggesting enhanced structural activity in these regions. Conversely, the average PC1 value was significantly lower in the BLM group compared to the saline group for the 353 downregulated genes (Fig. 5M), indicating reduced structural activity. However, ATAC-seq tag density, a measure of chromatin accessibility, did not show a consistent trend of difference between the BLM and saline groups for these DEGs (Fig. 5N-O).
To further delineate the interplay between chromatin compartmentalization, accessibility, and gene expression in the context of lung fibrosis, we sought to identify genes with coordinated alterations in all three aspects. By intersecting DARs and DEGs with regions exhibiting compartment switching, we identified 14 genes with robust multi-omics support (Fig. 5P; Table 1). These genes represent potential regulatory hubs in BLM-induced lung fibrosis.
Table 1 The 14 genes with concordant multi-omics support at the levels of differential expression, chromatin accessibility and chromatin structureCell-specific expression profiles of 14 genes identified by multi-omicsTo link the identified genes to specific cell types and pathogenic mechanisms, we re-analyzed scRNA-seq data from control and fibrotic mouse lungs [48]. Quality metrics, including unique molecular identifier (UMI) counts, detected genes per cell, and reads aligned to the mouse genome, were comparable across samples. However, the initial Uniform Manifold Approximation and Projection (UMAP) map revealed batch effects, with samples clustering by mouse rather than cell type (Figure S3A). After accounting for these batch effects, unsupervised clustering identified 23 distinct clusters corresponding to 20 major cell types, encompassing epithelial, endothelial, mesenchymal, and leukocyte lineages (Fig. 6A-B, S3B). Three clusters with fewer than 100 cells were excluded from further analysis. Additionally, an ambient RNA contamination subset and a small hematopoietic contamination subset were identified and excluded (Figure S3C-D). Notably, even rare cell types, such as lymphatic endothelial cells (152 cells), were identified, highlighting the robustness and accuracy of our computational workflow. Differential gene expression analysis was then used to identify cell type-specific marker genes with high expression levels within each cluster (Fig. 6C, Supplementary Data 1). These clusters were annotated based on known marker genes and literature, providing a comprehensive atlas of cell types in the mouse lung.
Fig. 6
Identifying pathogenic cell types for epigenetics and Chromatin Dynamics of lung fibrosis. (A) The UMAP plot illustrates the distribution of cells under two distinct conditions: saline and BLM. The blue dots represent cells treated with saline, while the orange dots indicate those treated with BLM. (B) The UMAP plot of various cell types, each represented by distinct colors. The legend on the right side lists these cell types and their corresponding color codes. (C) Violin plot shows the expression levels of the identified marker genes relative to each other. (D) Bubble plot reveals how 14 specific genes are expressed across various cell types, based on mouse single-cell RNA sequencing information. (E) Bubble plot shows a visual representation of how 14 genes are expressed in different cell types, as documented in the human lung cell atlas. The arrangement features cell types along the rows and genes along the columns. The bubble size is proportional to the number of cells expressing the gene, and the color gradient indicates the degree of gene expression. The UMAP plot showing cell specificity of PBX (F), LIFR (G) and IL7R (H) expression in human and mouse
Within the mouse lung single-cell atlas that we developed, the expression patterns of 14 genes, ascertained through the integration of differential expression, chromatin accessibility, and chromatin compartmentalization data, revealed distinct cell type-specific biases (Fig. 6D). Upon correlating our gene dataset with the lung cell information from the newly released Human Lung Cell Atlas (HLCA) [49], we observed a high degree of concordance in the cell-type specificity of gene expression (Fig. 6E). For example, Pbx1, a homeodomain TF essential for Fgf10 expression in lung mesenchyme, is preferentially expressed in fibroblasts [50] (Fig. 6F); Lifr, implicated in tumor angiogenesis [51], and Prickle2 are both highly expressed in endothelial cells (Fig. 6G, S3E); Il7r is predominantly found in T lymphocytes; Rbms3 shows high expression in non-immune cell types (Fig. 6H); Magi1 is highly expressed in lung parenchymal cells (Figure S3E); Nectin3 is enriched in AT1 and aCap cells (Figure S3E), underscoring its role in governing the air-blood barrier architecture; Gas2l3 is primarily expressed at high levels in macrophages (Figure S3E); Maf is highly expressed in lymphatic endothelial cells (Figure S3E); and Itga4 is highly expressed across immune cell populations (Figure S3E). Nevertheless, for four genes—Rbfox3, Tent5A, Xylt1, and Adam22—expression levels were insufficiently robust in both the human and mouse atlases to evaluate the consistency of their expression profiles (Fig. 6D-E).
Comments (0)