
Remember me


While FXN is found in all cells and is deficient in all cells in FRDA, its expression level varies in different neurons. In mouse, monkey, and human, cerebellar cortical FXN levels are high in PCs by immunofluorescence (Fig. 1). Lower levels are found in granule cells and other cells in the cerebellar cortex. The similar distribution of frataxin across species suggests that mice provide a suitable animal to study cerebellar circuit dysfunction from FXN deficiency.
Fig. 1
Frataxin expression in Purkinje cells is conserved across species. Representative micrographs of Human (A), Monkey (B), KIWT (C), and KIKO (D) tissues showing frataxin co-labeling with calbindin D28K or PSD93. (a-d) cerebellar sections stained with frataxin (green) (a’) human stained with PSD93 (red) (b’-d’) monkey and mice sections stained with calbindin D28 (Red) markers of Purkinje cells. (e-h) DAPI shows the presence of other cells in the GL = granule layer and ML = molecular layer. (e’-h’) Merged
Changes in Mitochondrial Protein Levels in the Cerebellum of FRDA MiceMitochondrial dysfunction is a major pathophysiological hallmark of FRDA. Thus, we assessed mitochondrial health by analyzing the expression levels of the mitochondrial proteins FXN, GRP75, TOMM20, ATP5A, UQCRC2, MTCO1, SDHB, NDUFB8, and TFAM in both FRDA mouse models (Fig. 2A). These proteins are important in the maintenance of mitochondrial homeostasis and biogenesis. Quantitative analysis of Western blots from FRDAkd (Fig. 2A & C; WT, FRDAkd: n = 7, 6; P < 0.0001, F(8, 99) = 5.56) and KIKO (Fig. 2B & D; KIWT, KIKO: n = 7, 7; P < 0.0001, F(8, 108) = 7.90) mice revealed significant changes in the expression level of these mitochondrial markers. In the FRDAkd mice, expression of FXN (WT = 0.68 ± 0.07, FRDAkd = 0.05 ± 0.02, P < 0.0001), TOMM20 (WT = 0.61 ± 0.13, FRDAkd = 0.28 ± 0.08; P = 0.013), and MTCO1 (WT = 1.28 ± 0.06, FRDAkd = 0.94 ± 0.13, P = 0.012) markedly decreased, whereas that of TFAM increased (WT = 0.82 ± 0.04, FRDAkd = 1.18 ± 0.08; P = 0.007). GRP75 (WT = 0.95 ± 0.01, FRDAkd = 0.83 ± 0.05; P = 0.392), ATP5A (WT = 1.17 ± 0.07, FRDAkd = 1.31 ± 0.11; P = 0.328), UQCRC2 (WT = 1.28 ± 0.11, FRDAkd = 1.44 ± 0.05; P = 0.256), SDHB (WT = 0.75 ± 0.07, FRDAkd = 0.88 ± 0.12; P = 0.357), and NDUFB8 (WT = 0.76 ± 0.10, FRDAkd = 0.79 ± 0.21; P = 0.851) were unaffected in the FRDAkd mice. As in the FRDAkd mice, the expression of FXN was reduced in KIKO mice (KIWT = 0.94 ± 0.08, KIKO = 0.55 ± 0.07, P = 0.003);similar reduced expression was also observed for GPR75 (KIWT = 1.37 ± 0.13, KIKO = 0.44 ± 0.13, P < 0.0001), UQCRC2 (KIWT = 0.99 ± 0.07, KIKO = 0.65 ± 0.04, P = 0.007), SDHB (WT = 0.88 ± 0.07, FRDAkd = 0.37 ± 0.02, P < 0.0001), NDUFB8 (KIWT = 0.67 ± 0.06, KIKO = 0.39 ± 0.06, P = 0.025), as well as TFAM (KIWT = 1.26 ± 0.13, KIKO = 0.97 ± 0.08, P = 0.022). By contrast, the expression level of MTCO1 (KIWT = 1.09 ± 0.09, KIKO = 1.44 ± 0.10, P = 0.005) significantly increased in those KIKO mice. TOMM20 (KIWT = 0.92 ± 0.13, KIKO = 0.88 ± 0.08, P = 0.806) and ATP5A (KIWT = 0.74 ± 0.05, KIKO = 0.58 ± 0.04, P = 0.199) were unaffected in the KIKO mice. Taken together, these results revealed significant changes in the expression of important mitochondrial proteins, albeit without a systematic or concordant pattern between the two FRDA mouse models.
Fig. 2
Mitochondrial proteins levels are dysregulated in the cerebellum of FRDA mice. (A & B) Representative micrograph of Western blot of mitochondrial biogenesis proteins from FRDAkd (A) mice induced for 16 weeks and 16–18 months old KIKO mice (B). (C & D) Quantitative analysis plot of FXN, GRP75, TOMM20, ATP5A, UQCRC2, MTCO1, SDHB, NDUFB8, and TFAM normalized to internal control actin. Data are given as mean ± SEM and analyzed by two-way ANOVA followed by Bonferroni post hoc test. *P < 0.05, **P < 0.01, ***P < 0.001, ****P < 0.0001; WT, FRDAkd: n = 7, 6, F(8, 99) = 5.56; KIWT, KIKO: n = 7 for both, F(8, 108) = 7.90
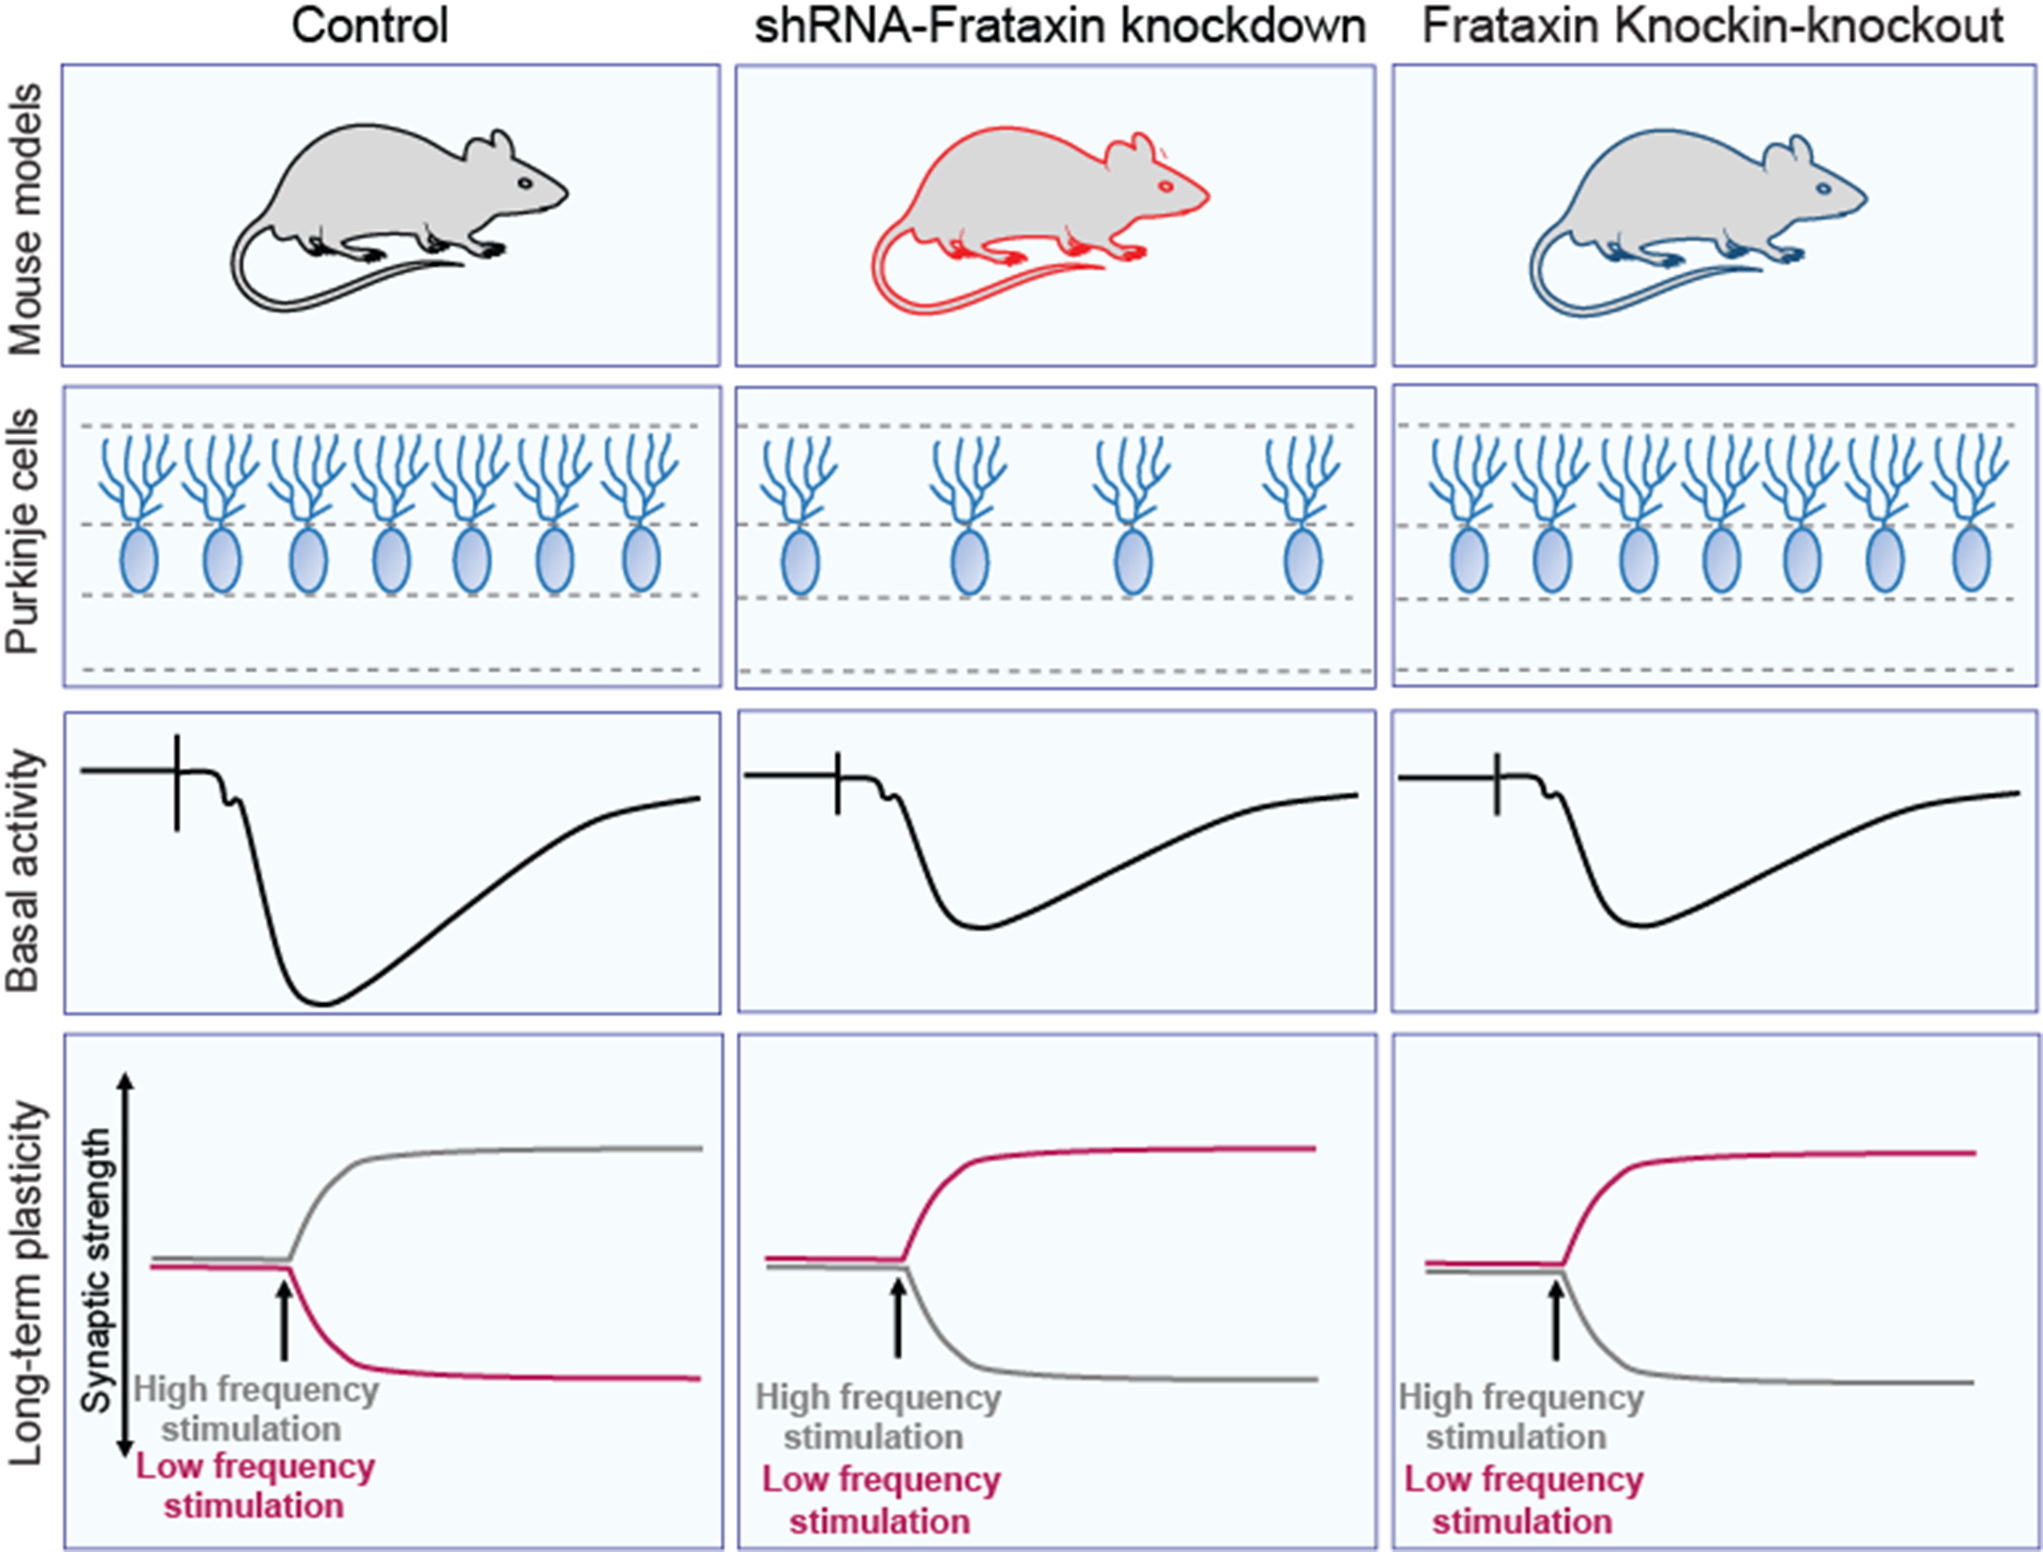
PC Survival in FRDA MiceWhile PC loss is traditionally low in human FRDA, FRDAkd mice treated with Dox for 18 weeks showed a moderate reduction in the number of cells expressing the PC marker mitochondrial α-F1‐ATP synthase [23]. We confirmed these observations in induced FRDAkd mice of the same age and treatment duration using CB, another marker of PCs (Fig. 3A-B; WT = 19.6 ± 0.73, FRDAkd = 14.6 ± 0. 0.66; P = 0.001, n = 5 for each genotype). In contrast, CB positive PCs in the KIKO mouse model at 15 months of age, as in human FRDA, are relatively preserved (Fig. 3C-D; WT = 17.7 ± 0.50, FRDAkd = 18.8 ± 0.85; P = 0.32, n = 3 for each genotype), showing that loss of FXN differentially influences PC survival in FRDAkd and KIKO mice.
Fig. 3
Disparate effect of FXN loss on Cerebellar Purkinje cell density. Representative micrographs of FRDAkd (A) and KIKO (C) in the cerebellum. (a, b) Control mice and FRDAkd (c, d) stained with calbindin D28K; KIWT (a’,b’) and KIKO (c’,d’) with calbindin D28 (red) (B) Quantification of calbindin D28-positive Purkinje neurons in control mice and FRDAkd mice and (D) in KIKO and KIWT mice. Approximately 30 images per mouse were analyzed by a blinded individual. Data are given as mean ± SEM and analyzed by 2-tailed unpaired Student’s t test. **P < 0.01, Control (uninduced FRDAkd), FRDAkd (Induced): n = 5 for both; KIWT, KIKO: n = 3 for both
Basal Synaptic Transmission ImpairmentsGiven the non-systematic changes in mitochondrial protein levels and the modest difference in PC density in the two mouse models, synaptic deficits at PCs might link the two models to disease phenotype. To that end, we recorded field synaptic transmission at the molecular layer of the cerebellar cortex in response to stimulation of PFs. Stimulation of these PFs always resulted in a very fast inward field excitatory postsynaptic potentials (fEPSPs) as previously noted at PF-PC synapses in the cerebellum [25, 26]. Examining the efficacy of basal synaptic transmission at increasing amplitude intensities, the fEPSP I-O relationship curve was significantly reduced in induced FRDAkd mice compared to controls (FRDAkd mice on normal chow), beginning at stimulus intensity of 180µA (Fig. 4A; Control, FRDAkd: n = 20/10, 24/12, slices/mice; P < 0.0001, (F(1, 654) = 93.6). Similarly, the I-O curve was reduced in KIKO mice compared to KIWT controls beginning at 160µA (Fig. 4B, KIWT, KIKO: n = 20/10, 30/15, slices/mice; P < 0.0001, F(1, 766) = 170.3). The paired-pulse ratio (PPR) of fEPSPs, a measure of presynaptic function and short-term plasticity, in both induced FRDAkd (Fig. 4C; Control, FRDAkd: n = 59/30, 46/23, slices/mice; P > 0.05, F(1, 618) = 0.14) and KIKO (Fig. 4D; KIWT, KIKO: n = 35/18, 42/21, slices/mice; P > 0.05, F(1, 450) = 5.72) mice was indistinguishable from controls at all the ISI times tested. Taken together, these results suggest both FRDA models exhibited concordant reduction in synaptic connectivity despite the likely absence of presynaptic dysfunction.
Fig. 4
Synaptic transmission at parallel fiber-Purkinje cell synapses is impaired in FRDA mice. (A) I-O relationship of molecular layer fEPSP in control (Uninduced FRDAkd) and induced FRDAkd (16–18 weeks) mice. *P < 0.05, **P < 0.01, ***<0.001, ****P < 0.0001; Control, FRDAKD: n = 20/10, 24/12, slices/mice; F(1, 654) = 93.6. Top traces: Representative waveforms of fEPSP at low and high stimulation amplitudes. (B) I-O relationship of molecular layer fEPSP in KIWT and KIKO mice (16–18 months old). **P < 0.01, ****P < 0.0001; KIWT, KIKO: n = 20/10, 30/15, slices/mice; F(1, 766) = 170.3. Top traces: Representative waveforms of fEPSP at low and high stimulation amplitudes. (C) Short-term plasticity of fEPSP measured at different paired-pulse intervals in control and induced FRDAkd mice. Control, FRDAkd: n = 59/30, 46/23, slices/mice; P > 0.05, F(1, 618) = 0.14. Top traces: Representative waveforms of fEPSP at 100ms paired-pulse interval. (D) Short-term plasticity of fEPSP measured at different paired-pulse intervals in KIWT and KIKO mice. KIWT, KIKO: n = 35/18, 42/21, slices/mice; P > 0.05, F(1, 450) = 5.72). Top traces: Representative waveforms of fEPSP at 100ms paired-pulse interval. Data are given as mean ± SEM and analyzed by Two-way ANOVA followed by Sidak post hoc test. I-O relationships were constructed by increasing stimulus intensity from 0-300µA in 20µA increment
Impairments of LTP and LTD Induced by a Short Interval Paired Pulse ProtocolLong-term plasticity mechanisms at PF-PC synapses, such as LTD and LTP, provide cellular correlates of cerebellar motor learning [27]. Therefore, we determined if PF-PC synapses in both KIKO and FRDAkd mice could undergo those long-term adaptive processes. A long HFS protocol (4 × 200 Hz with 5 min intervals) [28] delivered to the PF in the molecular layer of the cerebellum in uninduced FRDAkd mice reliably induced LTP, noted by comparison of averaged baseline fEPSP slope measured from last 10 min of a stable 30 min recording to the averaged fEPSP slope from the last 10 min of a 60 min post-tetanus time course (Figs. 5A-B and 75.23 ± 9.32%; P < 0.0001, n = 21/21, slices/mice). Unexpectedly, this HFS protocol induced a modest depression of the fEPSP slope in the FRDAkd mice rather than potentiation (Fig. 5C and 22.0 ± 8.96%; P = 0.021, n = 15/15, slices/mice). As expected from the opposite trajectories of the post-tetanus response in FRDAkd and control mice, the post-tetanus responses of the last 10 min were significantly reduced in the magnitude of the fEPSP slope in FRDAkd mice (Fig. 5D; -95.1 ± 13.4%; Control, FRDAkd: n = 21/21, 15/15, slices/mice; P < 0.0001). As in the un-induced FRDAkd mice, application of the HFS prominently potentiated the post-tetanus fEPSP response in KIWT mice (Figs. 5E-F and 78.7 ± 15.6%; P < 0.0001, n = 12/12, slices/mice). Application of the HFS protocol in KIKO mice significantly depressed of the fEPSP following tetanus as observed in the induced FRDAkd mice (Fig. 5G; -27.0 ± 4.2% below the baseline set at 100%; P < 0.0001, n = 14/14, slices/mice). Similarly, the post-tetanus response between KIWT and KIKO during the last 10 min of fEPSP timeline was significantly reduced in the magnitude of the fEPSP slope response in the KIKO mice (Fig. 5H; -105.8 ± 15.1%; KIWT, KIKO: n = 12/12, 14/14, slices/mice; P < 0.0001). These results suggest the FRDA models exhibited concordant defects in LTP despite the disparate effects on PC survival.
Fig. 5
Concordant impairments of LTP in FRDAkd and KIKO mice. (A) Time course of Parallel fiber-Purkinje cell synapse fEPSP slope 30 min before and 60 min after a train of high frequency stimulation LTP protocol in control and FRDAkd mice. Top traces: representative traces of fEPSP recorded at baseline and after LTP induction. (B, C) Histograms of percent changes in fEPSP following LTP induction in control (B) and FRDAkd (C) mice relative to baseline. (D) Comparative analysis of percent change in post-induction fEPSP magnitude between control and FRDAkd mice. (E) Time course of Parallel fiber-Purkinje cell synapse fEPSP slope 30 min before and 60 min after the train of high frequency stimulation LTP protocol in KIWT and KIKO mice. Top traces: representative traces of fEPSP recorded at baseline and after LTP induction. (F, G) Histograms of percent changes in fEPSP following LTP induction in KIWT (F) and KIKO (G) mice relative to baseline. (H) Comparative analysis of percent change in post-induction fEPSP magnitude between KIWT and KIKO mice. The last 10 min of baseline and/or post-induction timelines were used for all comparative analyses. *P < 0.05, ****P < 0.0001; Control, FRDAKD: n = 21/21, 15/15, slices/mice; KIWT, KIKO: n = 12/12, 14/14, slices/mice. Data are given as mean ± SEM and analyzed by the 2-tailed unpaired Student’s t tests
One Hertz stimulation of afferents with constant interstimulus intervals for 15 min (1 Hz, 900 stimuli) reliably induces LTD in cortical and hippocampal tissues of young animals [29]. However, in many studies, LTD is not as readily induced by such protocol in adult cortical or hippocampal structures [24]. Interestingly, application of PP-LFS protocols at relatively short and long duration intervals reliably induced LTD in young and adult cortical or hippocampal structures alike [24]. Here, we applied the short duration paired-pulse (50ms interval) protocol [24] to determine whether it can induce LTD in the cerebellum as well as whether loss of FXN impinges on its expression. This protocol is thought to induce an AMPA-receptor form of LTD [24] and can be assessed by delivering 900 paired-pulse stimuli to the PF in the molecular layer of the cerebellum at 1 Hz with interval of the paired stimuli set at 50ms (PP50ms-LFS) and recorded fEPSP near the PC-layer as in the basal synaptic and LTP experiments above. Using the same baseline to post-induction comparative approach as in the LTP experiments, PP50ms-LFS protocol reliably induced LTD in uninduced FRDAkd (Fig. 6A-B; -40.1 ± 5.72%; P < 0.0001, n = 15/15, slices/mice). However, this LFS protocol induced LTP in FRDAkd mice rather than LTD (Figs. 6C and 61.5 ± 12.7%; P < 0.0001, n = 12/12, slices/mice). The post-tetanus responses of the last 10 min in induced and uninduced FRDAkd mice were significantly potentiated in the magnitude of the fEPSP in the induced mice (Figs. 6D and 101.9 ± 12.9%; P < 0.0001, Control, FRDAkd: n = 15/15, 12/12 slices/mice). As expected, the PP50ms-LFS protocol induced a robust LTD in the KIWT mice (Fig. 6E-F; -39.71 ± 7.77%; P = 0.0001, n = 9/9, slices/mice). As in the induced FRDAkd mice, this LTD protocol induced a significant potentiation of the fEPSP in KIKO mice instead of a depression (Figs. 6G and 55.3 ± 20.8%; P = 0.015, n = 11/11, slices/mice). As expected from these observations, the post-tetanus response during the last 10 min of fEPSP timeline was significantly potentiated in the magnitude of the fEPSP slope response in KIKO mice compared to KIWT mice (Figs. 6H and 95.6 ± 24.1% below the baseline set at 100%; KIWT, KIKO: n = 9/9, 11/11, slices/mice; P = 0.0009).
Fig. 6
FRDA mice display similar impairments in AMPAR-dependent LTD. (A) Time course of Parallel fiber-Purkinje cell synapse fEPSP slope 30 min before and 60 min after a train of paired stimuli of 50ms interval delivered at 1 Hz for 15 min in control and FRDAkd mice. Top traces: representative traces of fEPSP recorded at baseline and after LTD induction. (B, C) Histograms of percent changes in fEPSP following LTD induction in control (B) and FRDAkd (C) mice relative to baseline. (D) Comparative analysis of percent change in post-induction fEPSP magnitude between control and FRDAkd mice. (E) Time course of Parallel fiber-Purkinje cell synapse fEPSP slope 30 min before and 60 min after the train of low frequency 50ms paired stimulation protocol in KIWT and KIKO mice. Top traces: representative traces of fEPSP recorded at baseline and after LTD induction. (F, G) Histograms of percent changes in fEPSP following LTD induction in KIWT (F) and KIKO (G) mice relative to baseline. (H) Comparative analysis of percent change in post-induction fEPSP magnitude between KIWT and KIKO mice. The last 10 min of baseline and/or post-induction timelines were used for all comparative analyses. *P < 0.05, ***P < 0.001, ****P < 0.0001; Control, FRDAkd: n = 15/15, 12/12, slices/mice; KIWT, KIKO: n = 9/9, 11/11, slices/mice. Data are given as mean ± SEM and analyzed by the 2-tailed unpaired Student’s t tests
Locus of the of Long-Term Plasticity Deficits and Involvement of CaMKIIDifferent forms of long-term plasticity, either entirely postsynaptically or presynaptically expressed, have been observed at PF-PC synapses [30]. To investigate the locus of the long-term plasticity defects in FRDA mice, we compared PPR at stimulus intervals ranging from 10-200ms before and after induction. The PPR of fEPSPs in FRDAkd did not change after induction with the LTP protocol at any of ISI tested in both FRDAkd (Fig. 7A-B; Pre-LTP at 100ms ISI: Control = 1.11 ± 0.066 vs. FRDAkd = 1.18 ± 0.053, Post LTP at 100ms interval: Control = 1.13 ± 0.072 vs. FRDAkd = 1.12 ± 0.065; Control, FRDAkd: n = 17/17, 15/15, slices/mice; P = 0.35, F(3, 360) = 1.10) and KIKO mice (Fig. 7C; Pre-LTP at 100ms ISI: KIWT = 1.20 ± 0.090 vs. KIKO = 1.29 ± 0.074, Post LTP at 100ms interval KIWT = 1.13 ± 0.099 vs. KIKO = 1.09 ± 0.039; KIWT, KIKO: n = 12/12, 14/14, slices/mice; P = 0.55, F(3, 287) = 0.71). Similarly, the PPR was not altered by induction with the PP50 LTD protocol at any of ISI tested in either FRDAkd (Fig. 7D-E; Pre-LTD at 100ms ISI: Control = 1.11 ± 0.050 vs. FRDAkd = 1.14 ± 0.073, Post LTD at 100ms interval Control = 1.02 ± 0.045 vs. FRDAkd = 1.13 ± 0.069; Control, FRDAkd: n = 14/14, 12/12, slices/mice; P = 0.14, F(3, 287) = 1.86) or KIKO mice (Fig. 7F; Pre-LTD at 100ms ISI: KIWT = 1.20 ± 0.069 vs. KIKO = 1.08 ± 0.064, Post LTD at 100ms ISI: KIWT = 1.20 ± 0.086 vs. KIKO = 1.09 ± 0.059; KIWT, KIKO: n = 9/9, 11/11, slices/mice; P = 0.78, F (3, 216) = 0.36). To gain further mechanistic insights into the defective plasticity in FRDA mice, we measured levels of CaMKII by Western blotting. Quantitative analysis of these blots revealed a non-significant trend toward lower levels of CaMKII protein in both FRDAkd (Fig. 7G & I; WT = 0.58 ± 0.09, FRDAkd = 0.37 ± 0.06; P = 0.099; WT, FRDAkd: n = 7, 6) and KIKO (Fig. 7H & J; KIWT = 1.98 ± 0.48, KIKO = 0.97 ± 0.19; P = 0.077, KIWT, KIKO: n = 7, 7) mice. Altogether, these results suggest that the PC or post-synaptic terminal represents the main locus of the long-term plasticity deficits without a significant change in CaMKII levels from whole cerebellar lysates.
Fig. 7
Postsynaptic localization of synaptic plasticity defects and preservation of CaMKII expression levels. (A) Example traces of paired fEPSPs before and after LTP induction in control (Top) and FRDAkd (Bottom) mice at 100ms stimulation intervals. (B) Paired-pulse ratio (fEPSP2/fEPSP1) measured at different intervals before and after LTP induction in control and FRDAkd mice. (C) Paired-pulse ratio (fEPSP2/fEPSP1) measured at different intervals before and after LTP induction in KIWT and KIKO mice. (D) Example traces of paired fEPSPs before and after LTD induction in control (Top) and FRDAkd (Bottom) mice at 100ms stimulation intervals. (E) Paired-pulse ratio (fEPSP2/fEPSP1) measured at different intervals before and after LTD induction in control and FRDAkd mice. (F) Paired-pulse ratio (fEPSP2/fEPSP1) measured at different intervals before and after LTD induction in KIWT and KIKO mice. For pre- and post-LTP PPR: Control, FRDAKD: n = 17/17, 15/15, slices/mice; KIWT, KIKO: n = 12/12, 14/14, slices/mice. For pre- and post-LTD PPR: Control, FRDAkd: n = 14/14, 12/12, slices/mice; KIWT, KIKO: n = 9/9, 11/11, slices/mice. (G, H) Representative micrograph of Western blot of CaMKII expression in FRDAkd (G) and KIKO (H). (I, J) Quantitative analysis plot of CaMKII levels in FRDAkd (I) and KIKO (J) mice normalized to internal control actin. Data are given as mean ± SEM and analyzed by analyzed by Two-way ANOVA (PPR data) or by the 2-tailed unpaired Student’s t tests (Western blotting data)
Impairment of LTD Induced by a Long Interval Paired Pulse ProtocolIn assessing an NMDA-receptor-based form of LTD [24], using the same baseline to post-induction comparative approach as above, PP200ms-LFS reliably induced LTD in uninduced FRDAkd mice (Fig. 8A-B; -25.9 ± 4.4%; P < 0.0001, n = 18/18, slices/mice). As observed for the PP50ms-LFS protocol, induced FRDAkd mice exhibited potentiation of the fEPSP slope magnitude rather than depression (Fig. 8C and 29.3 ± 13.1; P = 0.037, n = 11/11, slices/mice). The post-tetanic responses of the last 10 min showed a pronounced potentiation in the induced mice (Fig. 8D and 56.5 ± 11.5; P < 0.0001, Control, FRDAKD: n = 18/18, 11/11 slices/mice). As expected, application of the PP200ms-LFS protocol on slices from KIWT mice induced a pronounced depression of the fEPSP slope response (Fig. 8E-F; -37.1 ± 6.55; P < 0.0001, n = 9/9, slices/mice). Like in the induced FRDAkd mice, stimulation of PF with this protocol resulted in potentiation of the fEPSP slope magnitude instead of depression (Fig. 8G and 56.9 ± 17.6; P = 0.0060, n = 8/8, slices/mice). Finally, we compared the last 10 min of post-tetanus fEPSP slope magnitude between the genotypes and found a significant potentiation in the KIKO mice (Fig. 8H and 93.9 ± 17.9%; KIWT, KIKO: n = 9/9, 8/8, slices/mice; P < 0.0001). Altogether, loss of FXN in cerebellar circuits altered long-term plasticity, with LTP and LTD protocols in both FRDA models unexpectedly resulting in the opposite direction of plasticity compared to controls.
Fig. 8
FRDA mice display similar impairments in NMDA-dependent LTD. (A) Time course of Parallel fiber-Purkinje cell synapse fEPSP slope 30 min before and 60 min after a train of paired stimuli of 200ms interval delivered at 1 Hz for 15 min in control and FRDAkd mice. Top traces: representative traces of fEPSP recorded at baseline and after LTD induction. (B, C) Histograms of percent changes in fEPSP following LTD induction in control (B) and FRDAkd (C) mice relative to baseline. (D) Comparative analysis of percent change in post-induction fEPSP magnitude between control and FRDAkd mice. (E) Time course of Parallel fiber-Purkinje cell synapse fEPSP slope 30 min before and 60 min after the train of low frequency 200ms paired stimulation protocol in KIWT and KIKO mice. Top traces: representative traces of fEPSP recorded at baseline and after LTD induction. (F, G) Histograms of percent changes in fEPSP following LTD induction in KIWT (F) and KIKO (G) mice relative to baseline. (H) Comparative analysis of percent change in post-induction fEPSP magnitude between KIWT and KIKO mice. The last 10 min of baseline and/or post-induction timelines were used for all comparative analyses. *P < 0.05, **P < 0.01, ****P < 0.0001; Control, FRDAkd: n = 18/18, 11/11, slices/mice; KIWT, KIKO: n = 9/9, 8/8, slices/mice, slices/mice. Data are given as mean ± SEM and analyzed by analyzed by the 2-tailed unpaired Student’s t test
Comments (0)