
Remember me
Commercially available REF products and biosimilars of IFX, TRA, RTX, BEV, and ETN were examined. Although ETN is not an mAb but an Fc-fusion protein having a similar mode of action (MOA) to an anti-TNFα mAb, it was included in this study as a biopharmaceutical of medical importance. The information for the REF products and their biosimilars are listed with respect to the cell substrate used for manufacturing, excipients, and lot number (Tables S1–5; see the electronic supplementary material). The quality ranges calculated from the data of the REF products for each key quality attribute were used to evaluate the similarity to the REF product.
3.1 GlycosylationProtein glycosylation impacts the stability, pharmacokinetics, pharmacological activity, and immunogenicity of therapeutic proteins [21,22,23,24,25,26,27]. An IgG molecule contains two N-linked glycosylation sites in its Fc region. The major glycans on IgG include high mannose, hybrid, and biantennary complex types. They exhibit variety, such as the presence or absence of fucose as well as the number of mannose, terminal galactose, and sialic acid moieties [21, 22]. This heterogeneity may be affected by various factors, including the type of cell substrate (i.e., production cell) and manufacturing conditions [21, 28]. To characterize the glycosylation profile, we conducted an oligosaccharide analysis using 2-AB labeling and HILIC analysis, which is a typical analytical method for released N-glycans. The relative content of each glycan species in the products is shown in Fig. 1. The integrated contents of afucosylated, high mannose, galactosylated, and sialylated glycans are plotted in Fig. 2. The glycan terminology abbreviations used are shown in Fig. S1 (see the electronic supplementary material). One dot corresponds to the result of one lot. The representative chromatogram and glycan profile for each lot are shown in Figs. S2–5. For ETN, as the glycan profile of the vial product of ETN biosimilar 1 (ETN_BS1) was confirmed to be the same as that of the syringe type (Fig. S5), only the profile of the syringe product of ETN_BS1 is shown in Figs. 1 and 2.
Fig. 1
Glycosylation profile of REF and biosimilar products of IFX, TRA, RTX, BEV, and ETN. Mean % of total peak area and SD are plotted for each product. The abbreviations of each glycan are listed in Fig. S1. BEV bevacizumab, ETN etanercept, IFX infliximab, REF reference, RTX rituximab, TRA trastuzumab
Fig. 2
Comparison of the N-glycan profiles for IFX, TRA, RTX, BEV, and ETN. Scatter plots of afucosylated glycans % (G0 + G1 + G2), high mannose glycans % (Man 5), galactosylated glycans % (G1 + G1F + G2 + G2F), and sialylated glycans % are shown with the mean and SD. Dashed lines represent the quality ranges of the REF products. The abbreviations of each glycan are listed in Fig. S1. BEV bevacizumab, BS biosimilar, ETN etanercept, IFX infliximab, REF reference, RTX rituximab, TRA trastuzumab
The overall glycan profiles were significantly different between the REF and biosimilar products for IFX. IFX products are produced with two different cell substrates derived from different species. The cell substrate for the REF and BS1 is mouse myeloma cell Sp2/0, whereas that for BS2 and BS3 is CHO cells. Depending on the production cells, the glycans eluted after G2F in the chromatogram were different (Figs. 1, 2, Fig. S2, and Fig. S3). The glycans unique to Sp2/0 were considered α-galactosylated or sialylated glycans (mainly N-glycolylneuraminic acid) [28].
ETN is an Fc-fusion dimeric protein that contains the extracellular ligand binding domain of the human TNF receptor 2 (TNF RII) linked to the Fc region of human IgG1. Each chain contains one N-glycosylation site (Asn317) on its Fc region and has two additional N-glycosylation sites (Asn147 and Asn179) and 13 O-linked glycosylation sites on the extracellular domain of TNF RII [29]. Most of the N-linked glycans located at the TNF RII region are mainly sialylated, whereas the N-linked glycans at the Fc region are primarily asialylated [29, 30]. The glycan analysis results of ETN treated with exoglycosidase suggested that the peaks eluted after G2F were primarily sialylated glycans (Fig. S6). The differences observed in the profiles of asialylated and sialylated glycans indicate the differences in the glycans derived from the Fc and TNF RII regions, respectively, among REF, BS1, and BS2 (Figs. 1, 2).
Comparing the content ratio of the afucosylated, high mannose, galactosylated, and sialylated glycans among the products in Fig. 2, the measurement results of IFX showed significant differences in all glycans. The measurement values for the afucosylated glycans, high mannose glycans, and peaks after G2F of IFX_BS3 were not within the quality range of the REF product. The galactosylation level of IFX_BS2 was beyond the quality range. For TRA, BS1 exhibited higher sialylated glycan content. For RTX, a higher content of afucosylated glycans was observed in the BS2 results. The biosimilars of BEV had a higher content of galactosylated glycans compared with the upper limit of the quality range of the REF products. For ETN, BS1, and BS2 tended to have higher levels of afucosylated and galactosylated glycans and exhibited a lower level of high mannose. For the five types of products examined in this study, lot-to-lot variation was observed to some degree for each glycan. Based on the glycan profiles of all the products in Figs. S3–5, no trend was observed in which the specific glycans decreased or increased between lots.
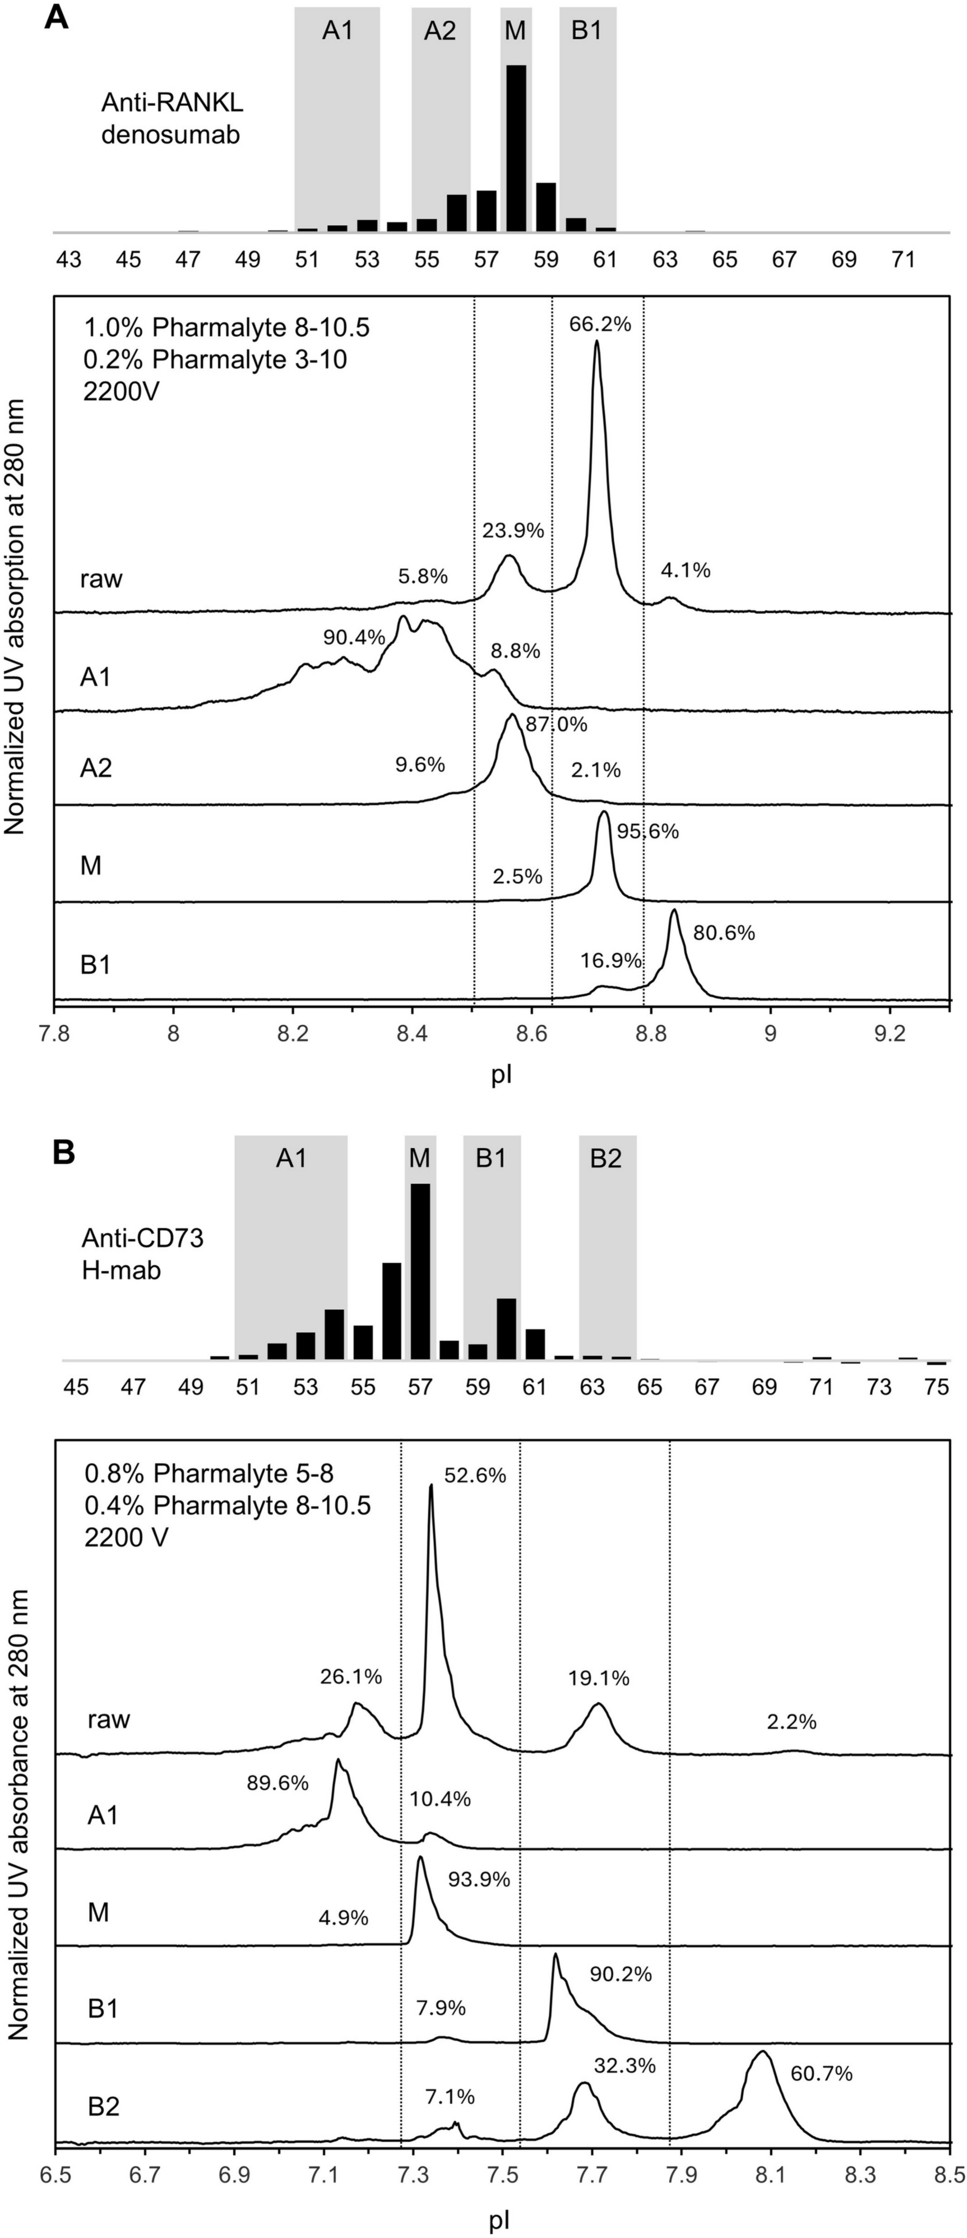
3.2 Charge HeterogeneityThe charge heterogeneities of therapeutic mAbs and Fc-fusion proteins may result from deamidation, oxidation, and variations in C-terminal lysine, formation of N-terminal pyroglutamate, aggregation, isomerization, charged (sialylated) glycans, fragmentation, glycation at lysine residues, and succinimide formation [31, 32]. Acidic and basic variants may be formed, in which the acidic fraction typically contains a variety of protein species, such as deamidated, sialylated, and glycated forms, whereas the basic fraction contains N-terminal glutamine, succinimide formation, isomerization of aspartic acid, and oxidated and C-terminal lysine variants [31,32,33]. The charge heterogeneity of the products in the present study was measured by imaged capillary isoelectric focusing (icIEF). The peak ratio is compared between REF and biosimilar products in Fig. 3. The representative electropherogram of each product is shown in Fig. S7 (see the electronic supplementary material). The content of the main peak and basic peaks of IFX differed greatly between the REF and biosimilar products (Fig. 3, Fig. S7). In particular, IFX_BS2 had lower basic variants compared with the lower limit of the quality range. The electropherogram of samples treated with CPB (blue line in Fig. S7) indicated that basic peaks 1 and 2 of mAbs were considered as variants with one and two C-terminal lysine residue(s), respectively. TRA_BS1, TRA_BS3, RTX_BS1, RTX_BS2, and BEV_BS1 had higher basic peaks compared with each quality range of REF (Fig. 3). The acidic variant content tended to be lower in biosimilar products compared with the REF products of RTX and BEV. In terms of lot-to-lot variation, the IFX_REF product showed a relatively large variation in charge profile. On the other hand, TRA showed relatively small differences between products and between lots compared with other product types. For other IFX, RTX, and BEV products, no lot-to-lot trends were observed, such as an increase in acidic peaks and basic peaks.
Fig. 3
Charge profiles of IFX, TRA, RTX, and BEV by icIEF analysis. Box plot shows the interquartile range (box), median (band inside of box), maximum, and minimum values. Scatter plots of acidic peaks (%) and basic peaks (%) are shown with the mean and SD. Dashed lines represent the quality ranges of the REF products. BEV bevacizumab, BS biosimilar, icIEF imaged capillary isoelectric focusing, IFX infliximab, REF reference, RTX rituximab, TRA trastuzumab
The representative electropherograms of ETN products are shown in Fig. S7. The effects of isoelectric precipitation made it difficult to perform reproducible analyses of ETN, and comparisons between samples and lots were difficult.
3.3 Biological ActivitiesBiological activities were determined by antigen binding affinities and Fcγ receptor binding affinities based on the mechanism of action of each antibody and Fc-fusion protein. While a cell-based assay is commonly used to evaluate the biological activities of biotherapeutic proteins, it may show high variability in the measurement results. Considering the purpose of evaluating the similarity between products and variation among lots, we determined the KD using SPR, which shows less variation in measurement. The kinetic data are useful because they provide not only the equilibrium binding constant, but also the rate constants, which characterize the dynamics of the interaction.
We evaluated the binding affinity of IFX and ETN to TNFα, TRA to human epidermal growth factor receptor 2 (HER2), RTX to CD20, and BEV to vascular endothelial growth factor (VEGF). There are two methods for evaluating binding affinity using SPR: (1) immobilizing the antigen on a sensor chip or (2) applying the antigen as an analyte. We used these two approaches for each combination of interactions and selected the appropriate method by comprehensively judging the quality of the sensorgram and the degree of model fit. Only for ETN, approach (1) was applied to satisfy the criteria to ensure the quality of sensorgram and model fitness. The KD measured for each lot is plotted in Fig. 4, and the kinetic parameters, association rate constant (kon) and dissociation rate constant (koff), are listed in Tables S7–S11 (see the electronic supplementary material).
Fig. 4
Comparison of binding activities against antigen and FcγRIIIa 158V and 157F. Scatter plots for the dissociation constant (KD) are shown with the mean and SD. Dashed lines represent the quality ranges of the REF products. For ETN, solid lines represent the quality ranges for the vial type of the REF product, whereas dashed lines represent the quality ranges of the syringe type of the REF product. BEV bevacizumab, BS biosimilar, ETN etanercept, IFX infliximab, REF reference, RTX rituximab, s syringe product, TRA trastuzumab, v vial product
No biosimilar products exhibiting higher or lower activity were observed against the quality ranges of the REF products. Some biosimilar products tended to have slightly weaker binding affinities for the REF product of IFX, TRA, RTX, and ETN (Fig. 4). For BEV, BS1 and BS2 tended to have stronger binding affinity compared with the REF. In addition, there was a tendency for TRA_BS1 and BEV_BS1 to have larger lot-to-lot variations compared with each REF and other biosimilar products. In terms of binding kinetic parameters, the interaction behavior was considered similar for all combinations of REF and biosimilar products (Tables S7–S11). Overall, there were no major differences between the products or lots that would significantly affect quality and efficacy.
Among the Fcγ receptors, FcγRIIIa primarily contributes to Fc-mediated antibody-dependent cellular cytotoxicity (ADCC) activity mediated by natural killer (NK) cells. The binding affinity to FcγRIIIa is an important attribute when comparing the quality of a REF and biosimilar products for the mAbs with ADCC in their MOAs, such as TRA and RTX. FcγRIIIa contains a genetic polymorphism at amino acid position 158 (158F, 158V), which may be a factor in individual differences in therapeutic efficacy [34]. Furthermore, genetic polymorphisms affect the ability of ADCC bioassays to discriminate afucosylated glycan content [35, 36]. Thus, the binding affinities to both FcγRIIIa 158V and 158F were evaluated. We observed differences in binding affinities to FcγRIIIa among the products, which may be derived from the variations in glycosylation profiles (Fig. 4). The interaction with FcγRIIIa 158V had a smaller KD value compared with that of 158F. It exhibited stronger affinity, which was consistent with that of previous reports [36]. Although similar results were obtained overall for FcγRIIIa 158V and 158F, the results measured with 158F showed clearer differences between the products. IFX_BS2 and RTX_BS1 had a lower affinity to FcγRIIIa 158F, and ETN_BS1 and ETN_BS2 had higher affinity compared with each quality range of REF.
3.4 AggregationProtein molecules can inherently self-associate to form aggregates ranging in size from nanometer-sized dimers to those detected as insoluble particles because of various physicochemical stresses [37]. Multiple studies have suggested that protein aggregates including insoluble particles can elicit immune response [38, 39]. Protein aggregates and insoluble particles are considered impurities to be adequately characterized and controlled to ensure the efficacy and safety of therapeutic protein injections [40, 41]. For the purity test of drug substances and drug products, HMW, including dimers and multimers, are evaluated by size-exclusion chromatography followed by UV detection (SEC-UV). The measurement results of HMW % are shown in Fig. 5. The representative chromatogram of each product is shown in Fig. S8 (see the electronic supplementary material). IFX_BS1 and TRA_BS2 had a high HMW %. For the other products, the HMW % of the biosimilar products tended to be lower or equal compared with that of each REF product. For lot-to-lot variations, the REF products of RTX and ETN exhibited larger variations in HMW % compared with the other products. Overall, no products were found that were likely to significantly affect quality.
Fig. 5
Comparison of HMW for a IFX, b TRA, c RTX, d BEV, and e ETN. Scatter plots of the HMW % are shown with the mean and SD. Dashed lines represent the quality ranges for the REF products. For ETN, solid lines represent the quality ranges for the vial type of the REF product, whereas dashed lines represent the quality ranges of the syringe type of the REF product. BEV bevacizumab, BS biosimilar, ETN etanercept, HMW high-molecular-weight aggregates, IFX infliximab, REF reference, RTX rituximab, s syringe product, TRA trastuzumab, v vial product
The particulate matter test using LO is generally performed for drug products to evaluate the number of subvisible particles greater than 10 μm and 25 μm according to the general test of the Japanese Pharmacopoeia <6.07> Insoluble Particulate Matter Test for Injections [18]. In the test, the acceptance criteria for the number of particles with a size greater than 10 μm and also those greater than 25 μm are defined. However, several studies indicate the limitation of LO to detect particles with low optical contrast or refractive index, such as protein particles, compared with polystyrene latex beads that are used for the calibration of LO instruments [42,43,44,45]. Therefore, FI has emerged as a useful tool to characterize protein particles and to complement LO, as it is more sensitive than LO for highly transparent particles with a low refractive index. Therefore, both LO and FI analyses were used to measure subvisible particles in innovator and biosimilar products.
The total particle concentration of ≥ 2-μm particles is shown in Fig. 6. Detailed data for each particle size range is shown in Fig. S9 and Tables S12–S16. Comparing the results of LO with FI, FI exhibited a higher particle concentration, which was consistent with our previous report [46]. Approximately ten- to 50-fold differences in particle counts between the methods were observed. Except for some results, the trends in differences between the products were generally similar for the LO and FI results. Overall, the number of TRA, RTX, and BEV particles tended to be lower compared with that of the IFX and ETN products. Considering the large variation caused by counting particles non-uniformly dispersed in solutions, no significant differences were observed between the REF and the biosimilars for TRA, RTX, and BEV. For IFX, there was a tendency for the number of particles in BS1 to be higher compared with that in the other products, except for the FI measurement results for some lots of BS2 and BS3, which suddenly showed a high value. For ETN, syringe products, particularly the REF and BS2, exhibited higher particle counts compared with the vial products. When checking the particle images obtained with FI, many silicone oil droplets were detected in the syringe formulation. Although the time until the expiration date of each lot varied, there was a tendency for newer lots to contain lower numbers of particles overall (Fig. S9). On the other hand, for the syringe formulation of ETN_BS2, a tendency was observed for both LO and FI that the number of particles increased with newer lots (Fig. S9).
Fig. 6
Subvisible particle analysis using light obscuration (left) and flow imaging (right). Scatter plots of the total particle concentration of ≥ 2 μm (#/mL) are shown with the median. BEV bevacizumab, BS biosimilar, ETN etanercept, IFX infliximab, REF reference, RTX rituximab, s syringe product, TRA trastuzumab, v vial product
The LO measurements confirmed that no products exceeded the acceptance criteria for particulate matters as defined in the internationally harmonized general test of the pharmacopoeia [18]: 6000 particles per container or less with a particle size of 10 µm or more, and 600 particles per container with a particle size of 25 µm or more (Tables S12–S16).
3.5 Higher Order StructuresTo evaluate the structural similarity between the REF and biosimilar products, we conducted secondary and tertiary structural analysis using far- and near-UV CD. The CD spectra of biosimilar products and REF products were shown in Fig. 7. While the biosimilar products had different glycan and charge profiles from that of the REF product, all of the biosimilar products showed similar spectra to the corresponding REF product, indicating the similarity in higher order structure between the REF and biosimilar products.
Fig. 7
Comparison of far-UV and near-UV CD spectra for IFX, TRA, RTX, BEV, and ETN. The averaged spectra of triplicate measurements were shown for each product. BEV bevacizumab, BS biosimilar, CD circular dichroism, ETN etanercept, IFX infliximab, REF reference, RTX rituximab, TRA trastuzumab
Comments (0)