2.1 Evaluation Strategy for the Determination of Quality Ranges (QR)
In the final similarity study, a total of 49 EU Prolia®, 34 US Prolia®, 40 EU Xgeva® and 25 US Xgeva® batches were analysed alongside 8 RGB-14-P and 6 RGB-14-X drug product batches. These RGB-14 batches were produced from independent drug substance batches using the final commercial process and scale. QR were determined by measuring the reference product batches over several years using available analytical and functional methods.
Compared with the biosimilarity literature [15,16,17,18,19,20,21], an outstanding number of methods was used. The descriptions of the major and critical methods and the obtained results are given in this publication, whilst the remaining descriptions and data are provided in the Supplementary Material in Table 1. For the quantitative results, the QR calculation was based on the formula mean ± X × SD (standard deviation of the method), determined from the results of the analysis of available EU and US Prolia®, Xgeva® batches. For the EU market, a fixed standard deviation multiplier X = 3 was applied (i.e. mean ± 3 × SD) across all quantitative methods. In contrast, for US Prolia® and Xgeva®, a more rigorous range approach was used with parameter-specific standard deviation multipliers according to FDA requirements [7]. The value of ‘X’ was determined on the basis of the criticality of the quality attribute, the specificity of the parameter (how specific is the evaluated parameter for the attribute being considered) and the precision of the test method (RSD%). The ratings can be high, moderate or low, and scores between 2 and 3 were assigned to them according to Table 1. The precision of the method parameters was considered according to the RSD% values derived from the intermediate precision results of the method qualification or validation. The method precision is considered ‘high’ if the RSD% of the parameter is ≤ 1.0%, ‘moderate’ if it is 1.0–5.0% and ‘low’ if it is ≥ 5.0%. The contributions of each factor are considered independently: (a) methods with lower precision (i.e. high SD) were assigned a lower multiplier (to avoid excessive widening of the QR), (b) quality attributes with higher criticality were assigned a lower factor (to ensure a tighter range) and (c) low parameter specificity was assigned a higher factor. The final score (proposed QR multiplier) of a parameter was calculated as a weighted linear combination of the scores related to the three factors. Factor weights are defined in Table 1.
Table 1 Factor ratings, corresponding scores and factor weightingsThe determination of the quality ranges was performed using a rigorous range approach and the quantitative results of the measurements were compared with the quality ranges obtained with the parameter-specific standard deviation multipliers as described above (specific multiplier values are listed in Supplementary Table 2).
Definitions for the evaluation of quantitative parameters were the following: highly similar, if more than 90% of the RGB-14 batches fall within the QR; similar, if at least 50% of the RGB-14 batches are within the QR, though some may fall outside; and different, if more than 50% of the RGB-14 batches fall outside the QR.
The results of structural characterisation and identity methods were evaluated either through parallel analyses or by comparison with theoretical values. No multiplier was defined for negative functional assays, certain biophysical and sub-visible particle methods.
2.2 Materials
The RGB-14-P and Prolia® drug products are available as 60 mg/mL concentrate for solution for injection in pre-filled syringe, whilst RGB-14-X and Xgeva® drug products as 120 mg/1.7 mL concentrate for solution for injection in vial. Prolia® contains 17 mM acetate and 4.7% sorbitol, whilst Xgeva® has 18 mM acetate and 4.6% sorbitol [3,4,5,6]. Gedeon Richter applied the same Xgeva® formulation buffer composition for both RGB-14-P and RGB-14-X qualitatively and quantitatively; they only differ in their final protein concentration and container closure system. All reference product samples were stored under prescribed conditions.
2.3 Analytical Methods2.3.1 Intact Molecular Mass Analysis and Intact Glycation Analysis by Liquid Chromatography–Mass Spectrometry (LC-MS)
Intact mass analysis was performed after a dilution step using MilliQ water and the samples were analysed on a Shimadzu Nexera X2 ultra-high-performance liquid chromatography (UHPLC) instrument coupled to a Bruker maXis II Q-TOF high resolution mass spectrometer. The online desalting of intact samples was performed on a Waters Acquity BEH C4 column (2.1 × 100 mm, 1.7 µm, 300 Å) at 80 °C with a flow rate of 0.4 mL/min using water/acetonitrile gradient with 0.1% trifluoroacetic acid (TFA) as eluent additive. The eluents were the followings: eluent A: H2O = 100 (V/V%), eluent B: H2O:acetonitrile (ACN) = 10:90 (V/V%) and eluent C: H2O:cc. TFA = 100:1 (V/V%). The same chromatographic conditions were applied for the intact glycation analysis where the samples were diluted and additionally treated with PNGaseF (New England BioLabs) and CPB (Sigma) enzymes.
The spectra of the detected peaks were averaged and deconvoluted using the BioPharma Compass software (version 2.0.1, Bruker). During the evaluation, the deconvoluted mass spectra and the measured average mass values were compared. In case of the glycation analysis, the relative intensity of the mono-glycated peak was determined.
2.3.2 Reduced and Non-reduced Peptide Mapping Analysis by Liquid Chromatography–Mass Spectrometry (LC-MS) with Lys-C Enzyme
For reduced peptide mapping, the samples were first denatured by guanidine hydrochloride under reducing conditions (using dithiothreitol) at neutral pH and 37 °C, then diluted and digested by Lys-C enzyme (Fujifilm Wako Pure Chemical Corporation). Finally, the disulfide bridges were reduced by tris-(2-Carboxyethyl)phosphine (TCEP), and the digestion was stopped by the addition of acetic acid.
As a first step of the non-reduced peptide mapping, the samples were denatured by guanidine hydrochloride at neutral pH and 37 °C. The free thiol groups were labelled by N-ethylmaleimide. The denatured samples were diluted and digested by Lys-C enzyme (Fujifilm Wako Pure Chemical Corporation). Finally, the digestion was stopped by the addition of acetic acid.
The resulting peptides were separated on a Waters Acquity BEH Phenyl column (1.7 μm, 2.1 × 150 mm, 130 Å) at 58 °C with a flow rate of 0.3 mL/min using a gradient of water/acetonitrile with 0.1% TFA as eluent additive. The eluents were the followings: eluent A: H2O:TFA = 100:0.1 (V/V%) and eluent B: H2O:ACN:TFA = 50:50:0.1 (V/V%). The peptide mapping analysis was performed by liquid chromatography-electrospray ionisation-tandem mass spectrometry (LC-ESI-MS/MS) with a Shimadzu Nexera X2 ultra-performance liquid chromatography (UPLC) instrument coupled to an Orbitrap Fusion Tribrid instrument (Thermo Fisher Scientific). Data evaluation of the MS and MS/MS spectra was performed by the BioPharma Finder (2.0) and Xcalibur (4.1) software (Thermo Fisher Scientific). A semi-quantitative analysis of post-translational modification (PTM) levels was also included in the data evaluation procedure: the relative area% of a given modified peptide was calculated by dividing the extracted ion chromatogram (EIC) peak area of the modified peptide by the sum of the EIC peak areas of all modified and native peptides of that specific peptide. The same charge states were chosen for both the modified peptide and its native form.
2.3.3 Reduced Peptide Mapping Analysis by LC-MS (with Chymotrypsin Enzyme)
To achieve 100% sequence coverage of the protein at the peptide level, a digestion with chymotrypsin (Promega) enzyme was also performed. After the denaturation of the protein by guanidine hydrochloride under reducing conditions (using dithiothreitol) at neutral pH and 37 °C, the samples were diluted and digested by chymotrypsin enzyme and the disulfide bridges were reduced by TCEP, and digestion was stopped by the addition of acetic acid. The resulting peptides were separated on a Waters Acquity UHPLC Peptide CSH C18 column (1.7 μm, 2.1 × 150 mm, 130 Å) at 55 °C with a flow rate of 0.3 mL/min using a gradient of water/acetonitrile with 0.1% formic acid (FA) as eluent additive. The eluents were the followings: eluent A: H2O:FA = 100:0.1 (V/V%) and eluent B: H2O:ACN:FA = 50:50:0.1 (V/V%). A Shimadzu Nexera X2 UPLC coupled to an Orbitrap Fusion Tribrid instrument (Thermo Fisher Scientific) was used for the measurements.
2.3.4 Hotspot Peptide Mapping Analysis by Reversed Phase–Ultra-High-Performance Liquid Chromatography with UV Detection (RP-UHPLC-UV), with Lys-C Enzyme
The extent of heavy chain (HC) M253 oxidation was measured with reversed-phase chromatography. Samples were first denatured by guanidine hydrochloride under reducing conditions (using dithiothreitol) at neutral pH and 37 °C, then diluted and digested by Lys-C enzyme (Wako). The disulfide bridges were reduced by TCEP, and digestion was stopped by the addition of acetic acid. The oxidised and native HC 250–289 peptides were separated using the same chromatographic conditions as used in the reduced Lys-C peptide mapping analysis by LC-MS on a Waters Acquity H-Class UPLC. The relative amounts of the peptides containing the single oxidised and the non-oxidised (native) forms of the M253 were compared by area% evaluation of the chromatogram acquired at 215 nm.
2.3.5 Free Thiol Content by Ellman’s Assay
The number of free thiol groups (sulfhydryl, -SH) per protein molecule was determined quantitatively using 5,5′-dithiobis-[2-nitrobenzoic acid] (DTNB, Ellman’s reagent). In the rapid and stoichiometric reaction one mole 2-nitro-5-thiobenzoate (TNB2-) is released per one mole thiol. The amount of the released TNB2- was quantified using an absorbance plate reader (MTP Reader Infinite Series, Tecan). Free thiol concentrations of test samples were calculated from the N-acetyl-l-cysteine standard calibration curve.
2.3.6 Disulfide Isoform Determination by Reversed-Phase High-Performance Liquid Chromatography (RP-HPLC)
The composition of disulfide isoforms was determined with reversed-phase chromatography. Denosumab has four disulfide bonds in the hinge region, and the disulfide isoforms can be distinguished on the basis of the different positions of these disulfide bridges. The sample was diluted with formulation buffer and the measurement was performed using a HALO C4 Protein 1000 Å (2.7 μm 2.1 × 150 mm) column (Halo) on a UPLC (Shimadzu Nexera) with UV detection. Chromatographic parameters: column temperature: 80 °C, flow rate: 0.7 mL/min, gradient elution (eluent A%: isopropanol [IPA]:H2O:TFA = 2:98:0.1 [V/V%] and eluent B%: IPA:ACN:H2O:TFA = 70:20:10:0.1 [V/V%]). Data were acquired and processed by quantitative integration using Empower™3 (Waters) or LabSolutions CS 6.88 SP1 (Shimadzu) software. As a final result, the relative amount (area%) of the different isoforms (B, AB, A1, A2) was obtained.
2.3.7 N-Glycosylation Profile by Hydrophilic Interaction Chromatography with Fluorescence Detection (HILIC-UHPLC-FL)
Firstly, N-glycans were released (PNGase, GlycoPrep® Kit, Agilent Technologies) from the denatured proteins and derivatised using an Instant Procaine (InstantPCTM, GlycoPrep® Kit, Agilent Technologies) dye, followed by the removal of the excess dye (manufacturer’s recommendations were followed). Secondly, the purified N-glycan mixture was analysed using an Acquity UPLC BEH Glycan (1.7 μm 2.1 × 150 mm) column (Waters) on a UPLC/UHPLC (Shimadzu or Waters) with fluorescent (FLR) detection (excitation wavelength [λEX] = 285 nm, emission wavelength [λEM] = 345 nm). Chromatographic parameters: column temperature: 45 °C, flow rate: 0.5 mL/min, gradient elution (eluent A: 50 mM ammonium formate, pH = 4.4, eluent B: ACN). Data were acquired and processed using Empower™3 (Waters) or LabSolutions CS 6.88 SP1 (Shimadzu) software. As a final result, the relative amount (area%) of the different N-glycan forms was obtained.
2.3.8 Analysis of Bisecting GlcNAc and Gal-α-1,3-Gal Forms by HILIC-UHPLC-FL/ESI-MS/MS with Exoglycosidase Digestions
Samples were prepared according to the HILIC-UHPLC-FL released glycan protocol divided to aliquots and digested with different combination of exoglycosidases. For the identification of bisecting GlcNAc forms the results of the α(2-3,6,8,9)-sialidase A, β(1-4)-galactosidase and β-N-acetylhexosaminidase digested aliquots were compared with the α(2-3,6,8,9)-sialidase A and β(1-4)-galactosidase digested samples. For the identification of galactose-α(1-3)-galactose linkage containing forms, the α(2-3,6,8,9)-sialidase A, β(1-4)-galactosidase and α(1-3,4,6)-galactosidase digested aliquots were compared with the α(2-3,6,8,9)-sialidase A and β(1-4)-galactosidase digested samples. The samples were analysed on a Shimadzu Nexera X2 UHPLC instrument coupled to a Bruker maXis II Q-TOF mass spectrometer. The same chromatographic conditions were applied as in the HILIC-UHPLC-FL analysis. N-glycans were identified on the basis of their measured mass, relative retention time, MS/MS spectra and the results of the exoglycosidase digestions using DataAnalysis (4.3) and BioPharma Compass (2.0.1) software (Bruker).
2.3.9 Sialic Acid Content by RP-HPLC-FL
N-Acetylneuraminic acid (NANA) and N-glycolylneuraminic acid (NGNA) contents were determined in two steps. Firstly, the sialic acids were released from the sugar chains by acidic hydrolysis (HCl) from a 10 mg/mL protein solution, and derivatised using the fluorescent dye 1,2-diamino-4,5-methylenedioxybenzene (DMB, Takara Bio Inc.). Secondly, sialic acids were separated using a Phenomenex Kinetex C8 column (2.1 × 100 mm, 2.6 µm) on a UPLC/UHPLC (Shimadzu or Waters) instrument with FL detection (λEX = 373 nm, λEM = 448 nm). Chromatographic parameters: column temperature: 35 °C, flow rate: 0.35 mL/min, gradient elution (eluent A%: MeOH:H2O = 15:85 [V/V%]; eluent B%: MeOH:H2O:TFA = 70:30:0.1 [V/V%]). Data based on NANA and NGNA standard (Sigma) calibration curves were acquired and processed by Empower™3 (Waters) or LabSolutions CS 6.88 SP1 (Shimadzu) software.
2.3.10 Non-glycosylated Heavy Chain (NgHC) Fragment by Reducing Capillary Gel Electrophoresis Sodium Dodecyl Sulphate (R-CE-SDS)
Non-glycosylated heavy chain was measured on a Maurice S. (ProteinSimple) CE instrument. The fragments subjected to analysis (NgHC, HC, LC) were generated by reducing the disulfide bridges of the antibody by β-mercaptoethanol together with sodium dodecyl sulphate (Maurice CE-SDS Plus 1x Sample Buffer, ProteinSimple). The length and diameter of the capillary was 150 mm and 50 μm, respectively. At the beginning of a 25-min run the sample load was performed electrokinetically, and the compounds were detected at 220 nm. Compass for iCE software (ProteinSimple v 2.1.0) was used.
2.3.11 Hydrogen/Deuterium Exchange Mass Spectrometry (HDX-MS)
The samples were prepared by a two-step dilution, first with H2O-buffer, then with D2O-buffer and were subjected to deuteration for different time periods. Following quenching with a low-pH buffer, the samples were placed in an ice bath before being injected into the HDX-manager module of the Waters M-Class liquid chromatography system coupled with a Waters Synapt XS® ion mobility quadrupole Q-TOF mass spectrometer (Waters Corporation, Milford, MA, USA). The protein was digested online by a Waters Enzymate® BEH Pepsin column (30 mm × 2.1 mm, 5 µm), the peptides were first trapped on a Waters Acquity® UPLC BEH C18 VanGuard Pre-column (5 mm × 2.1 mm, 1.7 µm). Then they were separated on a Waters Acquity® UPLC BEH C18 column (100 mm × 2.1 mm, 1.7 µm) before finally being eluted into the mass spectrometer. Chromatographic parameters were as follows: digestion column temperature 20 °C; analytical column temperature 0.1 °C; digestion eluent flow rate 100 μL/min; analytical eluent flow rate 40 μL/min; gradient elution (eluent A%: H2O:cc. FA = 100:0.2 [V/V%]; eluent B%: ACN:cc. FA = 100:0.2 [V/V%]). The mass spectrometer was set to positive ion—HDMSE (ion mobility) mode. The acquired HDX-MS data were analysed in two stages: denosumab-derived peptides were identified using Waters PLGS 3.0.3 and subsequently, Waters DynamX 3.0 software was used to calculate the absolute and relative deuteration results for the identified peptides.
2.3.12 Nuclear Magnetic Resonance Spectroscopy (2D NMR)
Two-dimensional 1H–13C heteronuclear single quantum coherence (2D HSQC) NMR spectra of intact protein samples were recorded. The samples were prepared for NMR measurements under conditions replicating the Prolia® formulation, with the formulation solution supplemented with 5% v/v D2O. The protein concentration was standardised to a nominal value of 40 mg/mL. All NMR data were collected at 320 K on a Bruker Avance III HDX 800 MHz spectrometer, equipped with a 5-mm cryogenically cooled triple-resonance Z-pulsed field gradient TCI probe (Bruker Corporation, Billerica, MA, USA). Parameters of a gradient-selected sensitivity-enhanced HSQC pulse sequence were optimised for methyl groups. 2D methyl-HSQC spectra were compared visually, as well as by a chemometric approach: sets of combined chemical shift difference (CCSD) values of pairwise comparisons of peak lists were evaluated statistically [22].
2.3.13 High Molecular Weight Species (HMWs) by Size Exclusion Chromatography (SE-HPLC)
Chromatographic resolution was achieved with an AdvancedBio SEC 300 Å column (7.8 × 300 mm, 2.7 µm, Agilent) on a Shimadzu Nexera HPLC system. Chromatographic parameters: column temperature: 30 °C, flow rate: 0.7 mL/min, isocratic flow (eluent: 5 V/V% ACN and 300 mM KCl containing 50 mM K3PO4 buffer pH = 6.8), FL detection: (λEX = 280 nm, λEM = 350 nm). Data were acquired and processed by Empower™3 (Waters) or LabSolutions CS 6.88 SP1 (Shimadzu) software.
2.3.14 Low Molecular Weight Species (LMWs) by Non-reducing Capillary Electrophoresis Sodium Dodecyl Sulphate (NR-CE-SDS)
Maurice S. (ProteinSimple) CE instrument was applied using a Compass for iCE software (ProteinSimple v 2.1.0). Samples were denatured with sodium dodecyl sulphate (Maurice CE-SDS Plus 1x Sample Buffer, ProteinSimple) and acetylated by iodoacetamide. The length and diameter of the capillary was 150 mm and 50 μm, respectively. At the beginning of a 35-min run the sample load was performed electrokinetically, and the compounds were detected at 220 nm.
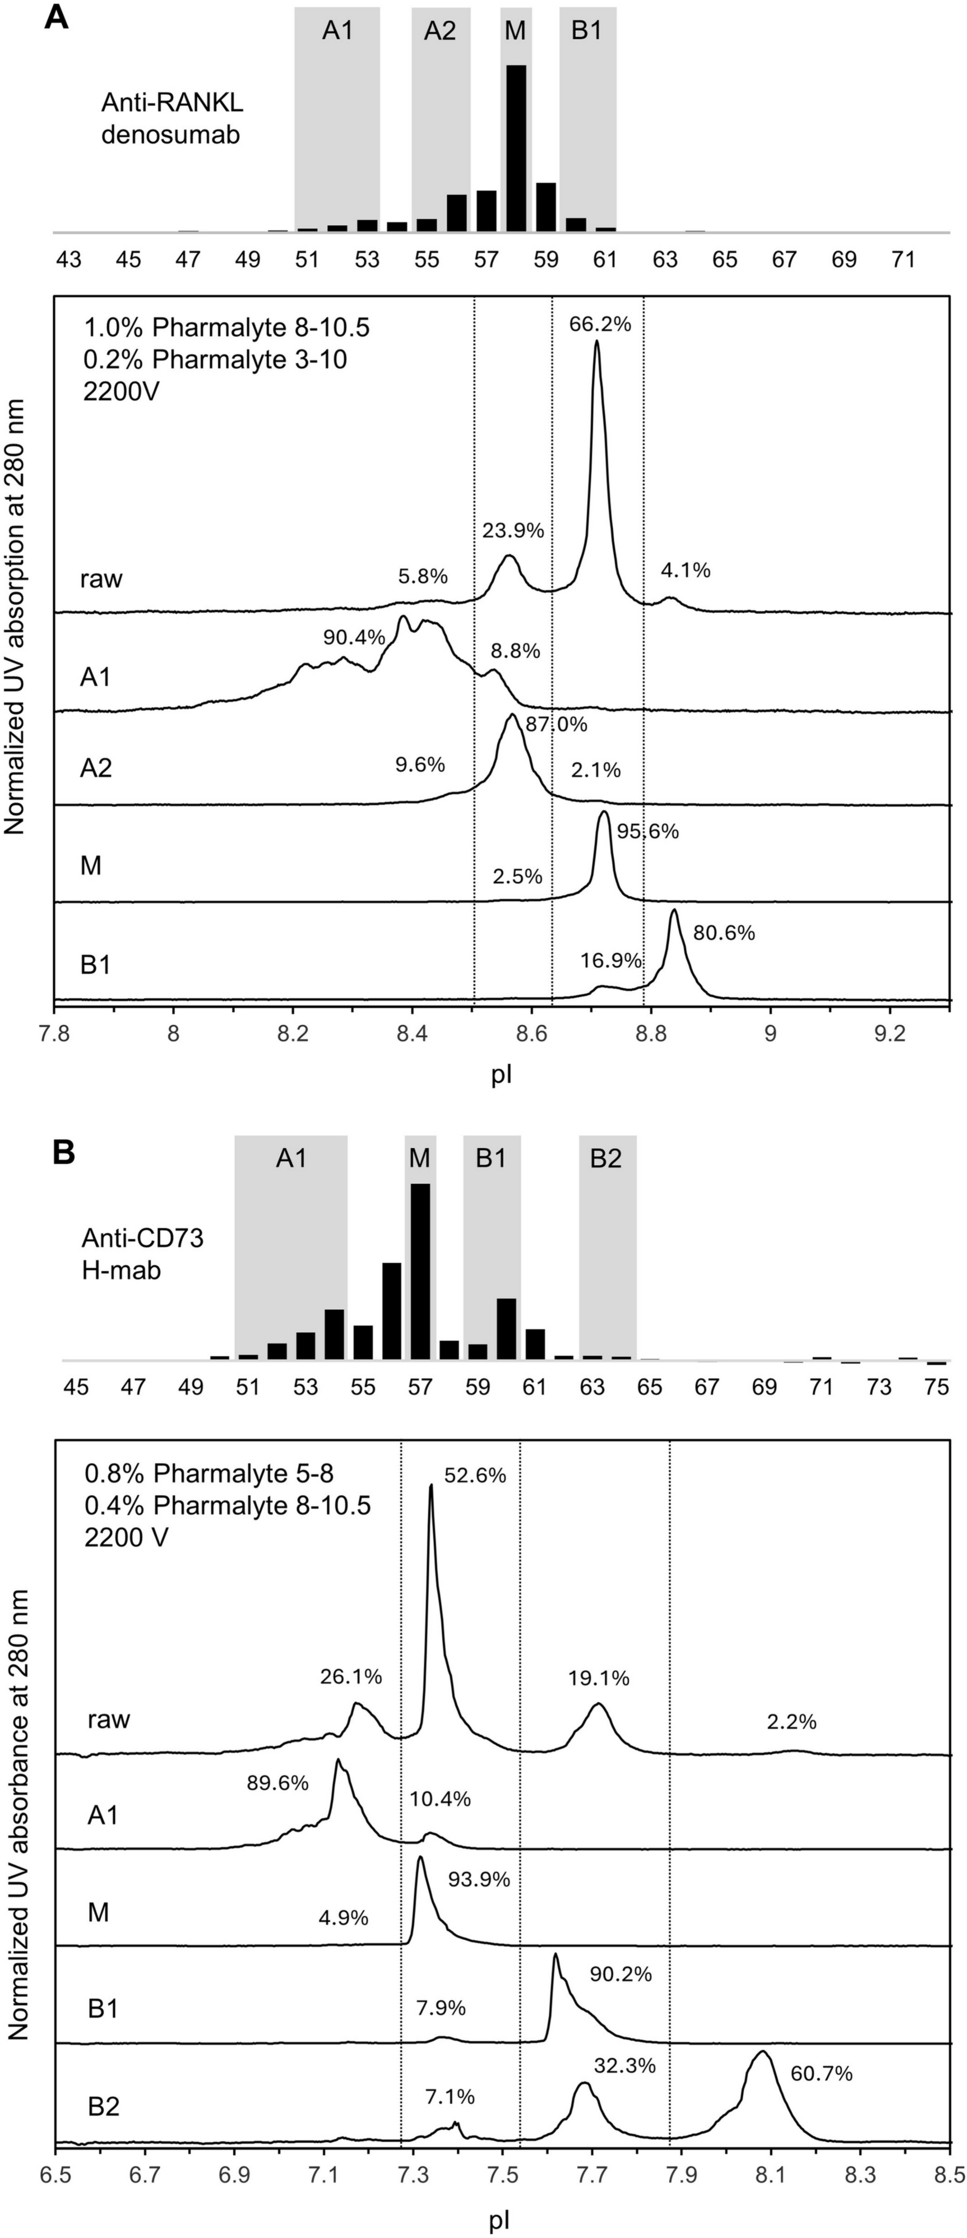
2.3.15 Charge Variants by Imaged Capillary Isoelectric Focusing (cIEF) with Native Treatment and CPB Digestion
Charge variants were separated in 0.5 mg/mL protein solution either with native treatment or after carboxypeptidase B (Sigma) enzyme digestion in ampholyte (Pharmalyte 3-10, Sigma) and 0.6 M urea containing matrix using a Maurice S. CE instrument (ProteinSimple) with dedicated cIEF cartridge. Maurice’s cIEF cartridge contains a 100 µm ID × 5 cm fluorocarbon-coated capillary, which is pressure-filled with 0.5% methyl cellulose. During the 6.5-min cIEF run, separation is monitored in real time using absorbance detection at 280 nm. The basis for the assessment of identity was the isoelectric points of the tested samples, which were determined on the basis of the position of the pI markers (pI 7.05 and pI 9.50 from ProteinSimple). Using as a purity method, area% data of the main peak and sum of acidic and basic variants were evaluated. Data were acquired and processed by Compass for iCE software (ProteinSimple v 2.1.0).
2.4 Functional Assays2.4.1 Target (RANKL) Binding by Enzyme-Linked Immunosorbent Assay (ELISA)
Binding of test samples to RANKL was assessed by indirect ELISA. Recombinant human soluble RANKL (sRANKL) was coated onto a 96-well plate, followed by adding serial dilution of test samples, after a blocking step. The binding was detected using HRP-conjugated anti-human IgG (Fc-specific) secondary antibody followed by the 3,3′,5,5′-tetramethylbenzidine (TMB) reagent. The emerging enzymatic reaction was stopped by adding sulfuric acid. The dose-response data were fitted to a 4PL curve using PLA software (Stegmann System), and the relative binding was calculated on the basis of the half maximal effective concentration (EC50) values compared with the reference standard.
2.4.2 Kinetic Analysis of RANKL, Neonatal Fc Receptor (FcRn), Fcγ Receptor (FcγRI/CD64, FcγRIIa/CD32a, FcγRIIIa/CD16a) and the Complement Component 1q (C1q) Binding by Biolayer Interferometry (BLI)
The kinetic constants were determined by BLI using Octet RED96e instrument (Sartorius). As ligands, RANKL (R&D Systems) was immobilised on AR2G biosensors (Amine Reactive 2nd Generation) using covalent amine-coupling, whilst His-tagged human FcRn (Sino Biological), CD64 (Sino Biological), CD32a 131H (R&D Systems) and CD16a 158V (Acro Biosystems) were immobilised on HIS1K biosensors (Anti-Penta-HIS, Sartorius), respectively, and varying concentrations of test samples were used as analyte. In case of C1q binding, test samples were immobilised on FAB2G biosensors (Anti-Human Fab-CH1 2nd Generation, Sartorius) as ligands, and varying concentrations of human C1q (Merck) were used as analyte. During each kinetic analysis, the sensorgrams were collected and processed using the integrated Octet Data Analysis HT software (Sartorius). The kinetic parameters of the interactions (equilibrium dissociation constant [KD], association rate constant [ka] and dissociation rate constant [kdis]) were determined by fitting Langmuir 1:1 model to the kinetic curves.
2.4.3 Membrane Bound RANKL (mbRANKL) Binding by Cell-Based Flow Cytometry
The relative binding affinity to a recombinant Jurkat T-cell line stably and highly expressing human RANKL on its surface was assessed in a flow-cytometry-based assay. The amount of denosumab bound to the cell surface can be detected by indirect immunofluorescence staining using a fluorescent dye-conjugated anti-human IgG F(ab’)2 fragment. The mean fluorescent intensity (MFI) signal is directly proportional to the amount of denosumab bound to the cell surface. The reference standard and test samples are diluted in the same way and the biological activity of the test samples is calculated relative to the reference standard which represents 100% biological activity.
2.4.4 Inhibition of RANKL/RANK Signalling by Cell-Based Neutralisation Reporter Assay
Neutralising ability of test sample against RANKL was determined using DiscoverX PathHunter® U2OS RANK-IkB Functional Assay kit. Cells were cultured using AssayComplete™ Cell Culture Kit-103 (DiscoverX) before seeded into a 96-well assay plate. Serial dilutions of reference standard and test samples were prepared and mixed with sRANKL (PeproTech) solution for its neutralisation, then added to cells and incubated for 24 h. The generated chemiluminescence signal was detected by using Bioassay ED Detection kit (DiscoverX). The dose-response data were fitted to a 5PL curve using PLA software (Stegmann System), and the relative biological activity was calculated on the basis of the EC50 values compared with the reference standard.
2.4.5 Inhibition of Osteoclast Differentiation by Cell-Based TRAcP5b ELISA
The assay exploits the ability of the precursor cell line RAW264.7 (ATCC) to differentiate into mature osteoclasts that secrete active tartrate-resistant acid phosphatase 5b (TRAcP5b) in response to sRANKL stimulation. RAW264.7 cells were seeded on a plate and then treated with mixture of sRANKL and varying concentrations of reference and test samples. The amount of TRAcP5b secreted into the supernatant is detected by Mouse TRAP (TRAcP 5b) ELISA (Immunodiagnostic Systems), using multi-mode plate reader (BioTek). Dose-response curves of reference and test samples were fitted with a 5PL model and compared using the PLA software (Stegmann Systems). Relative biological activity is calculated from EC50 values.

Comments (0)