
Remember me
Across two seasons, 38 GPs (18 in the ARI and 20 in the ILI groups) enrolled 1443 subjects (2023/2024: n = 524; 2024/2025: n = 919). Twelve (0.8%) subjects were excluded for the following reasons: (1) five were < 50 years; (2) four were swabbed outside the allowed time window; (3) two did not meet the definition of ARI/ILI; and (4) one swab had no cotton flock inside the transport tube. A total of 1431 adults were therefore included in the analysis.
The mean age of participants was 67.9 (SD 11.3) years and females prevailed (62.4%). Two-thirds (61.7%) of patients had ≥ 1 co-morbidity, of which cardiovascular (42.9%) and respiratory (17.7%) diseases were the most prevalent (Table 1). Of the study population, 51.8% (n = 741) and 48.2% (n = 690) of subjects were enrolled by GPs randomized to the ARI and ILI groups, respectively. The number of adults enrolled by single GPs varied from 2 to 97. As shown in Table 1, ARI and ILI patients were comparable for most variables, but there were some imbalances in terms of mean age (Δ 1.6 years), nationality, prevalence of cancer, and smoking status.
Table 1 Characteristics of the study population; Genoa (Italy), 2023/2024 and 2024/2025 seasonsAll patients in the ILI group satisfied the ECDC ARI criteria, while 92.6% (686/741) of patients in the ARI group also satisfied the ECDC ILI criteria.
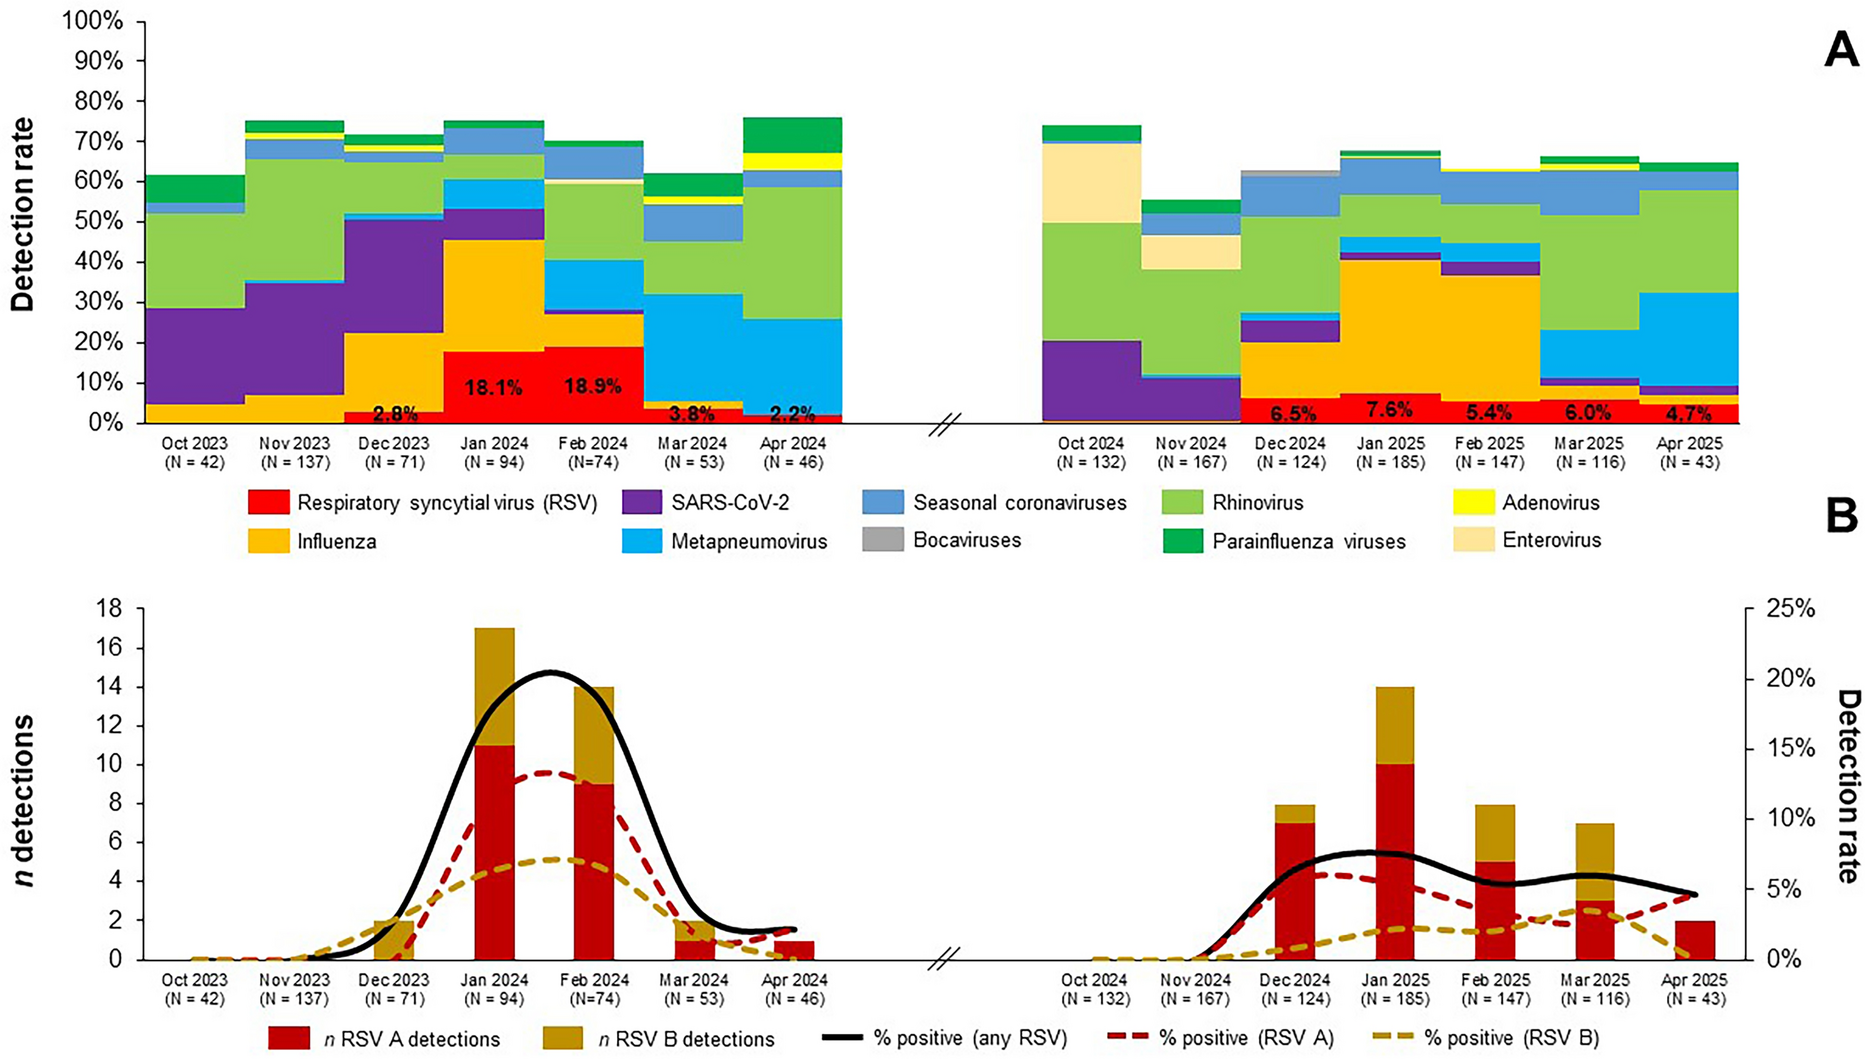
Epidemiology of RSV and its CharacteristicsRSV was detected in 5.2% (75/1431; 95% CI 4.1–6.5%) of participants and its detection rate was higher in the 2023/2024 season than in the 2024/2025 season (7.0% vs. 4.3%). RSV accounted for 7.8% (75/965) of all viral detections and of 5.7% (75/1315) of all viral/bacterial detections. During the first season, RSV clearly peaked between January and February 2024 with a monthly peak positivity rate of up to 18.9%. Conversely, in the 2024/2025 season, the observed detection rates plateaued at a comparatively low level (Fig. 1A).
Fig. 1
Detection rates of respiratory syncytial virus (RSV) and other respiratory viruses overall (A) and by RSV subtype (B); Genoa (Italy), 2023/2024 and 2024/2025 seasons
Although both RSV subtypes co-circulated, RSV A was predominant in both seasons (2023/2024: 61.1%; 2024/2025: 69.2%) (Fig. 1B). The population of molecularly characterized RSV A strains (n = 41) was heterogeneous and represented by subclades adjoining A.D.1* (26.8%), A.D.3* (51.2%), and A.D.5* (22.0%). Sequences of RSV B strains (n = 23) belonged to four different (sub)clades, of which B.D.E.1 (69.6%) was the most frequent (Table S4).
Of 75 RSV cases, 47 (62.7%) were single RSV detections, 10 (13.3%) samples were co-detected with other respiratory viruses, of which human rhinovirus was the most common, 11 (14.7%) were co-detected with H. influenzae and/or S. pneumoniae, while the remaining seven (9.3%) specimens showed a mixed viral/bacterial co-detection pattern (Table S5).
Compared with RT-PCR, RADT had low PPA (22.7%) and perfect NPA (100%). Indeed, if only RADT was used, the overall RSV prevalence would drop from 5.2% to 1.2%. RSV RADT performed comparatively well (PPA 63.2%) only for high viral load samples (cycle threshold < 25) (Table S6). Analogously, diagnostic performance of the two RT-PCR assays differed: compared with the Allplex Respiratory Panel 1, PPA and NPA of the Allplex SARS-CoV-2/FluA/FluB/RSV were 85.3% and 100%, respectively. The lower sensitivity of the latter kit was driven by low load samples (cycle threshold > 30) (Table S7).
Compared to RSV-negative subjects, those who tested positive for RSV exhibited a higher proportion of females (77.3% vs. 61.6%), and had ≥ 1 chronic condition (72.0% vs. 61.1%), particularly renal disease (9.3% vs. 4.1%) and obesity (18.7% vs. 9.4%). Other characteristics were comparable (Table S8).
Detection Rates of RSV and Other Respiratory Pathogens by Surveillance GroupOverall, RSV detection rate in the ARI group (5.8%; 43/741) was higher than in the ILI group (4.6%; 32/690). When only RSV mono-detections were considered, the difference was similar (ARI: 3.9%; ILI: 2.6%). This pattern was consistently observed in both 2023/2024 (ARI: 8.0%; ILI: 6.0%) and 2024/2025 (ARI: 4.7%; ILI: 3.8%) seasons and for both RSV A (ARI: 3.8%; ILI: 3.0%) and RSV B (ARI: 2.0%; ILI: 1.6%) subtypes. Of 75 RSV cases, 100% (75/75), 98.7% (74/75), 28.4% (21/74) and 33.8% (25/74) of individuals satisfied the ECDC ARI, ECDC ILI, CDC ILI, and WHO ILI criteria, respectively. RSV detection rates were slightly higher in individuals aged ≥ 75 years (5.6%; 24/430) than in younger adults (65–74 years: 4.7%, 18/379; 50–64 years: 5.3%, 33/622).
As shown in Fig. 2, in the base-case GEE model, the odds of any RSV and RSV mono-detections were 26% and 51% higher for subjects in the ARI than in the ILI groups, respectively. Alternative model specifications produced concordant results and the ORs were always higher for RSV mono-detections. Notably, when only GPs with ≥ 30 swabs were considered, the ORs of any and single RSV detections were 1.67 and 1.80, respectively. However, all 95% CIs included the null.
Fig. 2
Association between positivity for respiratory syncytial virus (RSV) and surveillance group; Genoa (Italy), 2023/2024 and 2024/2025 seasons. ARI acute respiratory infection, CI confidence interval, GP general practitioner, GEE generalized estimating equation, ILI influenza-like illness
In an exploratory analysis of all respiratory pathogens tested (Table S9), positivity to ≥ 1 pathogen was very similar (OR 0.96; 95% CI 0.60–1.53) between the ARI (74.9%) and ILI (73.2%) groups. With regard to single pathogens detected, patients in the ARI group more frequently tested positive for adenovirus (ARI: 1.1% vs. ILI: 0.3%; OR 3.75, 95% CI 0.85–16.60), enterovirus (ARI: 3.2% vs. ILI: 2.5%; OR 1.32, 95% CI 0.54–3.23), metapneumovirus (ARI: 6.5% vs. ILI: 5.2%; OR 1.25, 95% CI 0.71–2.22), and bacteria (ARI: 25.9% vs. ILI: 18.4%; OR 1.52, 95% CI 0.84–2.77). Conversely, SARS-CoV-2 (ARI: 7.4% vs. ILI: 12.2%; OR 0.57, 95% CI 0.34–0.95), influenza A(H1N1)pdm09 (ARI: 6.1% vs. ILI: 8.0%; OR 0.74, 95% CI 0.46–1.19), and parainfluenza viruses (ARI: 1.9% vs. ILI: 3.0%; OR 0.61, 95% CI 0.30–1.26) were more common findings in the ILI group.
Symptomatic Profile of Older Adults Who Tested Positive for RSVAmong RSV-positive adults, malaise (92.0%) was the most common systemic symptom, while cough (97.3%) and coryza (90.7%) were the most frequently reported respiratory symptoms (Table 2). Fever ≥ 38 °C was reported by only 31.1% of subjects. Compared to RSV-negative individuals, those positive for RSV had a higher prevalence of several respiratory symptoms (wheezing, productive cough, dyspnea, rhonchi, coryza, altered smell, and desaturation), while no systemic symptoms were predictive of RSV. An analysis based on RSV mono-detections showed generally comparable results apart from the altered smell that was no longer associated with RSV (Table S10). Considering both a low prevalence of desaturation in the entire cohort (5.1%) and a high prevalence of coryza among subjects tested positive for rhinovirus (88.4%), we selected the symptoms of wheezing, productive cough, rhonchi, and dyspnea for further evaluation.
Table 2 Association between positivity for respiratory syncytial virus (RSV) and signs and symptoms reported by adults aged ≥ 50 years; Genoa (Italy), 2023/2024 and 2024/2025 seasonsAll available ILI criteria (ECDC, CDC, and WHO) performed poorly for RSV with AUC values ≤ 0.51 (Table S11). Specificity was maximized (64.9%; 95% CI 62.3–67.5%) with the WHO case definition, but its sensitivity was only 28.4% (95% CI 19.4–39.5%). The newly proposed alternative RSV-specific case definition of ARI (RSV-ARI) with wheezing and/or productive cough and/or rhonchi and/or dyspnea performed better, the corresponding AUC, sensitivity and specificity parameters being 0.61 (95% CI 0.58–0.65), 92.0% (95% CI 83.6–96.3%), and 30.8% (95% CI 28.4–33.3%), respectively. Eventual use of only “wheezing” qualifier would increase specificity up to 86.7%, but the sensitivity would drop to 30.7% (Table S11). When applied to influenza, the alternative RSV-ARI case definition performed worse (AUC: 0.52; sensitivity: 74.2%; specificity: 30.1%), while the WHO (AUC: 0.71; sensitivity: 71.1%; specificity: 71.0%) and CDC (AUC: 0.71; sensitivity: 76.8%; specificity: 64.6%) ILI criteria performed the best.
Clinical Consequences of RSV InfectionAll participants completed the follow-up period. Of 75 RSV infections, 66.7% (50/75) did not fully recover by day 14 and the average duration of RSV episode was 20.1 (SD 7.8) days. Twenty-three (30.7%; 95% CI 20.5–42.4%) patients developed ≥ 1 complication that involved mostly (73.9%; 17/23) lower respiratory tract (Table 3). Two pneumonia cases, one of which was with pleural effusion, required hospitalization (case-hospitalization rate 2.7%; 95% CI 0.3–9.3%) and involved 71- and 96-year-old women. The sample of the former was positive for RSV B and H. influenzae, while the latter was positive for RSV A only. The 96-year-old woman developed acute respiratory failure and died 16 days after the initial GP visit (case-fatality rate 1.3%; 95% CI 0.0–7.2%). All hospitalizations and the death occurred in the ARI group.
Table 3 Clinical outcomes in adults aged ≥ 50 years who tested positive for respiratory syncytial virus (RSV); Genoa (Italy), 2023/2024 and 2024/2025 seasons (n = 75)Resource Consumption and CostsThe average number of GP visits associated with the RSV episode was 1.7 (SD 0.9), while 48.0% (36/75) had ≥ 1 follow-up visit. All but one (98.7%) patient took ≥ 1 medicine, of which antibiotics (57.3%), mucolytics (46.7%), and inhaled corticosteroids (41.3%) were the most prevalent. Additionally, 21.3% of patients performed ≥ 1 diagnostic test (mostly chest X-ray), while 6.7% had a specialist visit (Table S12).
The mean outpatient costs incurred by RSV-positive adults were € 74.40. The average hospitalization costs across all RSV-positive subjects were € 107.49. The mean hospitalization costs of the two hospitalized subjects were instead € 4031.00 (€ 3802.00 and € 4260.00, respectively). From the Italian NHS perspective, the mean cost of an RSV episode was € 168.71. Direct costs were generally skewed to the right with median costs being significantly lower than mean costs. Working adults (n = 28) lost on average 5.5 (SD 5.1) 8-h working days with the associated productivity loss of € 840.61. From the societal perspective, the mean cost of an RSV episode was € 899.51 for working adults and € 255.17 for non-working adults (Table 4).
Table 4 Direct and indirect episode costs incurred by adults aged ≥ 50 years who tested positive for respiratory syncytial virus (RSV) in the first 30 days after the onset of symptoms; Genoa (Italy), 2023/2024 and 2024/2025 seasons (n = 75)In an analysis stratified by RSV co-detection pattern, subjects with single RSV detections generally showed lower costs than subjects with co-detections (Table S13). For instance, among RSV mono-detections, the mean outpatient costs and total costs from the Italian NHS perspective were € 70.35 and € 138.51, respectively. The corresponding costs across subjects with co-detections were € 81.20 and € 219.42. However, owing to a smaller number of co-detections, the total mean costs from the Italian NHS perspective were influenced by a single hospitalized case. Indeed, median costs were more balanced between subjects with mono-detections (€ 49.11) and those with co-detections (€ 54.92) (Table S13).
Comments (0)