
Remember me
For the profiling of phenolic phytocompounds, the seaweed samples were extracted using a common solvent mixture (70% acetone) that has been employed for a variety of different plant or plant-like materials, such as herbs and leafy vegetables [18], fruits [19, 20], berries [21, 22], flowers [16, 23], and seaweeds [24]. The seaweed extracts were then analyzed by LC–MS/MS in an untargeted fashion, using a stepped NCE fragmentation method that ensures richer and more diagnostic MS/MS spectra, especially in the case of compounds conjugated with sugar via acetal bonds [16, 25]. In particular, the acquisition was performed with a three-step normalized collision energy of 20–40–60 NCE, thus allowing simultaneous fragmentation of weak acetal bonds and strong aromatic and/or conjugated aglycones. The untargeted approach was aimed at gathering comprehensive knowledge on the phenolic compound composition of edible seaweeds, which has not been fully explored yet [9]. Seaweeds are known to display a unique composition of phenolics, which has recently gained attention for the numerous beneficial effects on the human body through seaweed consumption [26, 27]. In particular, sulfated phenolics are believed to be solely produced by marine organisms, whereas other sulfur-containing compounds, such as glucosinolates, are synthesized by terrestrial plants [28].
For these reasons, the untargeted datasets were first processed using a previously set up data analysis platform that was customized on Compound Discoverer software for phenolic compounds [16]. The data processing platform was based on a suspect screening compound annotation approach, in which a comprehensive mass list of 45,567 phenolic compound derivatives, including flavonoids, anthocyanins, phenolic acids, ellagitannins, and proanthocyanidins, either free or conjugated to sugars, cyclitols, and carboxylic acids, was created. These preliminary experiments were aimed at screening the nature of the non-sulfated phenolics to build a phenolic compound database for seaweeds that would also consider the sulfation of the free hydroxyl groups. Unsurprisingly, phenolic acids of various subclasses were annotated, including hydroxybenzoic acids (e.g., dihydroxybenzoic acid), hydroxycinnamic acids (e.g., coumaric acid), and hydroxyphenylacetic acids (e.g., phenyllactic acid). Conversely, none of the flavonoid/anthocyanin — either free or conjugated — entries in the database were matched. For these reasons, and with the support of the literature [9], a database of sulfated and non-sulfated phenols, phenolic acids, coumarins, and phlorotannins was built as described in the “Materials and methods” section and was employed as a Mass List for a new customized data processing workflow on Compound Discoverer.
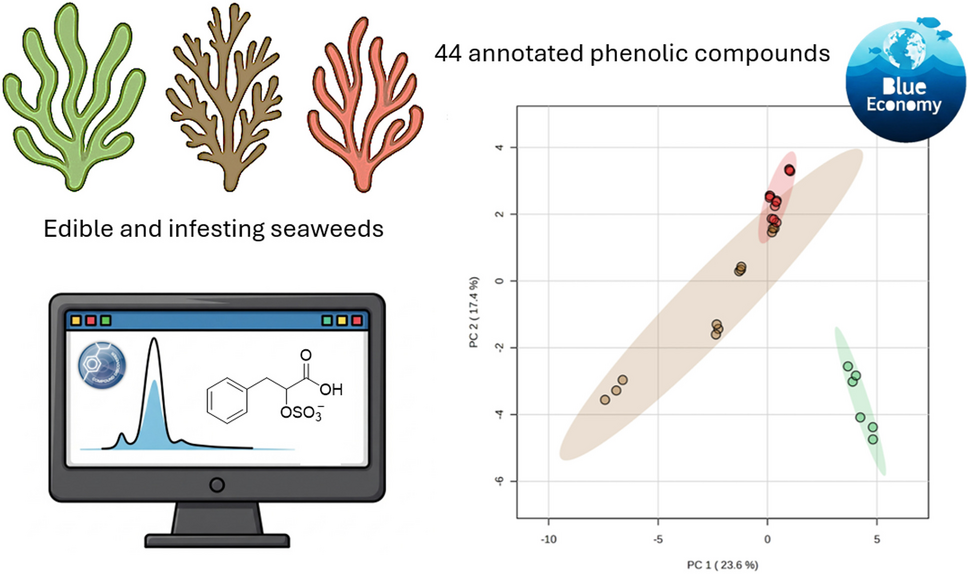
Following data preprocessing, a list of 53,429 features was extracted from the seaweed datasets. However, data filtering based on the customized Mass List allowed the removal of 53,068 features, whose molecular formulas and weights were not present in the datasets and whose MS spectrum was not associated with an MS2 spectrum. The dedicated data processing workflow therefore filtered out more than 99% of the original features, thus leaving only 361 features for manual validation of the MS data. Following careful spectral annotation, 44 phenolics were tentatively identified, as reported in Table 1 with their identification data, i.e., retention time (RT), molecular formula, molecular weight, experimental m/z, mass error, diagnostic production ions, and confidence level according to Schymanski et al. [29].
Table 1 Retention times (RT, min), proposed formulas, experimental m/z, accuracy (Δ, ppm), main diagnostic product ions, and confidence level of the identification (C. L.) of the 44 annotated phenolic compounds in edible and infesting seaweedsThe largest group of annotated phenolics was phenolic acids (24 identifications), equally distributed between sulfated and non-sulfated compounds, followed by phenol sulfates (8 compounds), phlorotannins, and coumarins (6 compounds each). Overall, sulfated phenolic compounds outnumbered their non-sulfated counterparts (25 and 19 annotations, respectively), thus confirming the need for a dedicated data processing platform for the annotation of such unusual phenolic structures when seaweed samples are characterized.
Retention times were helpful for compound annotation. Homolog structures that differ for the number of hydroxyl groups were eluted from the most to the least hydrolyzed, e.g., phloroglucinol sulfate (compound 1; two free OH groups, RT = 0.6) < catechol sulfate (compound 4; one free OH groups, RT = 0.8) < phenol sulfate (compound 16; no free OH groups, RT = 1.5). Moreover, the introduction of a sulfate group generally determined a slightly lower RT compared to the non-sulfated counterpart, e.g., phenyllactic acid sulfate (compound 34, RT = 4.9) < phenyllactic acid (compound 35, RT = 53). One exception to these trends regards compounds 41 and 43, annotated as two isomers of dihydroxydimethyl coumarin, which eluted earlier than compound 44, which was attributed to dihydroxydimethyl coumarin sulfate. However, coumarin peaks had an extremely low intensity in all analyzed seaweeds, and there were other peaks with the same m/z as compounds 41 and 43 at higher retention times that could not be annotated due to their even lower ion intensity. Compound 44 might effectively be a sulfated derivative of one of these possible unidentified peaks.
Figure 1 shows the MS/MS of two phenolic acid sulfates in comparison with their non-sulfated counterparts. Phenyllactic acid (compound 35, Fig. 1a) is an important broad-spectrum antimicrobial compound [30], whose identification was based on the match of the experimental MS/MS spectrum to the one in the mzCloud database (https://www.mzcloud.org/). Its sulfated counterpart (compound 34, Fig. 1b) was annotated based on the presence of the three main diagnostic ions of phenyllactic acid (m/z 165.0555, 147.0450, and 119.0501) as well as an intense ion at m/z 96.9594, which corresponds to HSO4−, thus indicating the sulfation of the alkylic OH group of phenyllactic acid. Hydroxyphenyllactic acid (compound 19, Fig. 1c) was again annotated based on the match of the experimental MS/MS spectrum to the mzCloud database and shows analog fragmentation as phenyllactic acid, with sequential H2O and CO neutral losses (m/z 163.0400 and 135.0452). Moreover, the aromatic OH group stabilizes the negative charge and allows the cleavage of the carboxyl group (m/z 119.0502). Similarly, all the diagnostic product ions of hydroxyphenyllactic acid were present in the MS/MS spectrum of the sulfated analog (compound 17, Fig. 1d). However, the peak of the sulfate group was found at m/z 79.9567 (instead of m/z 96.9594), thus indicating the location of the sulfation. The bond dissociation energies of C–OH bonds for methanol and phenol are estimated at around 90 and 110 kcal mol−1, respectively [31]. As such, due to the significantly higher bond dissociation energy (BDE) of C–OH bonds of phenol groups, the loss of sulfate groups located onto aromatic rings generates an SO3− ion rather than the HSO4−, indicating cleavage of the O-S bond rather than the C-O bond. These results are in agreement with the MS/MS spectra of phenol and catechol sulfates, which possess only aromatic OH groups and only generate SO3− ions. The same rationale applies to hydroxybenzoic acid sulfate (compound 15), dihydroxybenzoic acid sulfate (compound 12), hydroxyphenylacetic acid sulfate (compound 24), dihydroxyphenylacetic acid sulfate (compound 22), and hydroxymethoxyphenylacetic acid sulfate (compound 27), whose only possible site of sulfation is the aromatic OH group. Interestingly, the two isomers of dihydroxyphenyllactic sulfate could be distinguished based on the site of the sulfation. The first isomer (compound 8) generated an intense HSO4− ion typical of the sulfation of the benzyl alcohol, whereas the sulfate group was located on one of the phenol groups on the second isomer (compound 11). Finally, the disulfate of dihydroxyphenyllactic acid (compound 9) showed both diagnostic ions, thus indicating the sulfation of both the benzyl and the phenyl OH groups. Despite the coexistence of aromatic and aliphatic OH groups, the sulfation of tyrosol and hydroxytyrosol only occurred on the phenol rings (compounds 25 and 20).
Fig. 1
Tandem MS spectra of annotated phenyllactic acid (a, RT = 1.6), phenyllactic acid sulfate (b, RT = 1.5), hydroxyphenyllactic acid (c, RT = 5.3), and hydroxyphenyllactic acid sulfate (d, RT = 4.9) from the seaweed extract datasets
Phenolic compound content in edible and infesting seaweedsThe annotated sulfated and non-sulfated phenolics data matrix was subjected to statistical analysis to assess possible trends and variability in the content of phenolic compounds and compound classes in the distinct analyzed samples. Metaboanalyst was employed for data processing [17], and four distinct analyses were carried out: (i) the content of the single annotated compounds in the ten seaweed samples, (ii) the content of the single annotated compounds in the three seaweed classes (brown vs red vs green), (iii) the content of the phenol compound classes in the ten seaweed samples, and (iv) the content of the phenol compound classes in the three seaweed classes. The 44 annotated compounds were grouped into five classes: phenol sulfates (7 compounds), phenolic acids (12 compounds), phenolic acid sulfates (12 compounds), coumarins (6 compounds), and phlorotannins (7 compounds). Sulfated and non-sulfated coumarins and phlorotannins had to be grouped due to their low number. Preliminary studies were conducted to determine the distribution of the annotated compounds in the six subclasses. In particular, the correlation heatmap hierarchical clustering shown in Figure S1 was employed to allocate phloroglucinol sulfate in the phlorotannin sulfate subclass. Despite being structurally a phenol sulfate, phloroglucinol sulfate was highly correlated with phlorotannin sulfates, for which phloroglucinol is a monomer. Figure 1a shows the principal component analysis (PCA) based on the content of the single annotated compounds in the ten seaweed samples. Alongside principal component 1 (PC1), explaining 23.6% of the total variance, the two analyzed green seaweeds (U. lactuca and U. rigida) were clustered at positive values, whereas three brown seaweeds (L. digitata, H. elongata, and S. latissima) had negative values. The other five samples (all red seaweeds and U. pinnatifida) were clustered around zero. Figure 1b shows the same data when seaweeds are grouped based on their taxonomy. Both red and green seaweeds were highly clustered, whereas the brown algae were more dispersed, with Wakame algae (U. pinnatifida) overlapping red algae and being at a long distance from L. digitata. Green algae showed a generally higher abundance of phenol and phenolic acid sulfates, as shown in Figures S2a and S2b, for phenol sulfate and catechol sulfate, respectively. Conversely, brown seaweeds — with the exception of Wakame — were characterized by phlorotannin sulfates, as shown in Figures S2c-f. In particular, the results shown in Figure S2c for phloroglucinol sulfate confirm the correlation with phlorotannins discussed earlier. Phlorotannins are known to be uniquely produced by brown seaweeds and have gained interest for their antioxidant, anti-inflammatory, anti-cancer, and antimicrobial properties [32]. The hierarchical cluster dendrogram and heatmap (Fig. 2c) summarize the results in terms of the content of the single annotated phenolic compounds in the analyzed seaweed samples. The dendrogram confirms that green algae stand out from both red and brown algae. Moreover, Wakame had a phenol profile that was much closer to the four analyzed red seaweeds compared to the other three brown algae, which had the highest abundance in terms of phlorotannins as well as tyrosol derivatives. It appears clear that, except for some coumarins, red algae had, in general, a lower phenol content. Interestingly, coumarins had relatively higher concentrations also in U. pinnatifida. These findings might be attributed to the convergent evolution of brown algae, which developed a plant-like body plan and specialized transport network despite being only distantly related to plants [33].
Fig. 2
Scores plots of the principal component analysis using the 44 annotated phenolic compounds in the 10 seaweed strains analyzed individually (a) and grouped based on class (b). Hierarchical cluster dendrogram and heatmap using the 44 annotated phenolic compounds in the three groups of seaweeds (c)
The content of the phenolic compound classes was then investigated. As shown in Figure S3, phenol sulfates and phenolic acid sulfates had their highest abundances in U. lactuca and U. rigida, whereas phlorotannins had their highest abundance in brown algae (except U.pinnatifida). The coumarin content was more variable, with the highest abundance in red C. crispus and P. palmata and brown U. pinnatifida and H. elongata, while the lowest areas were in the two analyzed green seaweeds and red G. gracilis. The latter three also shared similar high phenol sulfate content. The trends based on the algae class are shown in Figure S4, in which the specificity of phenolic acid sulfate and phlorotannins for green and brown seaweeds, respectively, is even more evident, as well as the inconsistent abundance of coumarins based on the seaweed taxonomy. Green algae had the highest total amount of phenolic compounds based on the total peak area of the annotated compounds, as seen in Figure S3–4, in which the areas of phenol sulfates and phenolic acid sulfates were up to three orders of magnitude higher than in brown and red seaweeds.
A significant result that can be inferred from the experimental data is related to the comparison between edible and infesting seaweeds. In terms of the phenolic compound content, there seem to be no substantial differences between edible and infesting seaweeds belonging to the same taxon. Purchased edible U. lactuca and infesting U. rigida from the Adriatic Sea were effectively highly correlated, both rich in sulfated phenols and phenolic acids. These results hint at the possible use of infesting seaweed as a source of bioactive compounds in line with the principles of the Blue Economy.
Comments (0)