
Remember me


There were 495 patients with HCC referred for LT during the study period. The majority were men (74.1%), and the median age at referral was 62.0 years (IQR 58.0–67.0), (Table 1). Additionally, 8.7% of the cohort was Black race, 2.8% Asian, and 4.0% Hispanic ethnicity. The most common underlying liver disease etiology was ALD (34.9%), followed by HCV (31.5%) and MASH (21.8%). The mean MELD-Na score was 12.0 (± 5.4), and 73.7% were within the Milan criteria and 91.2% had an AFP < = 500 at the time of referral. The majority of patients were insured by Medicaid (57.2%), 53.5% of the cohort were married, and the mean ADI was 69.0 (± 21.1) (Table 1).
Table 1 Demographic and Clinical Characteristics of Patients with Hepatocellular Carcinoma Waitlisted for Liver TransplantationSignificant demographic differences were observed between those who were waitlisted and those who were not, including race, ethnicity, marital status, insurance, ADI, etiology, Milan criteria, BCLC stage, AFP, and MELD-Na. Among Black patients referred for LT, 16.3% were waitlisted compared to 36.0% of White patients (p = 0.030). The waitlisted cohort included 9 (5.5%) Hispanic patients, 153 (92.7%) in the non-Hispanic waitlisted group, and 3 (1.8%) of unknown ethnicity (p = 0.010). Additionally, a significantly higher proportion of the waitlisted patients were married compared to non-waitlisted patients (65.5% vs. 47.6%, p = 0.010), and waitlisted subjects were more commonly to be privately insured than non-waitlisted subjects (46.7% vs. 36.1%, p = 0.025). Those waitlisted had a significantly lower ADI (mean 65.6 ± 21.3 vs. 70.8 ± 20.8, p = 0.008). Waitlisted patients were more often within Milan criteria (86.7% vs. 67.3%, p < 0.001), had a BCLC stage of 0 or A (73.9% vs. 59.9%, p = 0.006), had higher MELD-Na values (mean 11.7 ± 5.3 vs. 12.6 ± 5.7 p = 0.039), and higher AFP levels (median 8.7 [IQR 4.3–49.9] vs. 5.3 [IQR 3.3–12.2], p < 0.001), (Table 1).
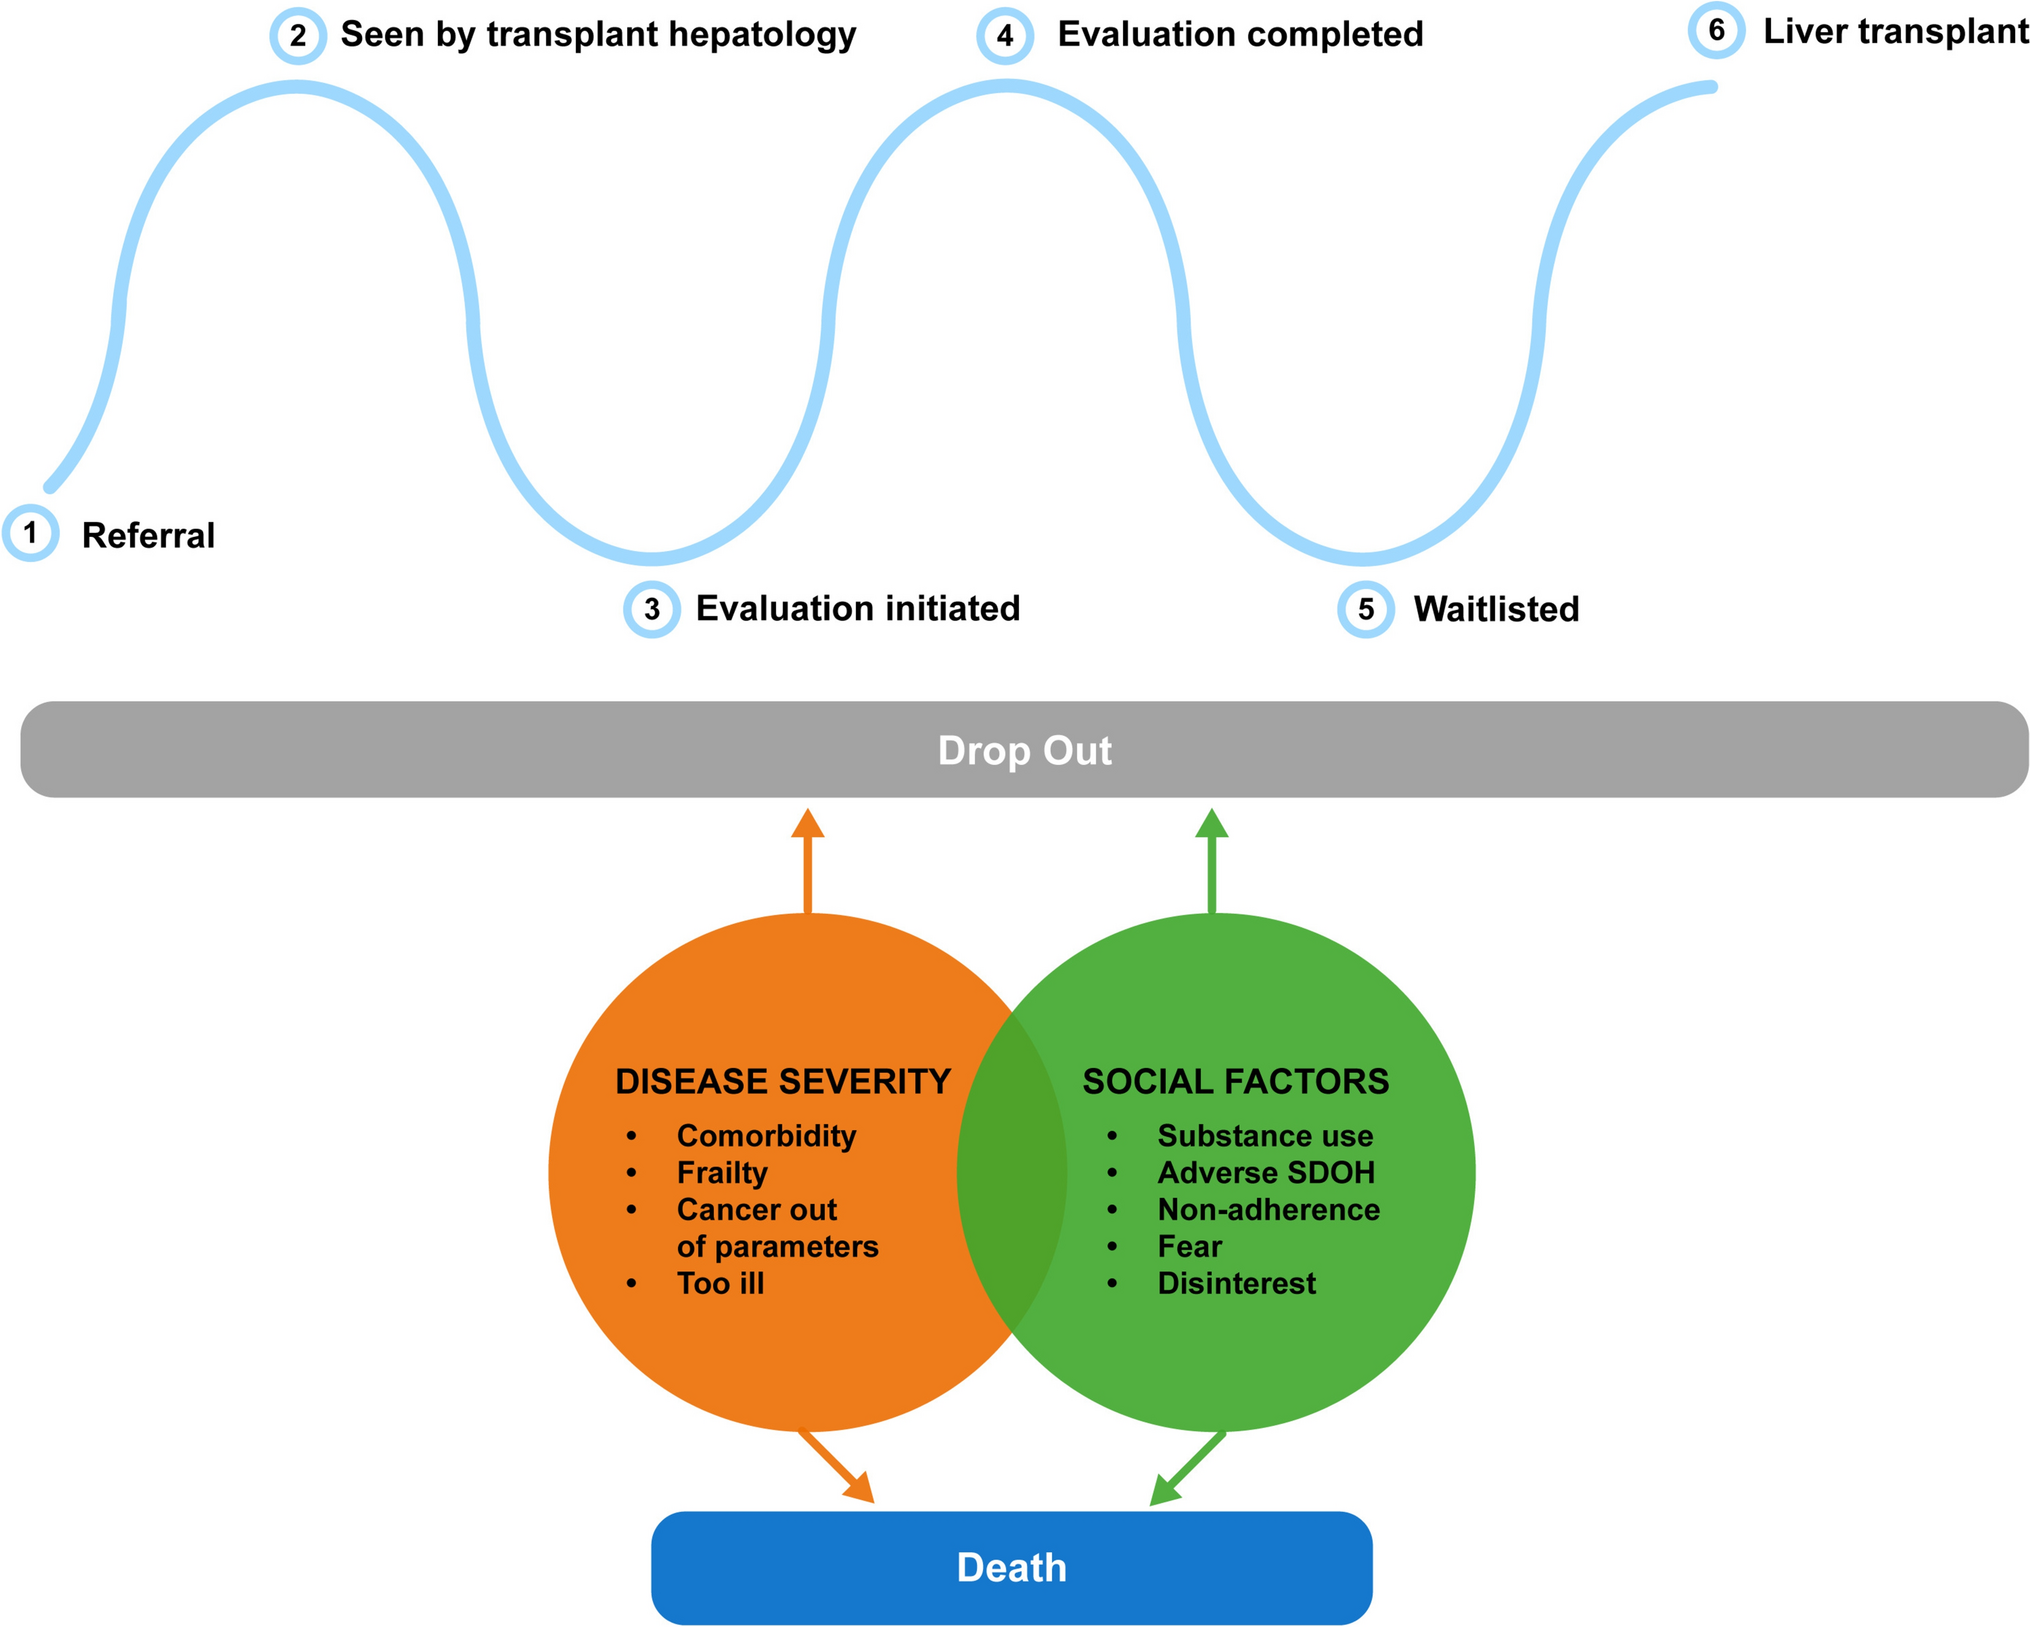
Completion of Steps in the HCC Liver Transplantation PathwayThere were 495 patients referred for LT. Their progression through six steps in the LT pathway is described in Fig. 2. Of those referred for LT, 452 (91.3%) were seen by transplant hepatology to be considered for evaluation, 313 (63.2%) started LT evaluation, 182 (36.8%) completed LT evaluation, 165 (33.3%) were waitlisted, and 133 (26.9%) underwent LT.
Fig. 2
Reasons for dropout from each step in the HCC–LT pathway
Among the 313 patients with evaluation start dates, the median time from referral to evaluation start was 36 days (mean 64.6 days). For the 165 waitlisted patients, the median time from referral to waitlisting was 188 days (mean 250.6), and the median time from evaluation start to waitlisting was 133 days (mean 181.7). For the 133 transplanted patients, the median time from waitlisting to transplant was 140 days (mean 168.6). Time from evaluation start was not statistically associated with waitlisting or transplant, nor with being categorized as having social or clinical barriers.
Overall, 129 patients failed to complete the HCC–LT pathway due to social reasons (Fig. 3). A full comparison of how these patients compare to the rest of the cohort is described in Table 2. Those patients who failed to complete the HCC–LT pathway for social reasons were more likely to be younger (59.4 ± 9.5 vs. 62.4 ± 7.3, p = 0.013) and unmarried (65.0% vs 43.4%, p = 0.034) than the rest of the cohort (Table 2).
Fig. 3
Composite social and disease-related reasons for dropout in the HCC–LT pathway
Table 2 Patients with social barriers to completing the HCC–LT pathwayAdditionally, 141 patients failed to complete the HCC–LT care pathway due to disease severity-related barriers (Fig. 3). A full comparison of how these patients compare to the rest of the cohort is described in Table 3. Those patients who failed to complete the HCC–LT pathway for disease severity-related reasons were more commonly women (34.0% vs 22.6%, p = 0.009) and insured by Medicaid (65.2% vs 54.0%, p = 0.015) than the rest of the cohort (Table 3). Notably, among women referred, 37.5% of women had disease-related barriers compared to 25.3% of men referred (p = 0.009).
Table 3 Patients with disease-related barriers to completing the HCC–LT pathwayAfter referral, 35 died and 57 patients had other reasons for dropout (Fig. 2).
Detailed reasons for failing to complete each step are described below:
Dropouts Between Step 1 (Referral for Evaluation) and Step 2 (Being Seen by Transplant Hepatology)Of the 495 patients referred for LT for HCC, 452 (91.3%) were seen by transplant hepatology. Reasons for not seeing transplant hepatology after referral included insurance denial (n = 14) and referring provider’s intention being tumor board review instead of LT (n = 29).
Dropouts Between Step 2 (Seen by Transplant Hepatology) and Step 3 (Evaluation Started)Of the 452 patients who were seen by transplant hepatology, 139 (30.8%) did not have an evaluation started. The most common reason for not having an evaluation started was patients' disinterest and fear (n = 36, 25.9%) followed by cancer being outside of criteria (n = 24, 17.3%) (Supplemental Fig. 1a–d). Failure to have an evaluation start for additional social reasons to patient disinterest and fear included ongoing alcohol or substance use (n = 13, 9.4%), loss to follow-up and non-adherence (n = 13, 9.4%), and adverse SDOH (n = 5, 3.6%) amounting in total to 48.2% of those who did not have an evaluation started (Supplemental Fig. 1a–d).
Dropouts Between Step 3 (Evaluation Start) and Step 4 (Evaluation Completion)Of the 313 patients who began evaluation, 131 (41.9%) were unable to complete the process. This represented the largest dropout step in the pathway. The most common reasons for inability to complete this step were cancer progression outside of criteria (n = 36, 27.5%), becoming too sick or frail (n = 36, 27.5%), and patient disinterest and fear (n = 20, 15.3%) (Supplemental Fig. 1a–d). Inability to complete an evaluation for social reasons, including ongoing alcohol of substance use (n = 12, 9.2%), loss to follow-up and non-adherence (n = 6, 4.6%), adverse SDOH (n = 7, 5.3%), and disinterest and fear (n = 20, 15.3%), amounted in total to 34.4% of those who did not complete evaluation (Supplemental Fig. 1a-d).
Dropouts Between Step 4 (Evaluation Completion) and Step 5 (Waitlisting)Of the 182 patients who completed evaluation, 165 (90.7%) were waitlisted for LT. The most common reason for not being waitlisted after evaluation completion was cancer progression outside of criteria (n = 5, 29.4%) and becoming too sick or frail (n = 5, 29.4%). There was one patient not waitlisted after evaluation completion due to disinterest/fear (n = 1, 5.9%) (Supplemental Fig.1a–d).
Dropouts Between Step 5 (Waitlisting) and Step 6 (Transplant)Of the 165 patients who were waitlisted, 133 underwent LT. The most common reasons for waitlist dropout were cancer progression outside of criteria (n = 15, 46.9%) and becoming too sick or frail (n = 9, 28.1%). There was one patient who failed to complete this step due to non-adherence (n = 1, 3.13%) and one who was disinterested/fearful (n = 1, 3.13%) (Supplemental Fig. 1a–d).
Predictors of Waitlisting and MortalityFrom univariable analysis, Black vs White race, underlying etiology, Milan status, BCLC stage, marital status, insurance type, AFP, and ADI were significant predictors of waitlisting (Table 4). From multivariable analysis, being within Milan (aOR 3.44, 95% CI 1.98–6.00, p = < 0.001), having private insurance (aOR 1.74, 95% CI 1.10–2.73, p = 0.017), and being married (aOR 1.62, 95% CI 1.04–2.52, p = 0.033) remained significant predictors of being waitlisted (Table 4).
Table 4 Demographic, clinical, and SDOH associated with odds of waitlistingPredictors of death during LT evaluation for HCC from univariable analysis included MELD-Na score, AFP, Milan status, BCLC stage, ADI, marital status, and insurance type (Table 5). From multivariable analysis, Milan status (aHR 0.59, 95% CI 0.40–0.87, p = 0.008), MELD-Na score (aHR 1.04, 95% CI 1.01–1.07, p = 0.008), and ADI quartile 4 (aHR 1.72, 95% CI 1.08–2.75, p = 0.023) remained significant predictors of death (Table 5).
Table 5 Demographic, clinical, and SDOH associated with odds of deathTo assess the robustness of our findings regarding the association between exposure and outcome and account for dropout overinflation due to LT ineligibility due to clinical reasons, we conducted a series of sensitivity analyses. The direction and magnitude of the association between exposure and outcome remained fairly consistent with our primary analysis with some notable changes and additional significant predictors of waitlisting and death.
In multivariable analysis excluding patients outside of Milan criteria (n = 377), insurance type remained a significant predictor of waitlisting. Notably, ADI quartile 3 vs 1 (aOR 0.51, 95% CI 0.27–0.97, p = 0.040) and ADI quartile 4 vs 1 (aOR 0.42, 95% CI 0.21–0.84, p = 0.014) were newly significant predictors of waitlisting (Supplementary Table 3). ADI quartile 4 vs 1 remained a significant predictor of death. Additionally, marital status (aHR 0.64, 95% CI 0.42–1.00, p = 0.048) emerged as a new significant predictor of death in this scenario (Supplementary Table 4).
In multivariable analysis excluding patients with BCLC C or D status outside of Milan criteria (n = 465), marital status and insurance type remained significant predictors of waitlisting. ADI quartile 4 vs 1 (aOR 0.52, 95% CI 0.28–0.97, p = 0.040) emerged as newly significant predictors of waitlisting (Supplementary Table 5). MELD-Na and ADI quartile 4 (aHR 1.82, 95% CI 1.12–2.95, p = 0.016) remained significant predictors of death (Supplementary Table 6).
We also conducted an exploratory analysis to examine the effect of distance on waitlisting status. Using the US Census Bureau geocoder, we calculated the distance in kilometers from patient address to transplant center for 452 of the 495 participants. Limiting the analysis to participants within Indiana, Kentucky, Ohio, or Illinois (N = 437), we found that distance to the transplant center was not significantly associated with waitlisting status (OR 1.00, 95% CI 1.00–1.00, p = 0.938).
Comments (0)