
Remember me
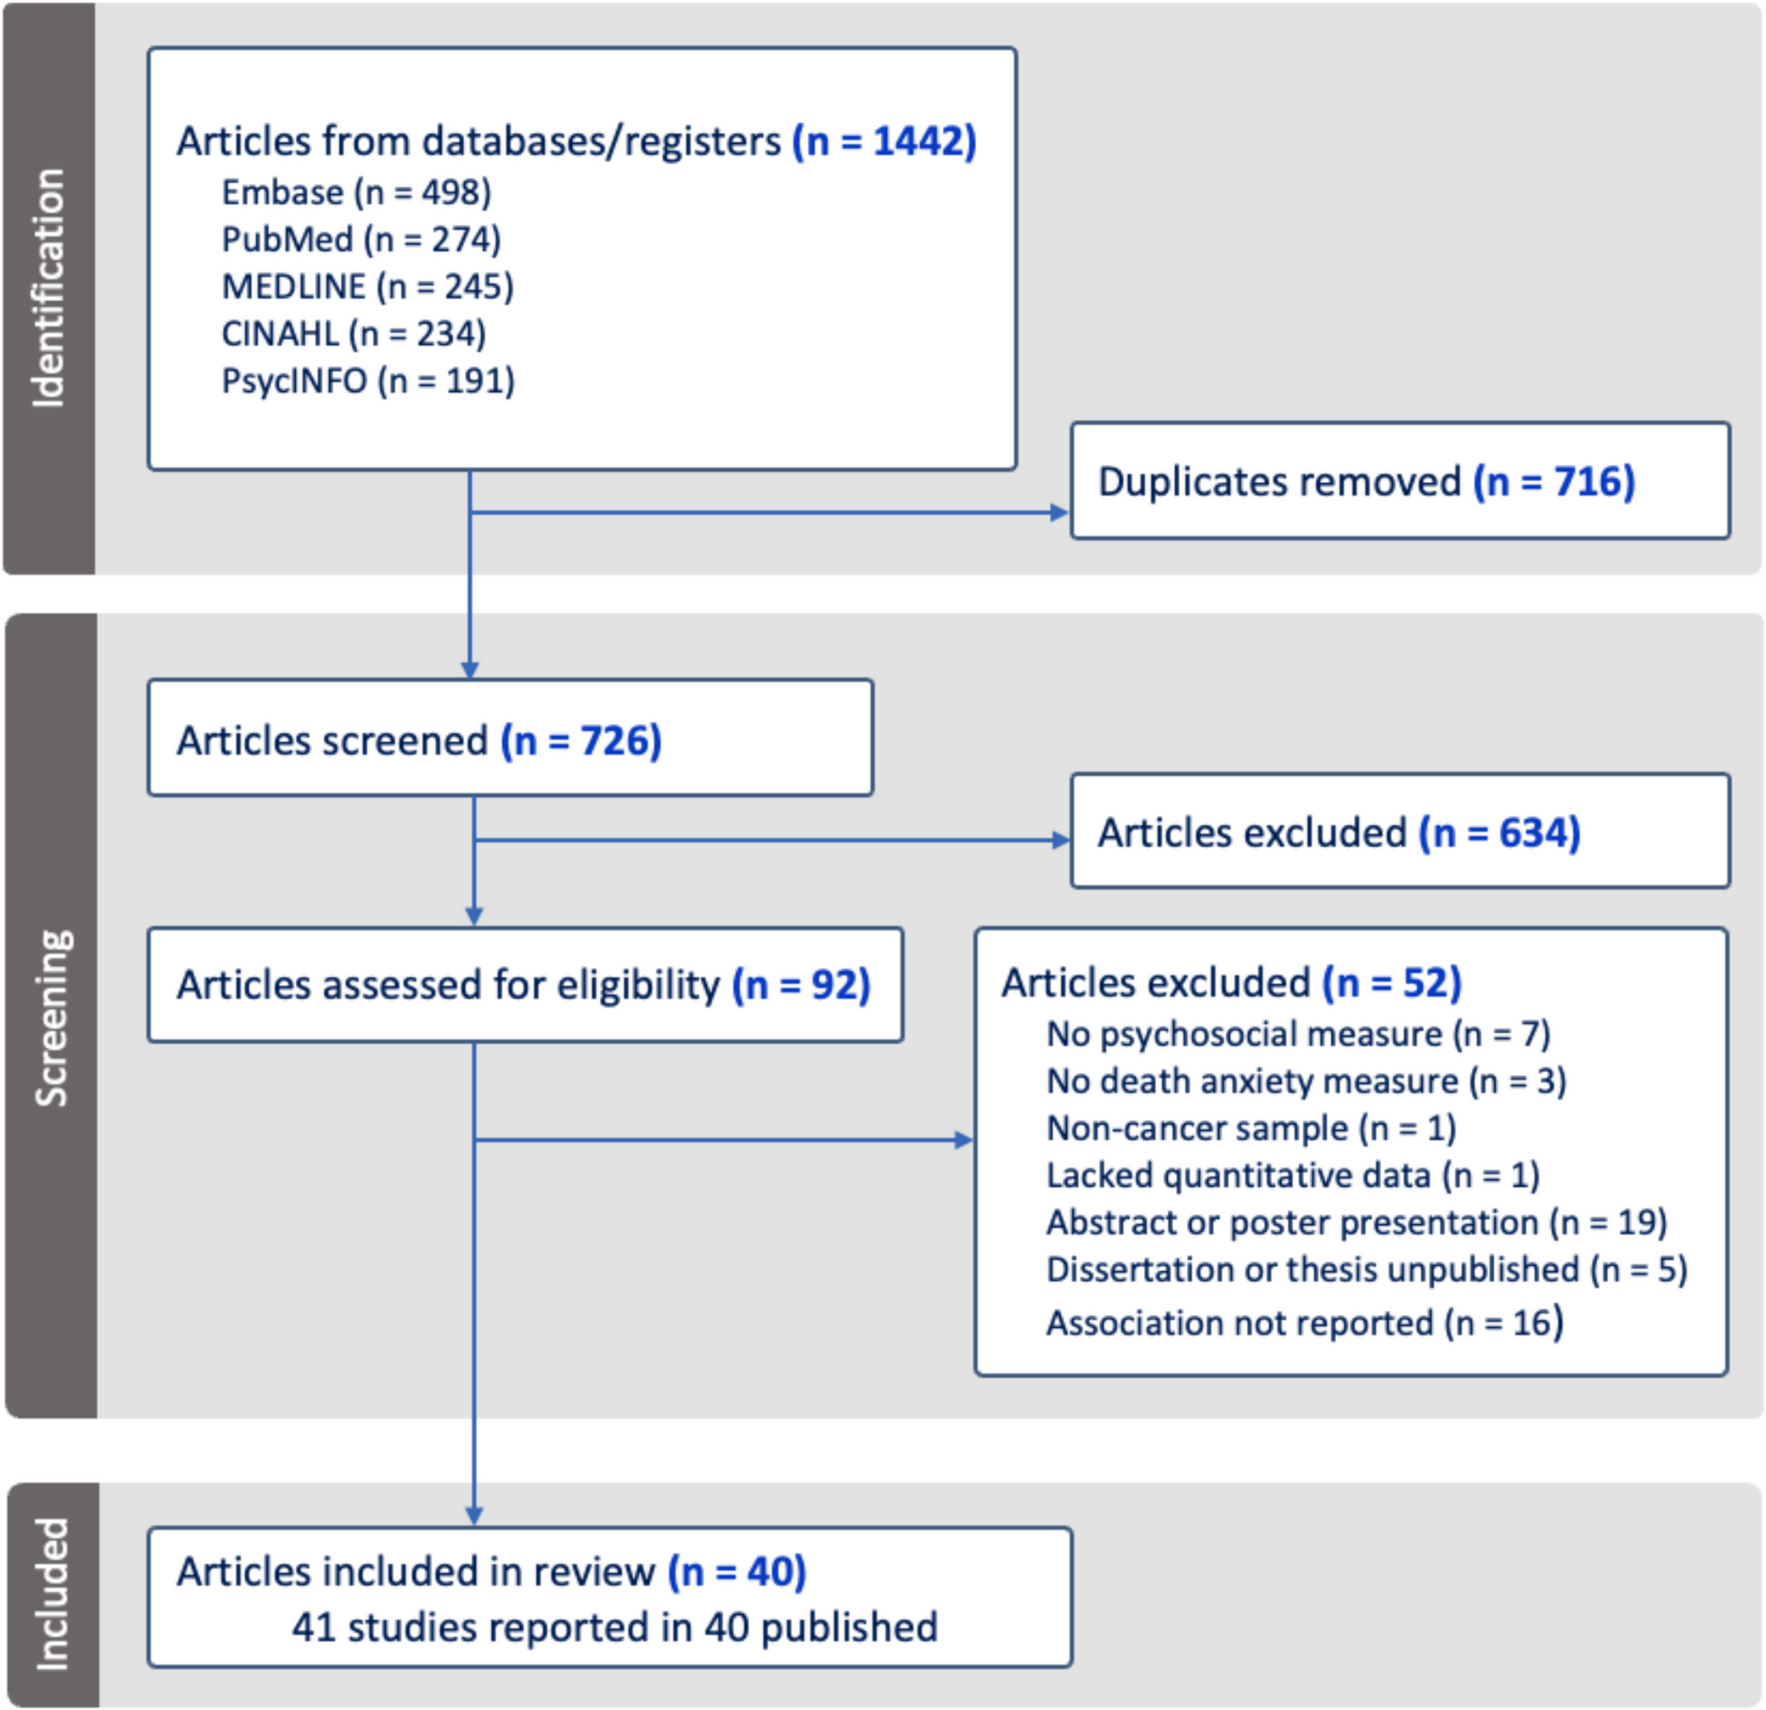
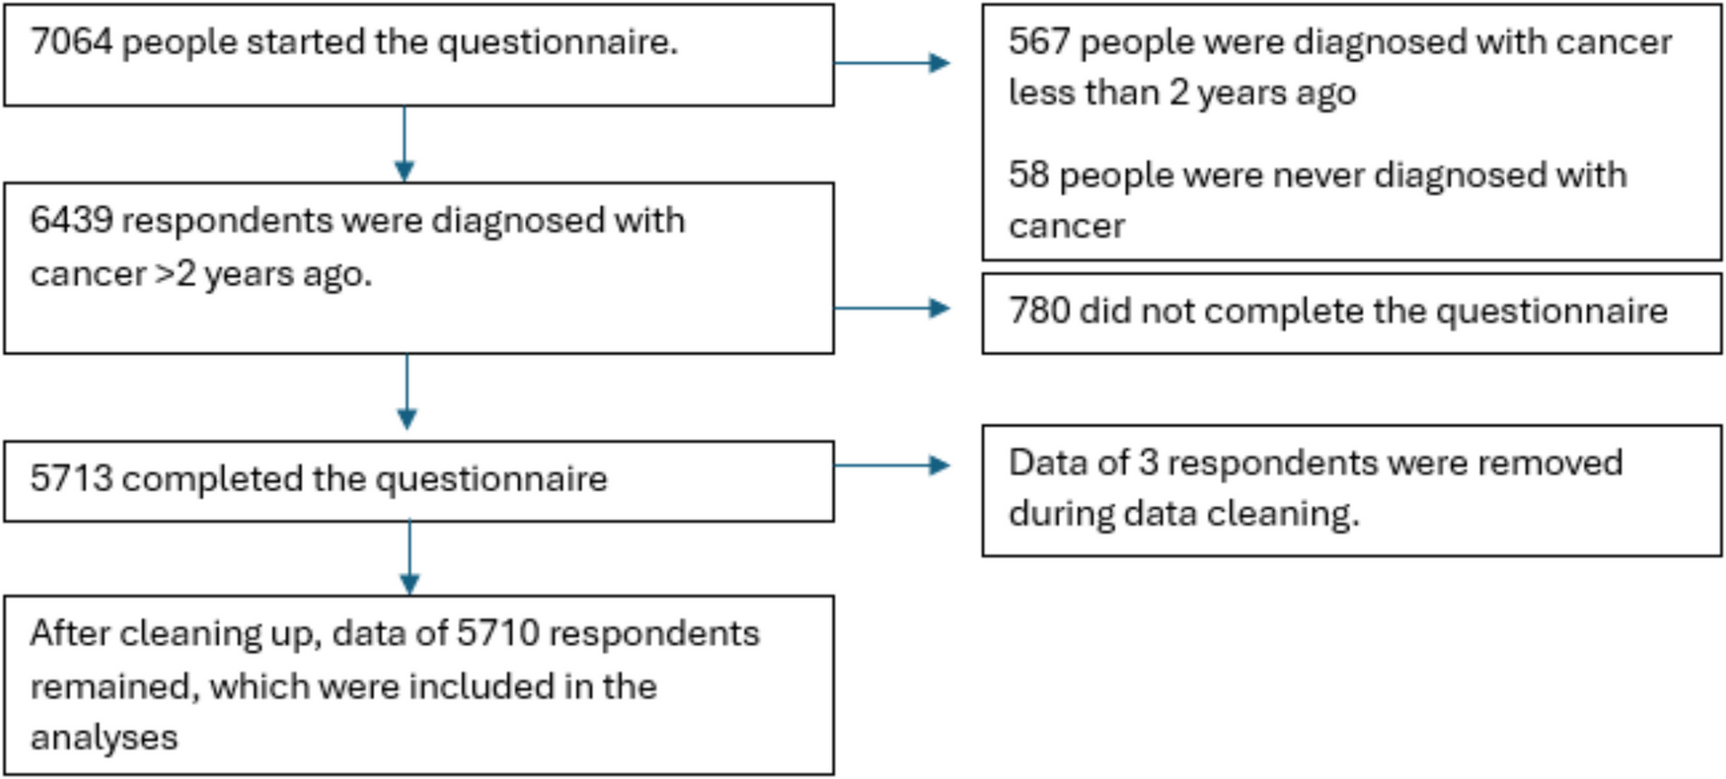
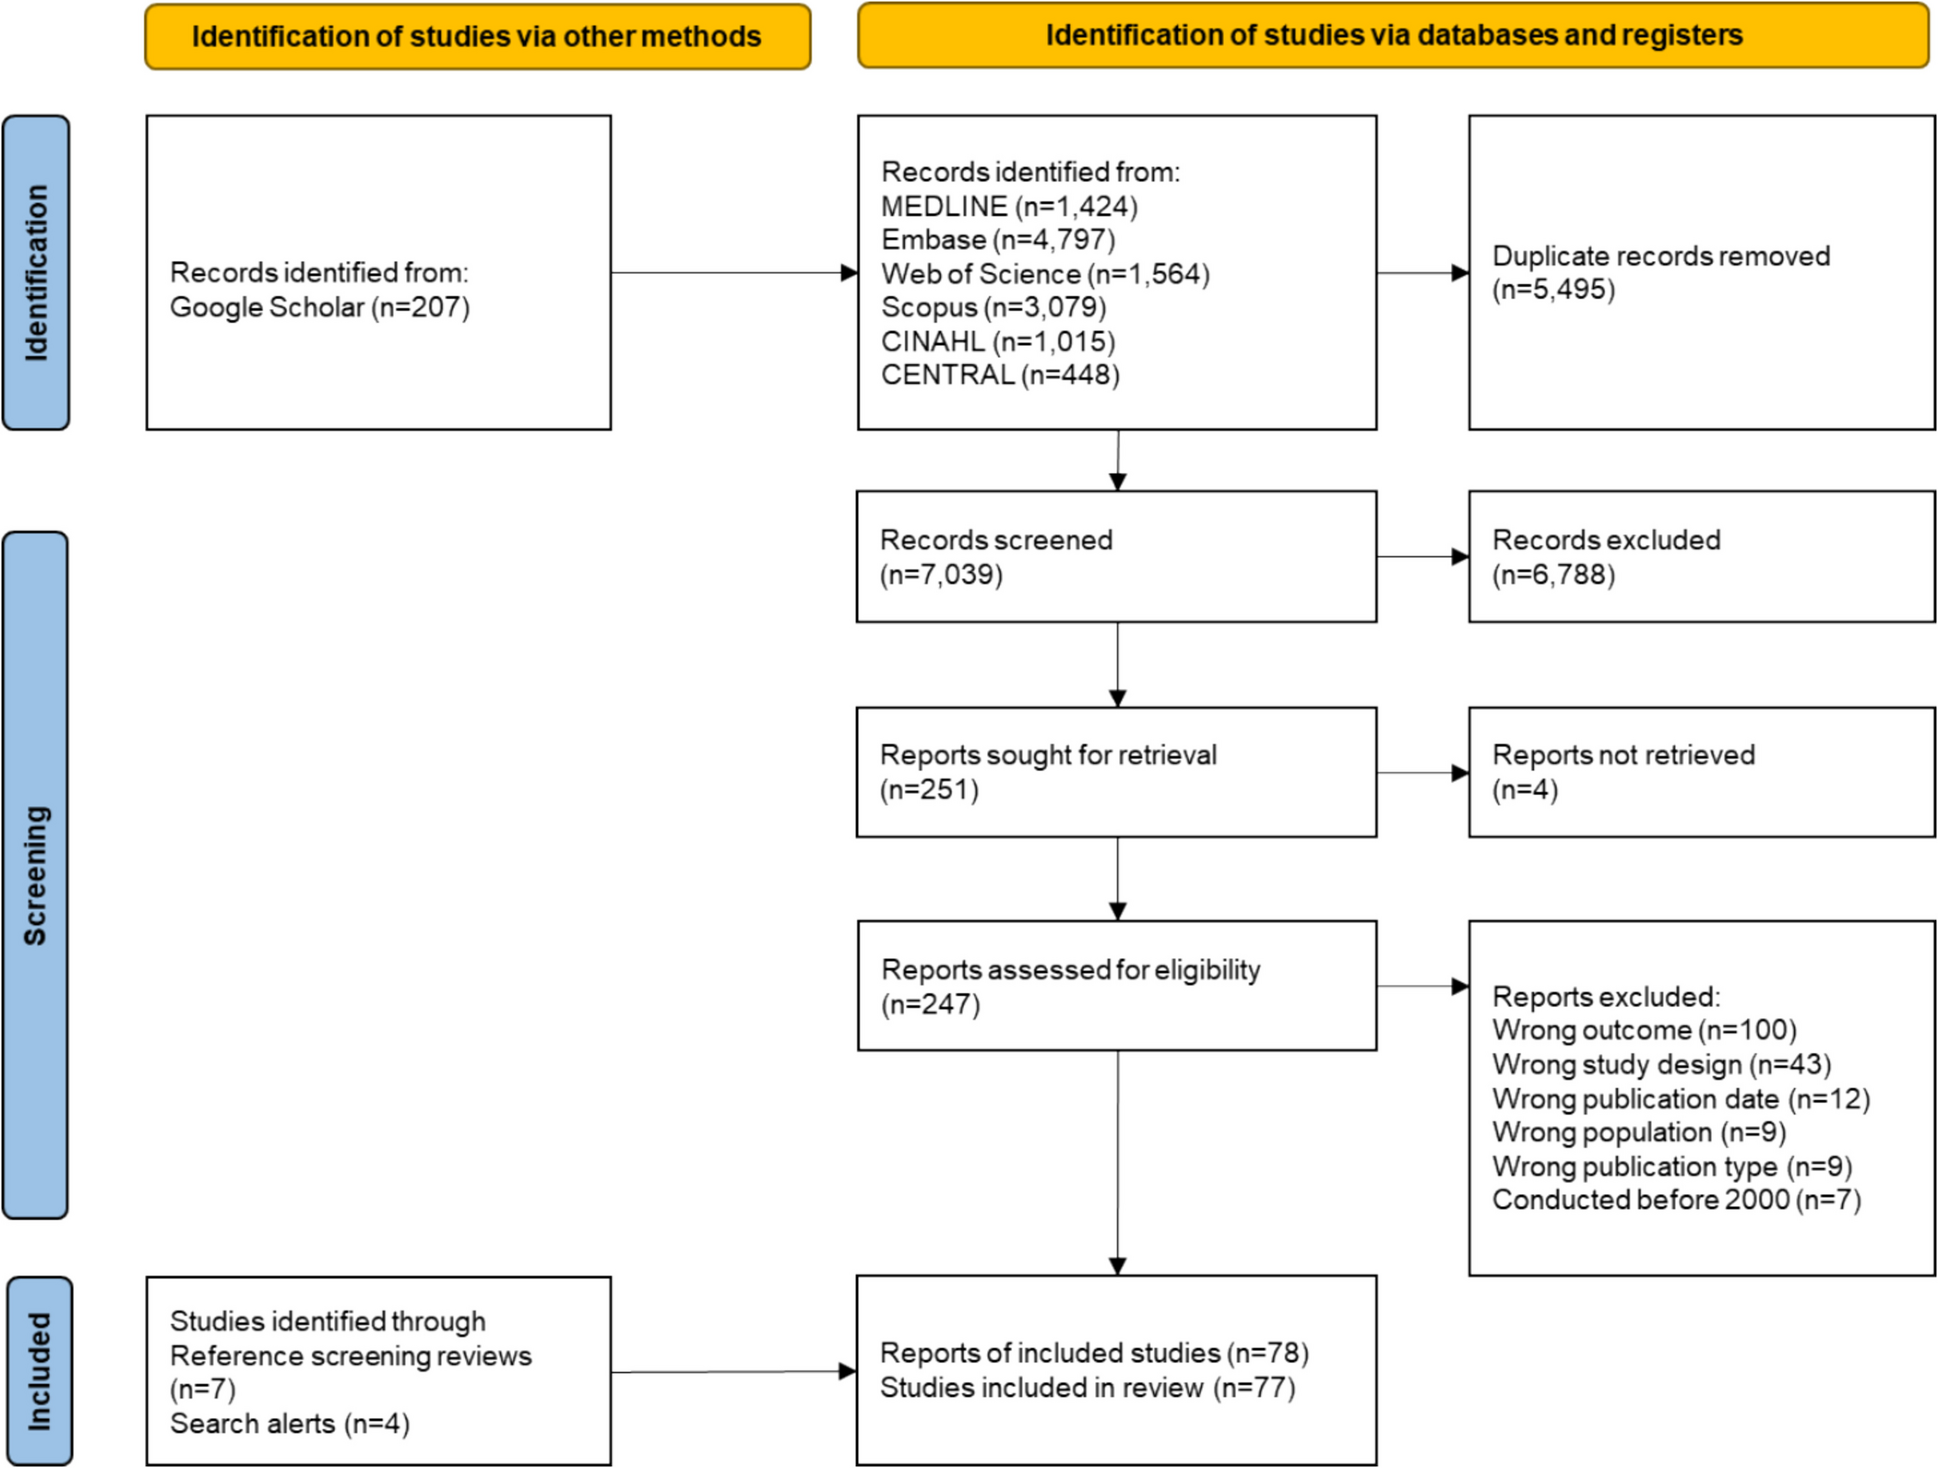
A total of 5710 respondents fully completed the questionnaire (Fig. 1, Table 1). More than half were women (59%), and highly educated (53%). Two thirds were currently ≥ 60 years (67%) and the most common diagnoses were breast cancer (30%), haematological cancer (25%) and prostate cancer (17%). Sixty-one percent were < 60 when they heard they had cancer, and for 40% it was between 5–10 years ago. At the time of completing the questionnaire, 26% of respondents were undergoing cancer treatment, and nearly two-thirds (64%) reported being cured or expecting to be cured. Forty-four percent were treated at a top clinical cancer hospital.
Fig. 1 Table 1 Sociodemographic and clinical characteristics of participants
At the time of diagnosis, a significantly higher percentage of women (77%, n = 2586) were under 60 years of age compared to men (37%, n = 870). In addition, they were significantly more likely to say they were probably (to be) cured (75%, n = 2462) than men (55%, n = 1192). Among those diagnosed before the age of 60, 36% (n = 1242) had been diagnosed > 10 years ago, compared to 15% (n = 329) of respondents aged ≥ 60. Additionally, respondents diagnosed before the age of 60 were significantly more likely to report they were probably (to be) cured (73%, n = 2460) compared to those diagnosed at ≥ 60 years (58%, n = 1204).
Physical and psychological symptoms due to cancer (treatment)In the past 3 months, 55% (n = 3122) of respondents experienced both physical and psychological symptoms due to cancer and its treatment, 33% (n = 1859) only reported physical symptoms, 2% (n = 101) only psychological, and 11% (n = 628) reported no symptoms. The number of symptoms among respondents varied widely. On average, respondents reported 5.9 symptoms (SD = 3.8; range = 0–22). Of these, 55% (n = 2735) reported 1–5 symptoms, 33% (n = 1612) had 6–10 symptoms, 10% (n = 498) had 11–15 symptoms, and 2% (n = 104) had 16–22 symptoms.
Women (64%, n = 2150) were significantly more likely than men (41%, n = 967) to report both physical and psychological symptoms. Respondents diagnosed under 60 years of age (62%, n = 2161) were significantly more likely to report these symptoms compared to older individuals (43%, n = 961). Those currently in treatment (65%, n = 970) were also significantly more likely to report both types of symptoms than those not in treatment (51%, n = 2152).
Respondents diagnosed 2–5 years ago (59%, n = 1094) and 5–10 years ago (57%, n = 1298) reported physical and psychological symptoms significantly more often than those diagnosed > 10 years ago (47%, n = 730). Among the latter group, 15% (n = 234) reported no symptoms, compared to 10% for both the 5–10 years group (n = 218) and the 2–5 years group (n = 176). While not statistically significant and relevant, these differences are noteworthy.
Physical and psychological symptoms due to cancer (treatment) in detailIn the past 3 months, the most common physical symptoms due to cancer and its treatment were fatigue (56%), reduced physical fitness (47%), neuropathy (32%), sexual problems/impotence (25%), and sleep problems (24%). Thirteen percent experienced no physical symptoms. The most common psychological symptoms were memory or concentration problems (32%), issues accepting cancer (19%), depressive feelings (19%), planning difficulties (18%), and anxiety (16%). Forty-four percent experienced no psychological symptoms.
Women were significantly more likely than men to report: fatigue (64%, n = 2130 vs. 46%, n = 1069), lymphoedema (22%, n = 729 vs. 7%, n = 174), pain (26%, n = 880 vs. 11%, n = 265), neuropathy (38%, n = 1262 vs. 24%, n = 567), sleep problems (30%, n = 1002 vs. 16%, n = 384), menopausal or hormonal symptoms (25%, n = 827 vs. 7%, n = 155), osteoporosis (16%, n = 519 vs. 6%, n = 130), anxiety (21%, n = 712 vs. 8%, n = 196), problems with changed appearance (17%, n = 574 vs. 4%, n = 85), memory or concentration problems (40%, n = 1346 vs. 20%, n = 474), and planning difficulties (23%, n = 773 vs. 11%, n = 263). Men significantly more often suffer from sexual problems (37%, n = 876 vs. 17%, n = 556).
Respondents < 60 years old at diagnosis were significantly more likely to report symptoms due to cancer and its treatment than those aged ≥ 60: fatigue (63%, n = 2181 vs. 46%, n = 1026), lymphoedema (20%, n = 692 vs. 10%, n = 213), pain (26%, n = 881 vs. 12%, n = 266), menopausal or hormonal symptoms (24%, n = 840 vs. 6%, n = 142), problems with changed appearance (16%, n = 539 vs. 5%, n = 120), memory or concentration problems (40%, n = 1390 vs. 19%, n = 434), and planning difficulties (24%, n = 825 vs. 10%, n = 212).
Fatigue (60%, n = 1101), memory or concentration problems (35%, n = 636), problems accepting (the consequences of) cancer (25%, n = 468) and menopausal or hormonal symptoms (22%, n = 406) are significantly more often reported by respondents who are between 2–5 years after diagnosis than respondents who are > 10 years after diagnosis (49%, n = 770; 25%, n = 389; 14%, n = 213; 11%, n = 170) respectively (Table 2). Additionally, those > 10 years after diagnosis are significantly more likely to report no psychological symptoms (53%, n = 822 vs. 39%, n = 726).
Table 2 Physical and psychological symptoms that patients suffer from due to (the treatment of) cancerFatigue (66%, n = 1180) and reduced physical fitness (57%, n = 1019) were significantly more common in respondents who will (probably) not get better compared to those who will or are (probably) getting better (52%, n = 1890; 42%, n = 1520; Table 2). Respondents currently in treatment reported significantly more fatigue (70%, n = 1037), reduced physical fitness (60%, n = 893), memory problems (40%, n = 594), sleep problems (32%, n = 479), problems with movement (25%, n = 367), and menopausal or hormonal symptoms (28%, n = 411) than those not undergoing treatment at the time of survey completion (52%, n = 2170; 42%, n = 1770; 29%, n = 1230; 22%, n = 910; 15%, n = 643; 14%, n = 571) (Table 2). Those not receiving treatment were significantly more likely to report no physical and/or psychological symptoms (14%, 574) versus those receiving treatment (4%, n = 54).
For all cancer types, fatigue and reduced physical fitness are among the top 5 most common symptoms (Table 3, top 5 is in bold). Neuropathy is also frequently in the top 5, while other symptoms vary by cancer type.
Table 3 Physical and psychological symptoms that patients suffer from due to (the treatment of) cancerThe influence of cancer on lifeNearly three-quarters (73%, n = 4174) of respondents felt proud about how they coped with cancer. Two-thirds (66%, n = 3786) reported that cancer made other aspects of life important. However, more than half (58%, n = 3339) said they could never be worry-free again, and nearly half (49%, n = 2791) found it difficult to resume their life after their diagnosis. Almost half (44%; n = 2492) see other possibilities in life because of cancer and a third (35%, n = 1981) enjoys life more than before they had cancer. Over a quarter (28%, n = 1618) struggle with how they want to live their lives because of cancer. Finally, 19% (n = 1090) are no longer preoccupied with cancer.
Respondent; “The moment you are better, everything falls away at once, the visits to the hospital, etc. There are check-ups, but then you suddenly must start living again and trust that ‘everything’ is okay again.”
The influence of cancer on life in detailWomen and those younger than 60 at diagnosis more often felt proud about how they coped with cancer, they more often see other possibilities in life because of cancer, they stated more often that cancer made other aspects of life more important, and they enjoy life more than before they had cancer (Table 4). However, women and those younger than 60 at diagnosis also more often stated that they could never be worry-free again, that they struggled to resume life after their diagnosis, that they struggle with how they want to live their lives because of cancer. The influence of cancer on life did not differ significantly with respect to education level.
Respondent; “I have become easier, more loving. Also worry less”.
Table 4 How did cancer (treatment) impact your life?Respondents diagnosed with cancer > 10 years ago were significantly more likely (26%, n = 411, p < 0.001) to say they were no longer preoccupied with it, compared to those diagnosed 5–10 years (18%, n = 412) and 2–5 years ago (15%, n = 267). Those diagnosed 2–5 years ago were significantly more likely (36%, n = 651) to struggle with how to live their lives, compared to those diagnosed 5–10 years (29%, n = 653) and over 10 years ago (20%, n = 314, p < 0.001).
Respondents who are (probably) (getting) better are significantly more likely (24%, n = 859) to no longer be preoccupied with cancer compared to those (probably) not (getting) better (11%, n = 195, p < 0.001). They are also significantly more often proud of how they have coped with the disease (78%, n = 2836 vs. 67%, n = 1178, p < 0.001) and more likely to say they enjoy life more (39%, n = 1415) than the group of respondents who are (probably) not (getting) better (28%, n = 505, p < 0.001).
Respondent; “I enjoy the fun things and especially my grandchildren”.
Respondents not currently in treatment were significantly more likely (23%, n = 967) to say they were no longer preoccupied with cancer, than those currently in treatment (8%, n = 123, p < 0.001). Moreover, respondents in treatment were significantly more likely (38%, n = 558) to say they struggle with how they want to live their lives than those not in treatment (26%, n = 1060, p < 001).
Comments (0)