
Remember me


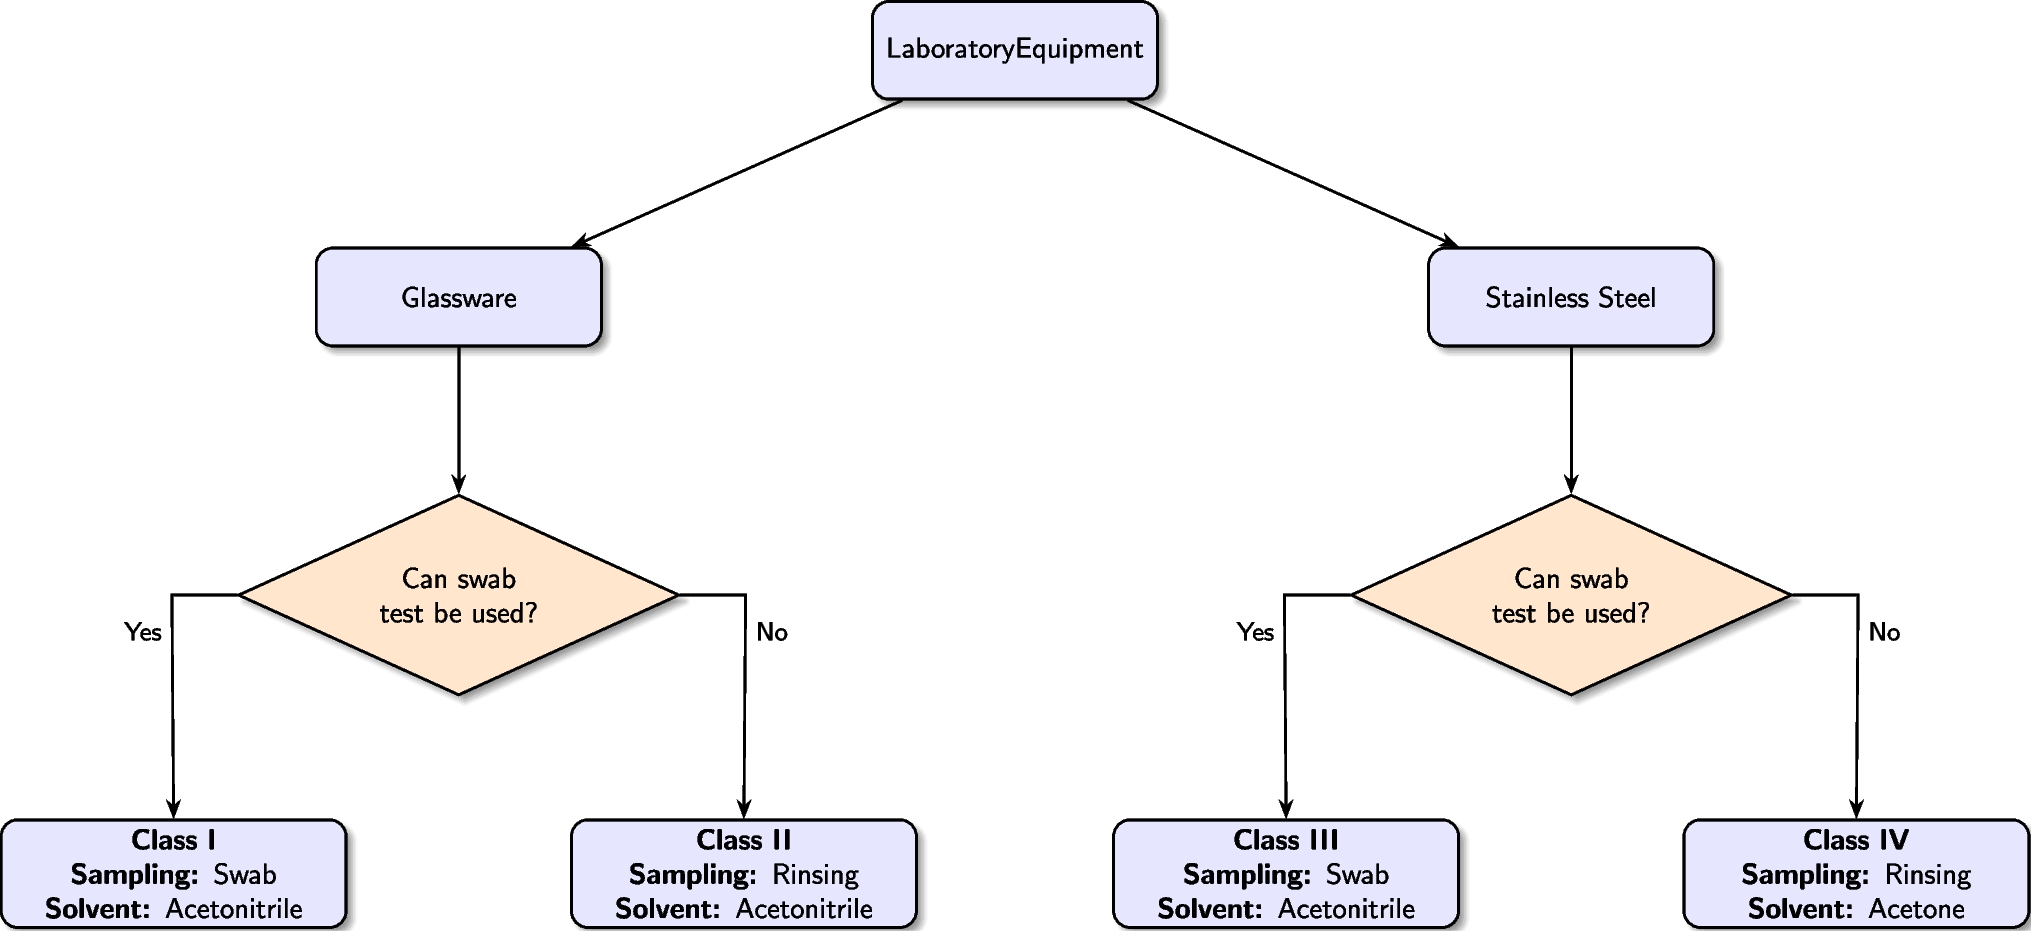
To broaden the study’s applicability, both glassware and stainless-steel laboratory equipment were considered. The current cleaning process distinguishes between manually and automatically cleaned items. Manually cleaned items are washed by hand using a phosphate-free alkaline detergent (TFD4 PF, Franklab), while automated cleaning uses an industrial washer with a standard program and TFD7 PF detergent (Franklab). After washing, all materials are dried in an oven at 60 \(^\)C. The complete procedure is illustrated in Fig. 1 and applies to both equipment types.
Fig. 1
Current laboratory cleaning protocol for glassware and stainless-steel equipment
API selectionA worst-case scenario approach was adopted to select the API, consistent with established practices [17,18,19]. Selection criteria, defined in collaboration with the partner pharmaceutical company, include: (i) API concentration; (ii) solubility in water; (iii) solubility in acids and/or bases; (iv) toxicity; (v) cleaning difficulty; and (vi) cleaning method (manual or automatic) [20]. Low water solubility is directly associated with greater cleaning difficulty. Based on these criteria, Oxcarbazepine—an anticonvulsant with a history of cleaning challenges—was identified as the worst-case API. Its prior association with persistent contamination at the partnering company reinforces this choice.
The rationale is that a cleaning protocol effective against the most difficult-to-remove API is likely to be effective across a broader range of compounds. Given the use of shared lab equipment for multiple products, product-specific protocols are impractical. Thus, Oxcarbazepine serves as a conservative benchmark, a practice commonly endorsed in similar studies [21]. While other APIs may be evaluated in future work, establishing efficacy against the worst-case ensures robustness across all scenarios.
Oxcarbazepine (Oxc), with the chemical formula \(\text _\text _\text _\text _\), is structurally illustrated in Fig. 2(a). It has a molecular weight of 252.27 g \(\cdot\) mol\(^\) and is a derivative of Carbamazepine, whose molecular structure is shown in Fig. 2(b). Oxc displays distinctive solubility properties. It is sparingly soluble in water, with a solubility of only 0.07 mg/mL at room temperature [22], classifying it as practically insoluble according to the scale proposed by Wolk et al. [23]. In contrast, it dissolves readily in certain organic solvents. For instance, at 35 \(^\)C, its solubility in acetonitrile reaches 5.9 mg/mL, and in acetone, slightly higher at 6.5 mg/mL. When the temperature decreases to 15\(^\)C, these values drop to 3.1 mg/mL and 3.6 mg/mL, respectively.
Fig. 2
Chemical structures of: (a) Oxcarbazepine; (b) Carbamazepine
The concept of Residue Acceptable Limits (RALs) was introduced in the early 1990s [24]. In 1993, Fourman and Mullen [25] proposed specific contamination thresholds, including the widely referenced limit of no more than 10 ppm of a substance in another product. As cleaning validation protocols are primarily designed to prevent cross-contamination, evaluating residue levels involves determining the percent recovery from contact surfaces. Analytical methods must, therefore, offer sufficient sensitivity to detect residues at or below the defined RALs [26].
Although no official RAL exists for Oxcarbazepine in laboratory settings, it is essential to establish a practical and scientifically justified limit. Based on prior internal studies, the partnering pharmaceutical company has set the maximum allowable post-cleaning concentration for Oxc at 0.01 mg/mL (10 ppm). This value not only aligns with the guideline proposed by Fourman and Mullen [25] but also serves as a benchmark for validating the cleaning protocol’s effectiveness. Establishing this threshold ensures that equipment is adequately decontaminated and compliant with industry standards for residual control.
Solvents for dissolving the APIThe favorable solubility characteristics of the Oxc molecule in acetonitrile and acetone make these compounds as good candidates for incorporation into cleaning protocols.
Practically, acetonitrile and acetone were selected as analytical diluents for detecting residues of Oxc in equipment post-cleaning due to their high solubility for Oxc. Their use is well-established in cleaning validation protocols for production equipment. The selection of these solvents is intuitive for several reasons: (i) they are already established and routinely used in common laboratory activities; (ii) their inclusion does not necessitate additional contractual arrangements; (iii) they exhibit low toxicity compared to other organic solvents; and (iv) their cost falls within the budgetary constraints. Moreover, while there are other organic solvents with higher solubility for Oxc, they often fall short in meeting one or more of the aforementioned criteria.
Acetonitrile, chemically represented as CH\(_\)CN, has a molecular mass of 41.05 g \(\cdot\) mol\(^\). At 25 \(^\)C, its density is 0.781 g \(\cdot\) cm\(^\), and the vapor pressure at 20 \(^\circ\)C is 9.71 kPa. On the other hand, acetone, with the chemical formula C\(_\)H\(_\)O, has a molecular mass of 58.08 g \(\cdot\) mol\(^\), a density of 0.791 g \(\cdot\) cm\(^\) at 25 \(^\)C, and a vapor pressure of 30.6 kPa at the same temperature. Acetonitrile and acetone used in this study were pro-analysis reagents. The acetonitrile was sourced from PanReac Reagents, with a purity larger than \(\,)}\), and the acetone from Chem-Lab, with a purity larger than \(\,)}\). The solvents were directly sampled from their respective flasks and used in the procedure.
These two compounds share similar physical properties, with acetone exhibiting slightly higher volatility. Moreover, acetone also demonstrates a slightly greater capacity for solubilizing Oxc compared to acetonitrile [22]. To summarize, acetonitrile and acetone are used as cleaning or rinsing agents to recover residual API from the equipment. The cleaning process, as described in Section “Application of the cleaning validation protocol”, incorporates a (different) detergent commonly used in current cleaning protocols.
Sampling methodsThe sampling of cleaned surfaces typically employs two primary techniques: swabbing and rinsing, as described by Food and Drug Administration et al. [4]. Swabbing is a direct surface sampling method, while rinsing is considered an indirect approach. The choice between these methods largely depends on the accessibility and geometry of the surface being evaluated. Swabbing is particularly effective for flat or irregular surfaces such as large panels and corners, whereas rinsing is more suitable for equipment with internal geometries such as pipes and tubes. In many laboratory-scale cleaning validations, a combination of both methods is often necessary to ensure comprehensive residue assessment.
Swab methodIn this study, a polyester swab was selected for surface sampling due to its strength and consistency, following the guidance of Miscioscio [27]. This technique has been widely adopted and is detailed in several sources, including LeBlanc [8] and Bismuth and Neumann [12].
The swab is initially pre-wetted with an appropriate solvent, which plays a critical role in solubilizing surface-bound contaminants to enhance their transfer onto the swab. After pre-wetting, any excess solvent is removed, and the swab is systematically passed over a 100 cm\(^2\) area using both horizontal and vertical strokes. To maximize collection efficiency, both sides of the swab are utilized, as suggested by Ovais et al. [28]. Following sampling, the swab is placed in a test tube containing solvent for a 10 min extraction period. The extract is then subjected to analytical procedures for residue quantification. Typical laboratory items assessed using the swab method include Petri dishes, spatulas, and mortars.
Rinse methodThe rinse method involves washing contaminated equipment with a defined volume of solvent to ensure thorough contact with all surface areas. This procedure is performed at ambient temperature to support reproducibility. For consistency, each rinsing cycle is standardized to 10 s, and a total of 10 mL of solvent is used per equipment item.
The process begins by dispensing 5 mL of solvent onto the equipment surface, followed by agitation for 10 s. The resulting solution is collected as the primary rinse. This step is repeated with an additional 5 mL of solvent and agitation for the same duration. The solutions from both rinses are combined into a composite sample for analysis. This method is commonly used for equipment such as graduated cylinders, pycnometers, test tubes, and vials.
Swab absorption capacityTo determine the volume of solvent absorbed by a swab, a controlled test was performed. Initially, dry swabs were weighed to record their baseline mass, denoted as \(W_d\). Each swab was then immersed in the solvent for approximately 3 s—sufficient time for full saturation—and weighed again to obtain the wet mass, \(W_w\). The volume of solvent absorbed by the swab, \(V\), was calculated using Eq. 1:
$$\begin V = \frac, \end$$
(1)
where \(\rho _s\) is the solvent density (in g \(\cdot\) mL\(^\)), measured at room temperature using the pycnometer method. This assessment was carried out using a set of 10 swabs for each solvent to ensure statistical robustness.
Recovery study designRecovery studies are a fundamental component of cleaning validation, as they demonstrate the ability to consistently recover residues from equipment surfaces [4]. The primary objective is to evaluate both the repeatability and efficiency of the sampling method—be it swabbing or rinsing—by quantifying the amount of analyte that can be reliably recovered from a known contaminated surface. These studies also help determine the optimal number of sampling steps needed to reach a satisfactory recovery rate.
Various regulatory guidelines provide differing thresholds for acceptable recovery. The Parenteral Drug Association (PDA) considers a recovery rate of 70 % to be excellent and 50 % to be acceptable [29]. According to the World Health Organization (WHO), values above 80 % are good, those between 50 % and 80 % are reasonable, and values below 50 % are questionable [30]. The Active Pharmaceutical Ingredients Committee (APIC) recommends a threshold of 90 % for exceptional recoveries and 50 % as the minimum acceptable level; values below this should be disregarded [31]. Forsyth [32] further suggests that operators aim for a recovery rate of at least 70 %, with a relative standard deviation not exceeding 15 %. Based on these recommendations, this study adopts a threshold of 70 % to indicate effective recovery.
Swab recovery testThe swab recovery test begins with the selection of an equipment surface—such as the bottom of a glass vessel or a stainless-steel plate—covering an area of approximately 100 cm\(^2\). This surface is intentionally contaminated with a known volume of an Oxc solution of known concentration. After application, the solvent is allowed to evaporate completely in an oven. Once dried, the equipment is removed and cooled to ambient temperature.
A swab pre-moistened with the extraction solvent is then passed across the surface using a predefined pattern of horizontal and vertical strokes. The swab is subsequently placed into a vial containing solvent to dissolve the analyte. To maximize the recovery efficiency, a second swab is used on the same surface and processed under identical conditions. This secondary step aims to capture any remaining residues that were not collected in the first pass. Each vial is analyzed in duplicate to assess consistency.
Rinse recovery testFor the rinse recovery test, the contaminated glass or stainless-steel equipment is cleaned by sequential rinsing with two portions of the extraction solvent. Each rinsing step involves agitation for a fixed duration, and the collected liquids are pooled and transferred into test tubes for analysis.
Quantification and calculation of recovery rateThe amount of Active Pharmaceutical Ingredient (API) recovered via swabbing or rinsing is quantified using High Performance Liquid Chromatography (HPLC), as described later in Section “Chemical Analysis Techniques”. The recovery rate, \(r_r\), expressed as a percentage, is calculated using Eq. 2:
$$\begin r_r = \frac}}}} \times 100~() \end$$
(2)
where \(m_}\) is the mass of Oxc recovered from the equipment surface (as determined by HPLC), and \(m_}\) is the mass originally applied during contamination.
Study scope and objectiveTwo different solvents were evaluated in this study to determine the most effective combination of solvent, recovery method, and equipment material. Although the final protocol is based on a single method-solvent pairing, the preliminary comparative assessment ensures that the choice is both data-driven and reproducible. The broader aim is to establish a validated procedure that can be easily adapted to other APIs and types of equipment with minimal modification.
In this context, validation of the cleaned equipment encompasses both the cleaning procedures and the sampling-recovery protocols. Therefore, in the remaining sections, this process is referred to as cleaning protocol validation.
Contaminant solutionThe contaminant solution was prepared to match the maximum allowable concentration of Oxc on equipment surfaces, specifically 0.175 mg \(\cdot\) mL\(^\). The solvent used was the same mobile phase as employed in the HPLC analysis. Optimization of analytical component ranges was outside the scope of this study, as these parameters were established and validated in previous internal research. Our primary focus was the cleaning validation methodology, applying industry-standard practices that, while varying across companies, uniformly comply with international regulatory requirements. For brevity, chromatograms have been omitted from this report.
Solution stability regarding the API was ensured by: (i) performing analyses within the shortest feasible timeframe; (ii) inspecting solutions for any visible chemical degradation or phase separation prior to analysis; and (iii) storing solutions under appropriate conditions to prevent chemical or physical changes when immediate analysis was not possible. All solutions were stored at room temperature.
Cleaning method in practice and validation strategyThis study validates the cleaning protocol depicted in Fig. 1, using Oxc as a worst-case contaminant. Validation was performed on both glassware and stainless-steel equipment. Two recovery methods—swabbing and rinsing—were evaluated to identify the most effective approach for contaminant removal. Recovery studies involved deliberate contamination of surfaces with Oxc solution, application of the cleaning protocol from Fig. 1, followed by assessment of recovery efficiency.
Two solvents, acetonitrile and acetone, were tested for their efficacy in dissolving and recovering the contaminant. Although only one solvent will be selected for routine use per equipment type, both were evaluated to ensure optimal choice. Similarly, one recovery method will ultimately be implemented for each equipment type after comparative assessment to confirm the most effective option.
Testing the validation protocol in a realistic scenarioThe cleaning validation methods described previously were applied to routine washing of laboratory equipment from both glassware and stainless steel categories, including items suited for swab and rinse methods.
Tests were conducted in duplicate (Replicate 1 and Replicate 2) alongside blanks (uncontaminated controls) to exclude accidental contamination. Each item was contaminated with 0.5 mL of the contaminant solution, dried at 60 \(^\)C, cooled, then cleaned manually or automatically according to type. After a second drying cycle, sampling was performed using the recovery method and solvent chosen from prior recovery studies. Swabs were extracted in solvent vials and analyzed by HPLC.
To assess cleaning agent residues, rinses from two specimens per equipment type were analyzed by conductivity and Total Organic Carbon (TOC). For conductivity, rinsing used 5 mL purified water, and for TOC, 75 mL purified water was collected in nitric acid–washed flasks. The European Pharmacopoeia limits purified water conductivity to 4.3 µS \(\cdot\) cm\(^\) at 20 \(^\)C and TOC to 500 ppm [33]. This study adopted a stricter cleaning agent residue limit of 10 ppm, per company standards.
Chemical analysis techniquesThis section summarizes the equipment and conditions used for the analysis of Oxc and cleaning agent residues.
Swab solvent volume was quantified gravimetrically using a Mettler-Toledo ML204T/00 analytical balance.
HPLC analyses were performed on a Waters Alliance e2695 system. The mobile phase consisted of 60 % eluent A (containing 0.14 % orthophosphoric acid and 0.10 % trimethylamine) and 40 % eluent B (acetonitrile), all volume/volume. Operating conditions were: (i) Lichrospher 100 RP-8 column (250 mm \(\times\) 4 mm \(\times\) 5 µm), Merck; (ii) column and autosampler temperature at 25 \(^\)C; (iii) detection wavelength: 215 nm; (iv) flow rate: 1.3 mL \(\cdot\) min\(^\); (v) injection volume: 20 µL; (vi) run time: 8 min; (vii) Oxc retention time: 3.5 min. The system was calibrated with standard solutions to correlate peak area at 215 nm to Oxc concentration. The validated method features a Limit of Quantification (LQ) of 0.005 µg \(\cdot\) mL\(^\), Limit of Detection (LD) of 0.002 µg \(\cdot\) mL\(^\), excellent linearity (\(R^2=0.99997\)), precision (RSD = 0.93 %), repeatability (RSD = 1.24 %), and a working range of 0.005 µg \(\cdot\) mL\(^\) 29.16 µg \(\cdot\) mL\(^\).
Conductivity was measured using a Miron L® Ultrameter II 4P, and Total Organic Carbon (TOC) was analyzed with an Analytik Jena multi N/C 3100.
Statistical analysisDescriptive statistics including minimum, maximum, mean (\(\bar\)), standard deviation (SD), and coefficient of variation (\(C_v\), %) were computed. \(C_v\) quantifies repeatability and is defined as:
$$\begin C_v = \frac}} \times 100~(). \end$$
(3)
A two-sample \(t\)-test was applied to assess whether differences in mean recovery rates—due to sampling method or solvent—are statistically significant at the 95 % confidence level [34, 35]. Specifically:
\(p < 0.05\): significant difference, favoring the alternative hypothesis;
\(p> 0.95\): supports the null hypothesis (no difference);
\(0.05 \leqslant p \leqslant 0.95\): inconclusive.
This approach provides clear insights into the comparative effectiveness of tested treatments.
Comments (0)