
Remember me
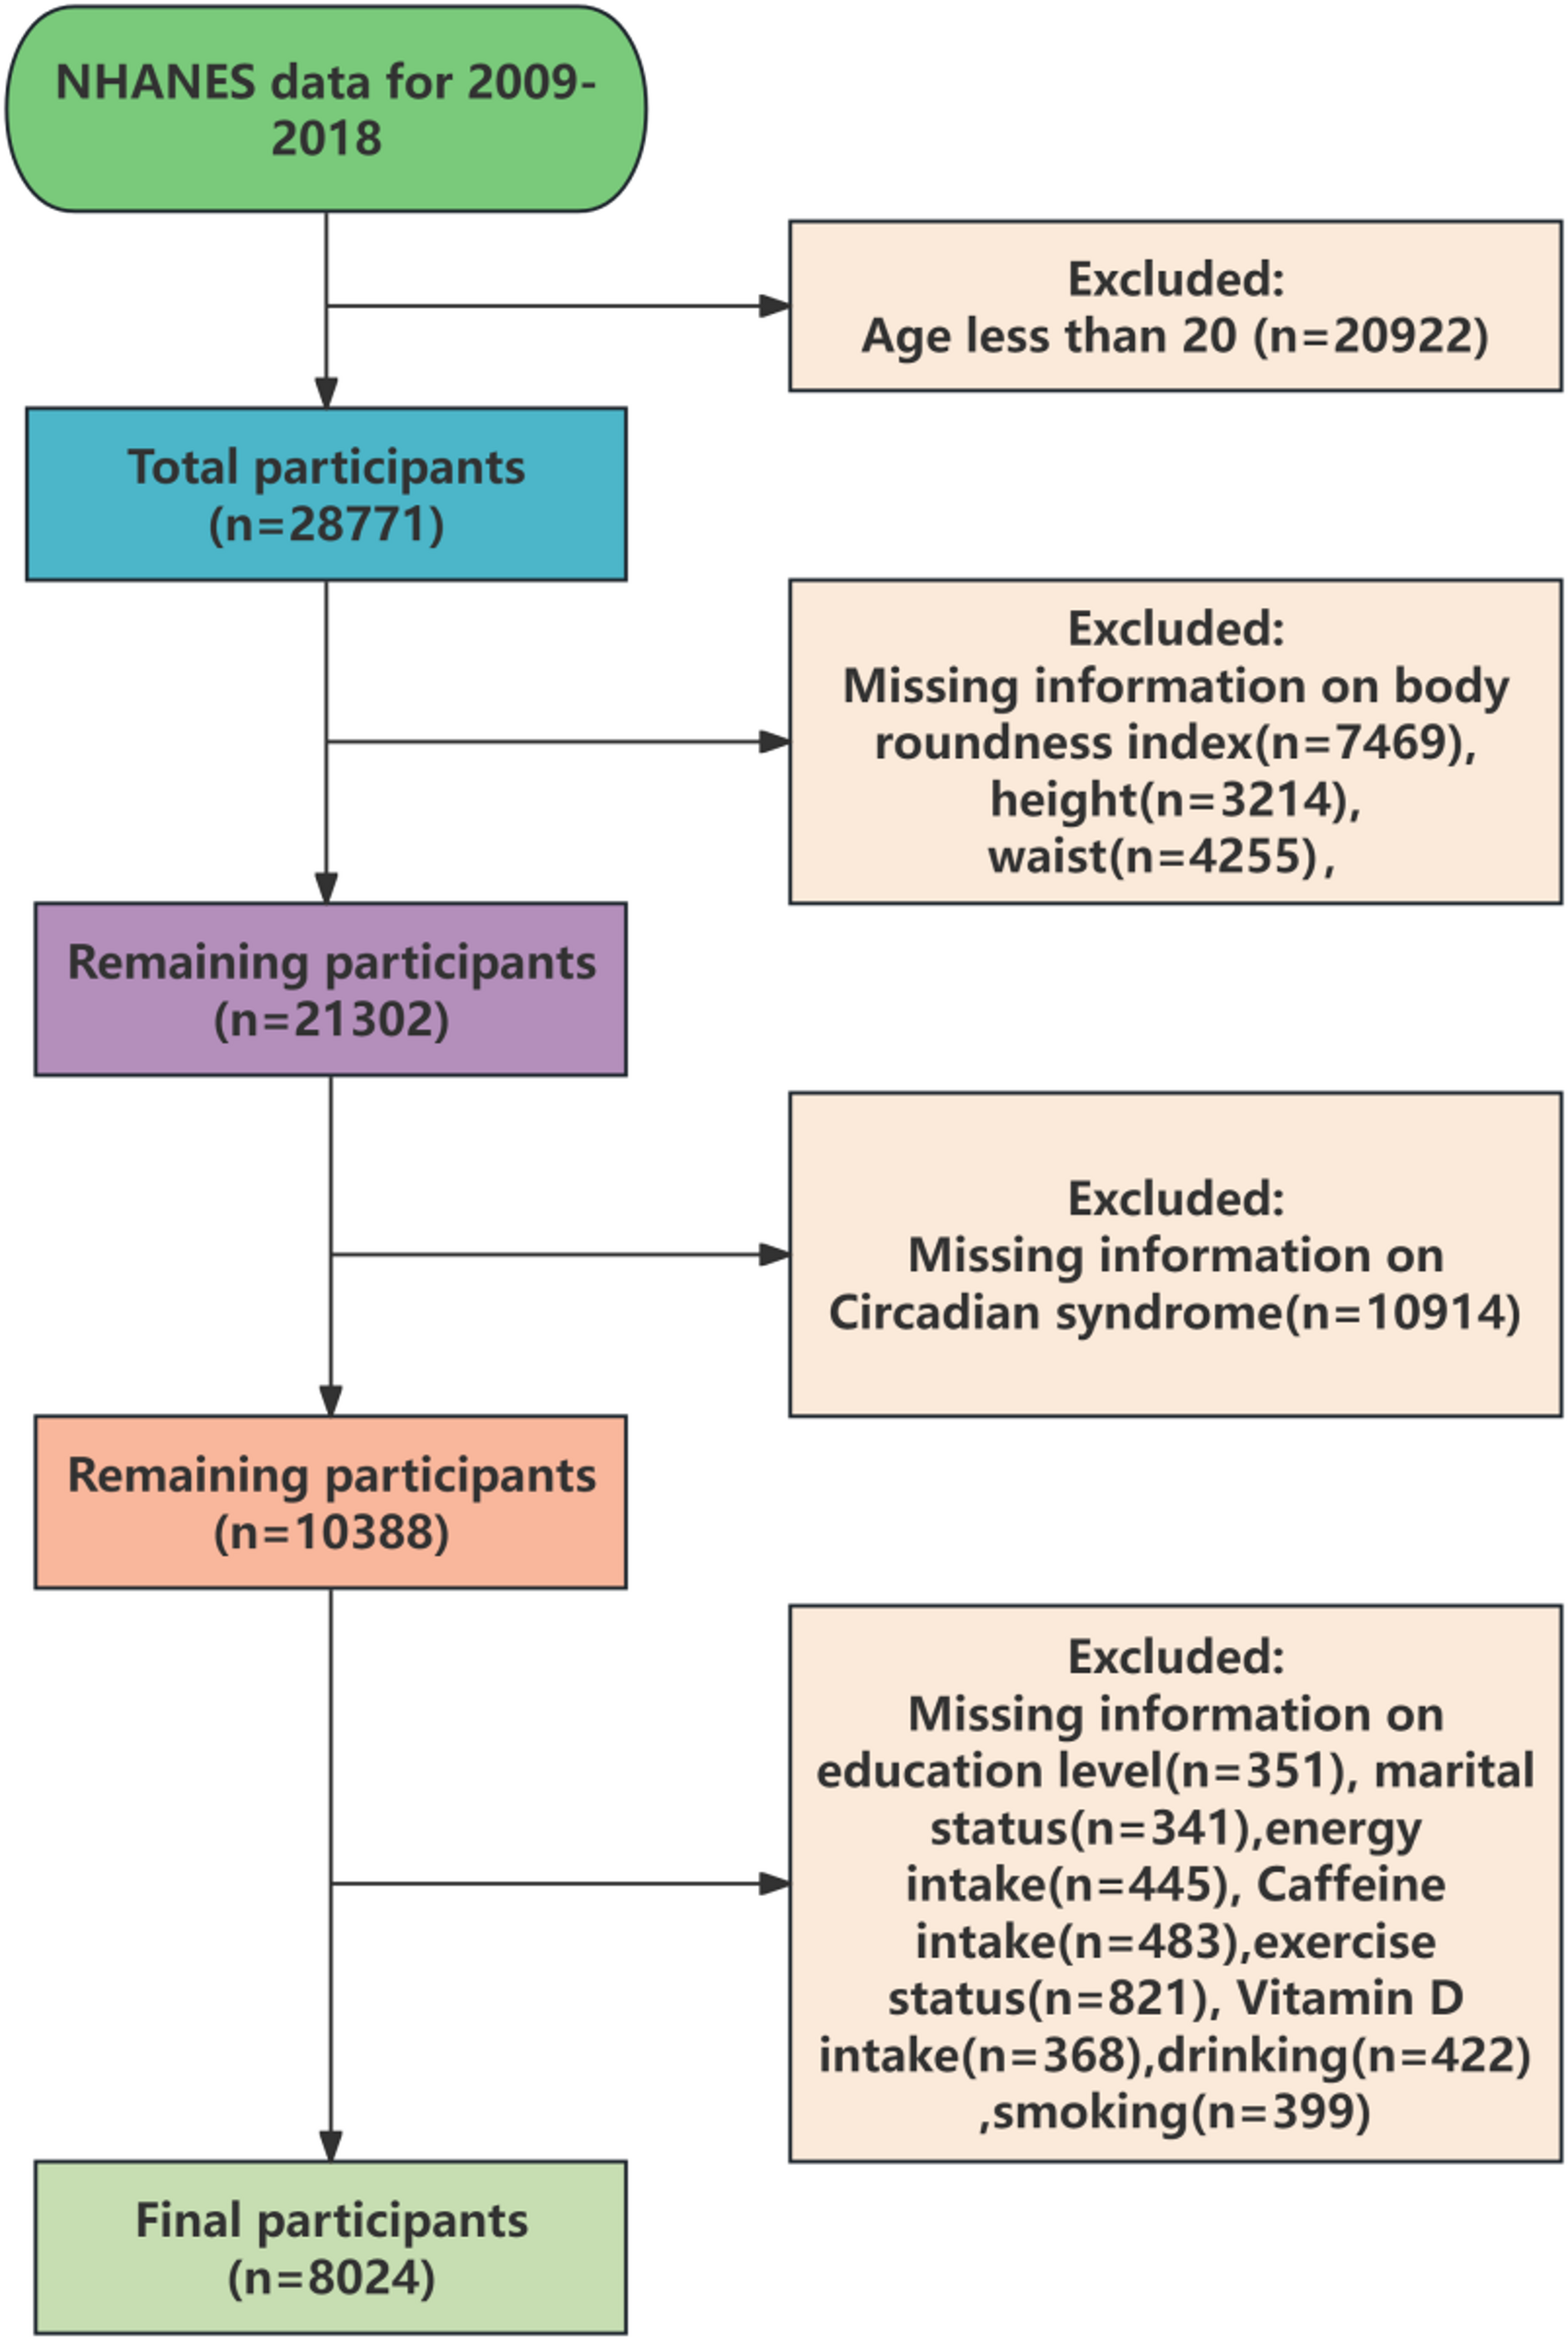


Using NHANES 2011–2016 data, 5,285 participants were included after applying exclusion criteria, consisting of 459 patients with hypertension (HTN) combined with diabetes mellitus (DM) and 4,826 control participants. The baseline characteristics of the study population are presented in Table 1. Significant differences between the diseased and control groups were observed in terms of AIP, race, age, marital status, education, poverty–income ratio (PIR), alcohol consumption, work, diet, BMI, metabolic syndrome, kidney insufficiency (KI), blood urea nitrogen (BUN), globulin levels, Globulin, waist, triglyceride, high density lipoprotein cholesterol (HDL-C), low density lipoprotein cholesterol (LDL-C), glycohemoglobin, total_cholesterol, glucose, medicine_insulin, and systolic(P < 0.05). Notably, patients with HTN combined with DM had a higher mean AIP (0.39). Additionally, individuals who were Non-Hispanic White, aged over 45 years, married, alcohol consumers, unemployed, obese, those with metabolic syndrome and without medicine insulin were more likely to have HTN combined with DM. Patients with HTN and DM also had elevated BUN, globulin levels, waist, triglyceride, glycohemoglobin, glucose, systolic, while showing lower HDL-C, LDL-C, and total_cholesterol. In addition, the prevalence of concurrent HTN and DM was significantly higher in the 47-year-old cohort relative to the 62-year-old cohort (p < 0.001).
Table 1 Baseline characteristics of the study populationAIP was significantly associated with HTN combined with DMThree sequential multivariate generalized linear models (GLMs) were constructed to explore the correlation between AIP and HTN combined with DM. The results were as follows: Model 1: OR = 5.93, 95% CI = 3.84–9.16, P < 0.001; Model 2: OR = 6.78, 95% CI = 4.14–11.1, P < 0.001; Model 3: OR = 3.95, 95% CI = 1.66–9.39, P = 0.005 (Table 2). These results suggest that the association between AIP and HTN combined with DM was not significantly influenced by other covariates. In the stratified analysis analysis by covariates, a stable and positive association between AIP and the prevalence of HTN combined with DM was observed in the age ≥ 45 group (OR = 5.32, 95% CI = 2.86–9.89, P < 0.001), BUN (OR = 1.11, 95% CI = 1.03–1.19, P = 0.012), waist (OR = 1.02, 95% CI = 1-1.04, P = 0.039), glycohemoglobin (OR = 1.65, 95% CI = 1.2–2.27, P = 0.005), Diastolic (OR = 1.01, 95% CI = 1-1.02, P = 0.048) and medicine insulin (Yes) (OR = 7.33, 95% CI = 2.56 ∼ 20.96, P = 0.001) (Fig. 2).
Table 2 Relationship between AIP index and diabetes mellitus combined with hypertensionFig. 2
Stratified analysis of hypertension(HTN) combined with diabetes mellitus (DM) OR = 1 denotes null association, OR > 1 indicates elevated odds, OR < 1 suggests decreased odds (AIP: Atherogenic index of plasma; PIR: The ratio index of household income to poverty index; BMI: Body Mass Index; KI: kidney insufficiency)
Subsequently, nonlinear analysis was performed to examine the relationship between AIP and HTN combined with DM. These findings demonstrated a progressive increase in the odds of HTN combined with DM increased with rising AIP levels (Fig. 3A), further supporting the hypothesis that AIP is a odds factor for HTN combined with DM. Given that HTN is a major odds factor for KI, DM is a common cause of KI, and patients with both HTN and DM are prone to developing KI, the association between AIP and KI prevalence was examined using a fitted smoothed curve. The results indicated that the odds of developing KI increased as AIP levels rose (Fig. 3B). The RCS analysis demonstrated that individuals with comorbid diabetes and hypertension exhibited significantly higher odds susceptibility to AIP elevation, with elevated odds ratios at comparable AIP levels relative to non-affected individuals (Fig. 3C).
Fig. 3
Non-linear association of the AIP index and prevalence of HTN combined with DM and KI (A: DM combined with HTN, B: KI) C: Restricted Cubic Splines (RCS) analysis, X-axis (horizontal): Displays the AIP values, ranging from − 0.5 to 1.0, as the independent variable in the study; Y-axis (vertical): Labeled as “HR (95% CI)”, where HR denotes Hazard Ratio (quantifying the relative odds at different AIP levels), and 95% CI represents the 95% Confidence Interval (reflecting the precision of the estimate)
(AIP: Atherogenic index of plasma; KI: kidney insufficiency)
Three sequential multivariate GLMs were constructed to assess the relationship between AIP and the odds of DM. In Model 1, the OR was 4.85, with a 95% CI of 2.88–8.15 (P < 0.001). Model 2 yielded an OR of 5.24, with a 95% CI of 2.96–9.3 (P < 0.001). In Model 3, the OR was 2.02, with a 95% CI of 1.14–3.59 (P = 0.0197) (Supplementary Table 5). These results suggest that AIP’s effect on the odds of DM was not significantly altered by the covariates tested. stratified analysis analysis based on covariates revealed significant correlations with DM odds in several subgroups, including ethnicity (Non-Hispanic White: OR = 1.99, 95% CI = 1.39–2.86, P = 0.001; Non-Hispanic Black: OR = 3.68, 95% CI = 2.4–5.65, P < 0.001; Other ethnic groups: OR = 1.89, 95% CI = 1.16–3.08, P = 0.015), age (OR = 3.94, 95% CI = 2.95–5.27, P < 0.001), BMI > 25 (OR = 4.22, 95% CI = 1.52–11.76, P = 0.0092), metabolic syndrome (OR = 1.77, 95% CI = 1.27–2.47, P = 0.0023), KI (OR = 2.26, 95% CI = 1.74–2.92, P < 0.001), and others (Supplementary Fig. 1).
Similarly, three sequential GLMs were constructed to assess the relationship between AIP and the odds of HTN. Model 1 revealed an OR of 2.6, with a 95% CI of 1.82–3.7 (P < 0.001). Model 2 produced an OR of 2.95, with a 95% CI of 1.99–4.39 (P < 0.001), while Model 3 yielded an OR of 1.66, with a 95% CI of 1.06–2.6 (P = 0.029) (Supplementary Table 6). These results suggest that the impact of AIP on the odds of HTN was not significantly affected by the tested covariates. stratified analysis analysis revealed significant correlations with HTN odds in several subgroups, including ethnicity (Non-Hispanic Black: OR = 1.87, 95% CI = 1.03–3.39, P = 0.040), age (OR = 3.71, 95% CI = 2.13–6.44, P < 0.001), metabolic syndrome (OR = 7.22, 95% CI = 4.57–11.42, P < 0.001), KI (OR = 1.58, 95% CI = 1.03–2.43, P = 0.0396), BUN (OR = 1.19, 95% CI = 1.1–1.29, P < 0.001), selenium (OR = 1.01, 95% CI = 1–1.01, P = 0.009), phosphorus (OR = 1.57, 95% CI = 1.21–2.04, P = 0.002), potassium (OR = 2.35, 95% CI = 1.45–3.8, P = 0.002), sodium (OR = 0.9, 95% CI = 0.84–0.97, P = 0.008), and others (Supplementary Fig. 2).
AIP was accurate in predicting the odds of HTN combined with DMAlthough AIP ranked after glycohemoglobin, total cholesterol, and glucose in the XGBoost model for predicting HTN combined with DM, its relative contribution and coverage still showed significant predictive value (Fig. 4A and C). This indicated that AIP was a key indicator in the model and had potential importance for clinical prediction of hypertension combined with diabetes. The predictive efficiency of AIP for HTN combined with DM odds was further assessed by generating an ROC curve in Model 3, which showed an AUC value of 0.929 (95% CI: 0.915–0.943), and ROC curve analysis identified an optimal cutoff value of 0.082, corresponding to a sensitivity of 0.867 and specificity of 0.865. (Fig. 4D). These results highlight that AIP is highly accurate in predicting the odds of HTN combined with DM.
Fig. 4
Predictive performance of the AIP index. (A) Exploring the importance of variables for HTN combined with diabetes mellitus from XGBoost. (B) The variable coverages in the XGBoost model for predicting hypertension combined with diabetes mellitus. (C) Explored the frequencies of variables for hypertension combined with diabetes mellitus in XGBoost. (D) Receiver operating characteristics of the AIP index
(AIP: Atherogenic index of plasma; BMI: Body Mass Index; KI: kidney insufficiency)
Comments (0)