
Remember me


The analysis utilized publicly available data from the combined 2013–2018 NHANES cycle. NHANES employed a complex, multi-stage probabilistic sampling design to obtain a nationally representative sample. The sampling details are as follows: A multi-stage sampling design is used. Firstly, the entire country is divided into primary sampling units (PSUs), typically counties or county-level independent cities. Then segments are randomly selected within each PSU. Finally, households and individuals are randomly selected within each chosen residential area. Stratified and unequal probability sampling methods are employed to ensure the representativeness of the sample in NHANES. The samples are stratified based on demographic characteristics such as age, gender, and race/ethnicity to include different groups of people. Different individuals have varying probabilities of being sampled to ensure an adequate representation of minority and vulnerable groups. The objectives of NHANES are to provide objective health statistics and address public health issues that affect the general population. Detailed survey operating manuals, consent documents, and pamphlets for each period can be found on the NHANES website at https://www.cdc.gov/nchs/nhanes/index.htm. The study design of NHANES was approved by the Institutional Review Board of the National Center for Health Statistics (NCHS)(approval number: Continuation of Protocol #2011-17and Protocol #2018-01), and all participants provided informed consent.
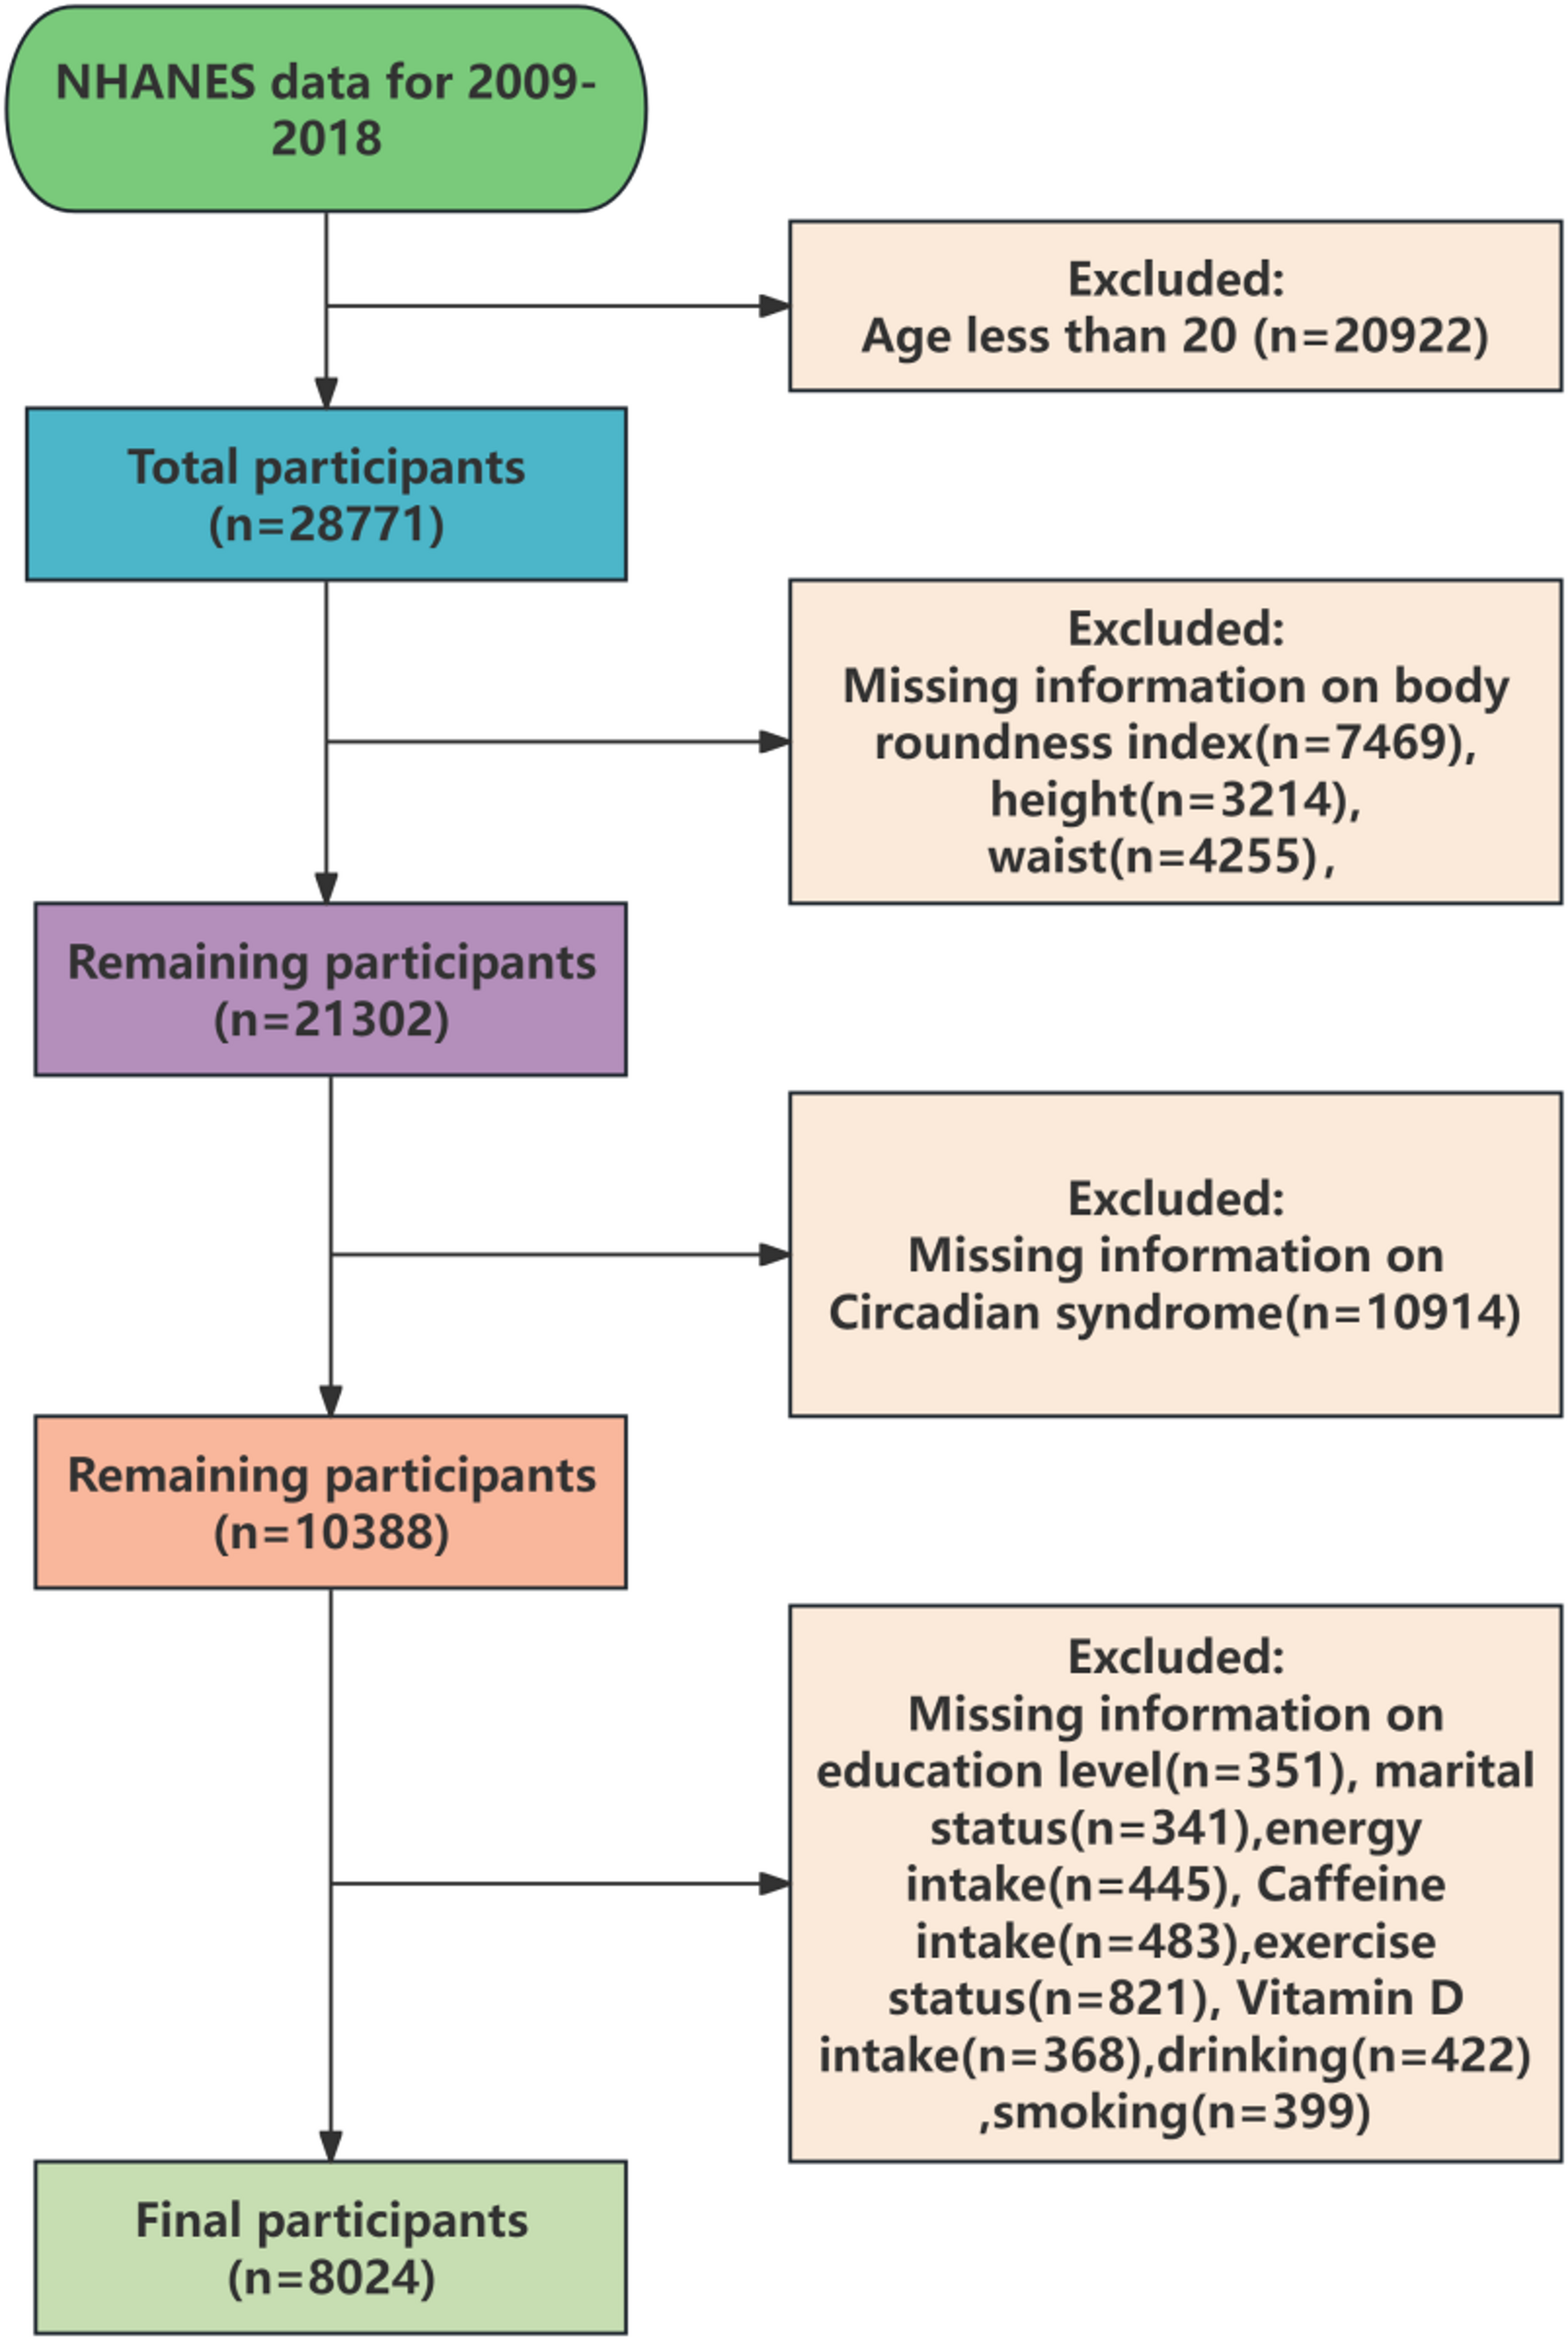
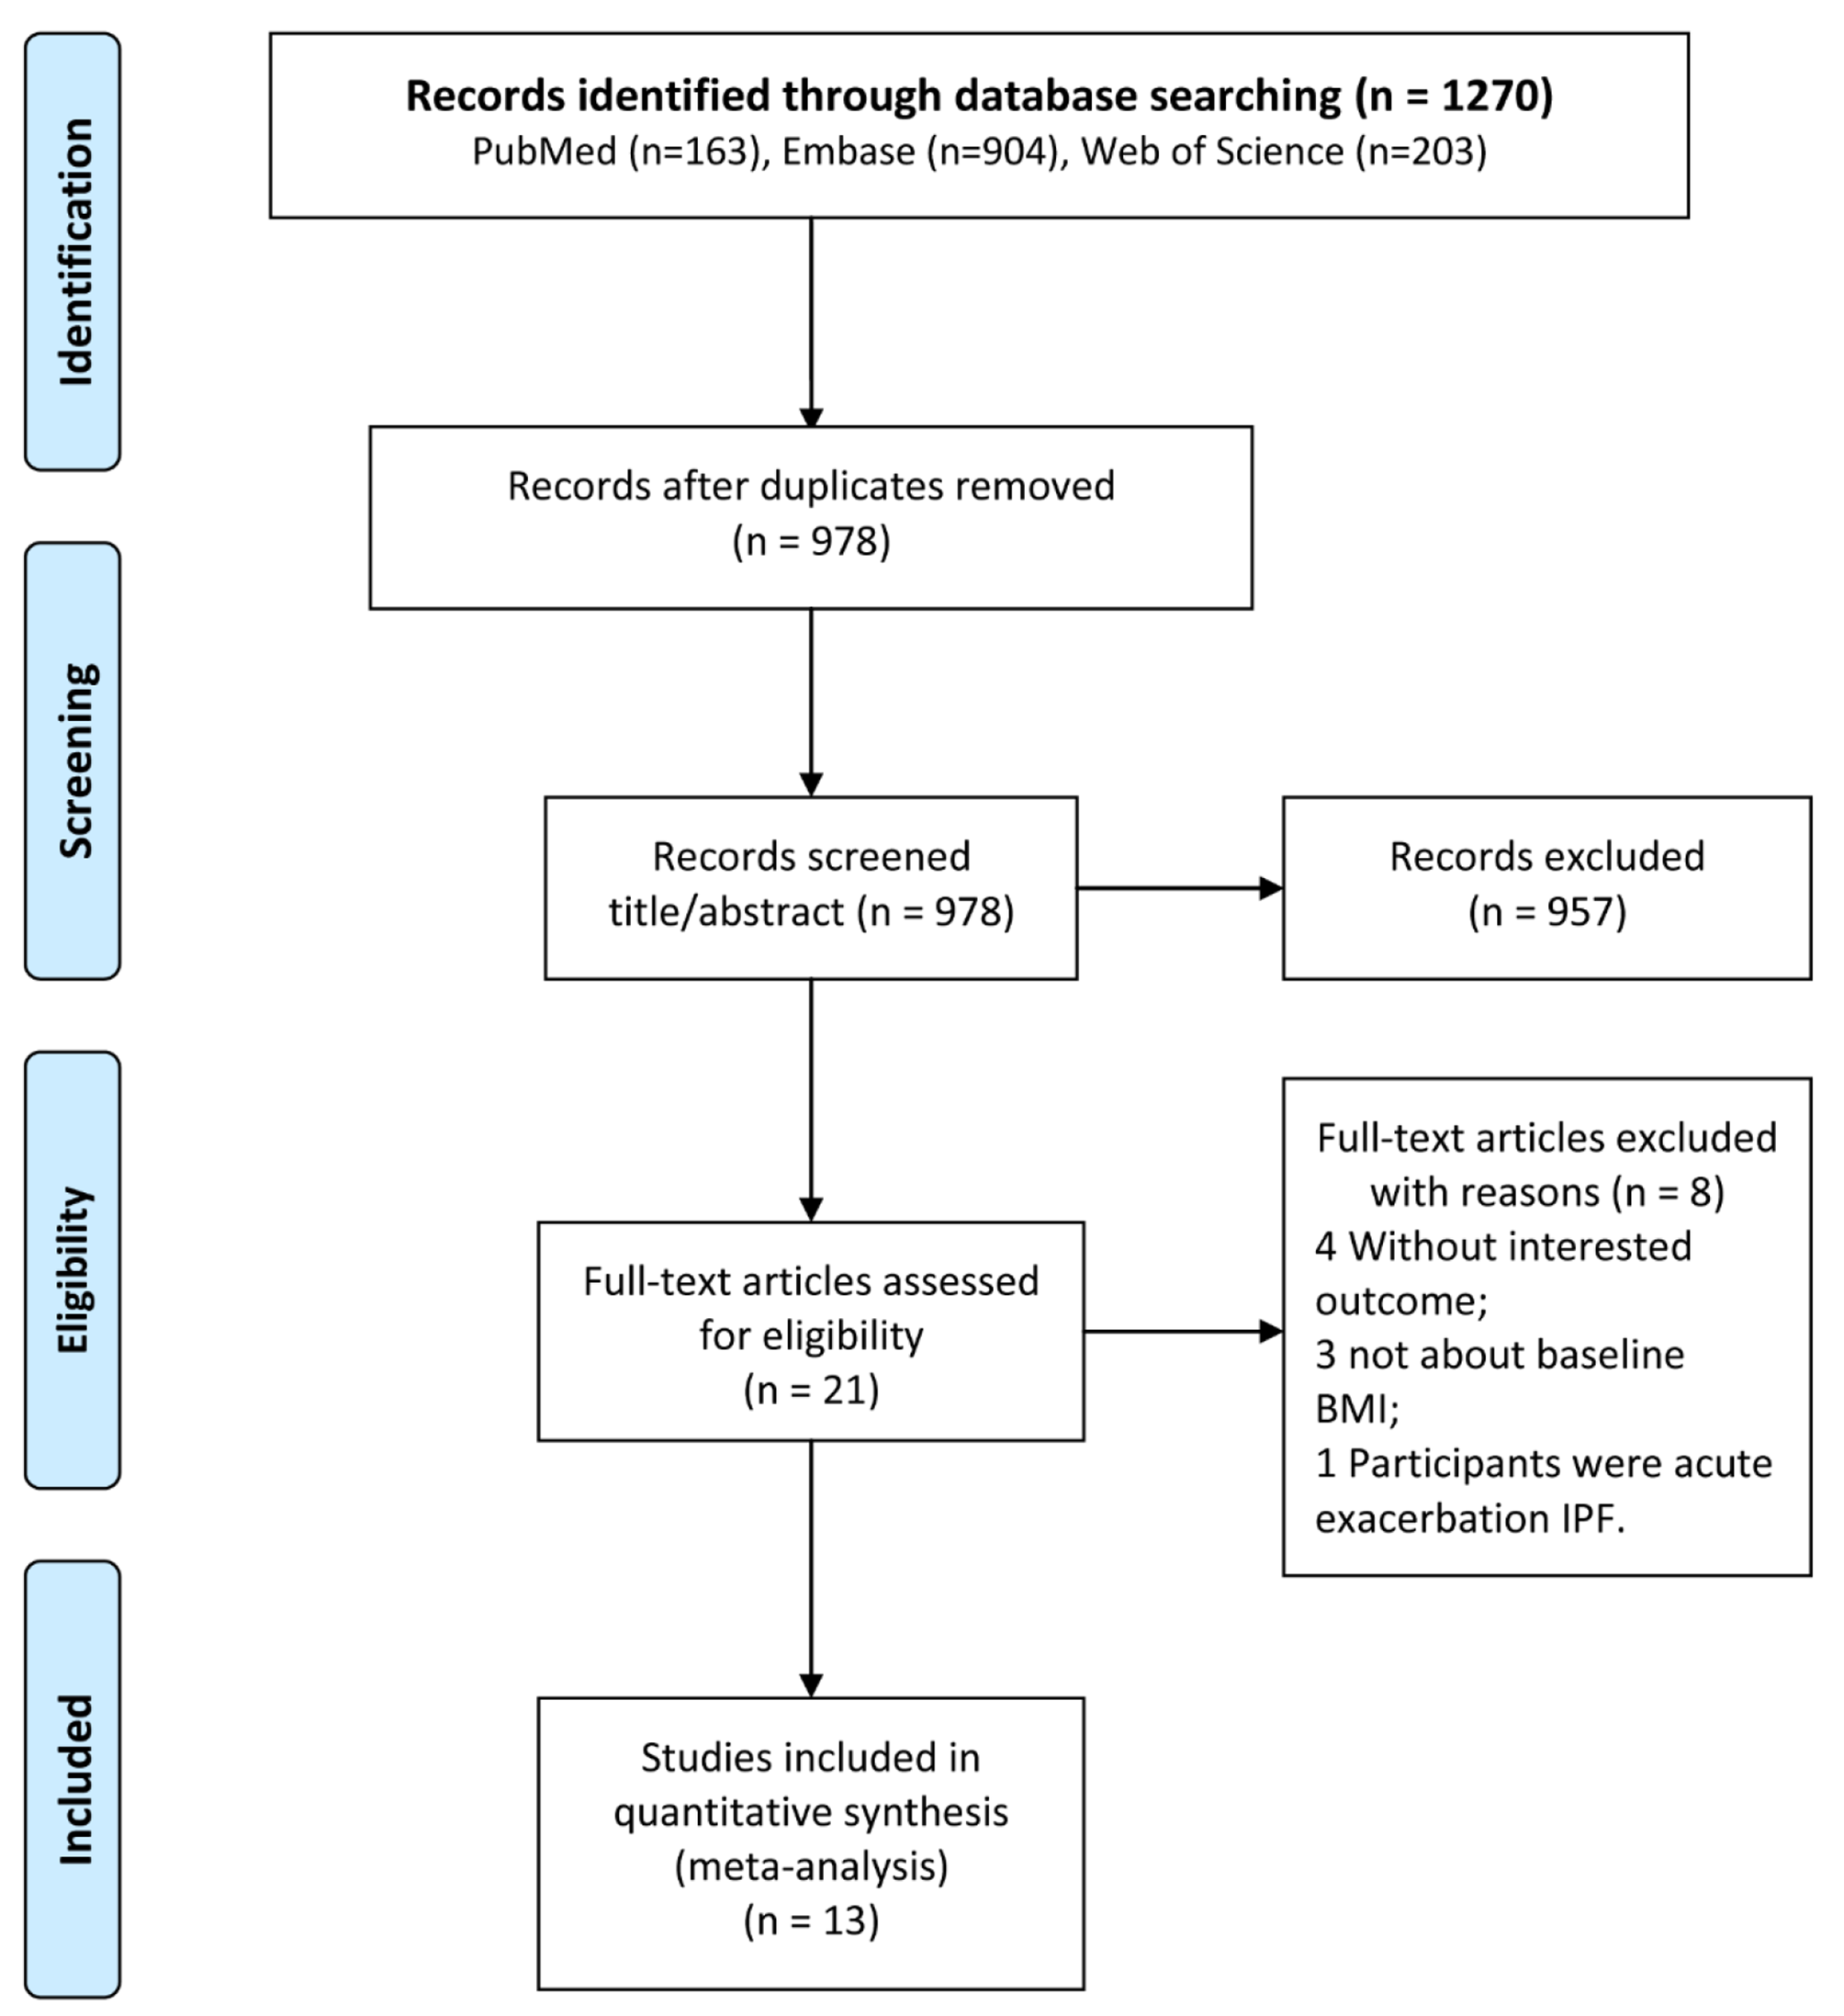
Between 2013 and 2018, a total of 6,058 obese participants aged over 20 with complete ABSI and CHD data were identified. After excluding 1,012 patients with missing covariates, our final data analysis included 5,046 participants. Please refer to Fig. 1 for the detailed flowchart.
Fig. 1
Flow chart of research population
Defnition of the exposure and outcome variableThe exposure variable in this study is ABSI, which comprises waist circumference (WC), height, and BMI. ABSI is calculated as WC divided by the square of BMI multiplied by the square root of height [8]. The outcome variable, CHD, is assessed through a questionnaire, and the patients’ CHD status is coded by trained clinicians according to the International Statistical Classifcation of Diseases and Related Health Problems, Tenth Revision (ICD-10) [14, 15] using codes I00-I09, I11, and I13 for initial identification and I20-51 for further confirmation. Relevant literature has further substantiated the questionnaire-based collection of CHD diseases in terms of its accuracy [16].
Data collectionSociodemographic characteristicsThe participants reported their age, sex, race (Hispanic, non-Hispanic White, non-Hispanic Black, other race), poverty income ratio, current smoking status (no or yes), disease history, and medication history. Current smokers were confirmed to smoke every day or several days [17]. Anthropometric indicators include height, weight, waist circumference (WC), and blood pressure (BP). Body height and weight were measured without shoes or thick clothing using a medical scale. WC (cm) was measured at the level of the umbilicus during normal end expiration while standing, or if the umbilical level was lower due to visceral fat accumulation, between the costal margin and iliac crest. BMI, calculated as weight divided by height squared in kg/m2, was used as an indicator. Blood pressure measurements were taken using a mercury sphygmomanometer following the standard protocol recommended by the American Heart Association at that time. Three readings were obtained consecutively from the same arm. Systolic blood pressure and diastolic blood pressure (DBP) were defined as the average of these three measurements. Hypertension was defined as SBP ≥ 140 mm Hg and/or DBP ≥ 90 mm Hg, or if an individual reported taking antihypertensive medication or being diagnosed with hypertension by a healthcare professional. Diabetes mellitus (DM) was defined as having a fasting blood glucose level of ≥ 7 mm/L, being diagnosed with diabetes by a healthcare professional, or currently using medication to manage high blood glucose levels [18].
Laboratory measurementsBlood samples were analyzed under fasting conditions following an overnight fast of more than 8 h. All blood parameters, including blood lipids, renal function parameters, and glycated hemoglobin A1c (HbA1c%), were measured at a certified medical and chemical laboratory diagnostic department using standardized international laboratory methods. The glomerular filtration rate (eGFR) was estimated using the Chronic Kidney Disease Epidemiology Collaboration (CKD-EPI) equation [19].
Statistical analysisThe threshold for statistical significance was set at a two-tailed P-value of less than 0.05. The statistical packages R (http://www.r-project.org) and Empower (R) (www.empowerstats.com) were employed to conduct all statistical analyses.
The normality of evaluation variables in this study was assessed through both Quantile-Quantile plots (Q-Q plots) and Anderson-Darling tests. Specifically, two methods were employed to examine whether a normal distribution exists: comparing the histogram of sample data with that of a standard normal curve and comparing normalized quantiles from sample data with those from a standard normal distribution using a Q-Q diagram. In this diagram, the correlation between the sample data and normal data can indicate whether they conform to a normal distribution. For normally distributed data, scattered points on the Q-Q diagram should approximate a straight line, indicating a high positive correlation. Since this study had a sample size of ≥ 200, we employed an Anderson-Darling test to determine if variables conformed to a normal distribution. When p ≥ 0.05, it was considered that the data conformed to a normal distribution.Mean and standard deviation (SD) were used to describe the continuous variables, and one-way analysis of variance (ANOVA) was performed for comparison. Percentages were used to describe the categorical variables, and a chi-square test was conducted for comparison. Multivariate logistic regression models were used to calculate the odds ratio (OR) values of CHD and explore the relationship between ABSI and outcome variables. Three models were constructed in this study to exclude confounding factors. Model 1 represented the unadjusted data, model 2 was adjusted for age, sex, BMI, SBP, DBP, model 3 was adjusted for age, sex, BMI, race, poverty income ratio, SBP, DBP, smoking status, HbA1c%, TC, HDL, eGFR, DM, Hypertension, antihypertensive drugs, Lipoprotein-lowering drugs, hypoglycemic drugs. Covariate were identified by having the outcome variable as a traditional risk factor and by having the effect of the calculated covariate on the outcome variable estimate changed by at least 10% individually [20]. A generalized additive model and fitting curve (penalized spline method) was performed to detect the linear relationships between the ABSI and CHD. In addition, possible modifications of the association between ABSI and CHD were also assessed for the following variables: sex (male vs. female), age (< 65 vs. ≥ 65), race ((non-hispanic white vs. non-hispanic black vs. mexican american vs. other hispanic vs. other races), DM (no vs. yes) and hypertension (no vs. yes).
Comments (0)