
Remember me
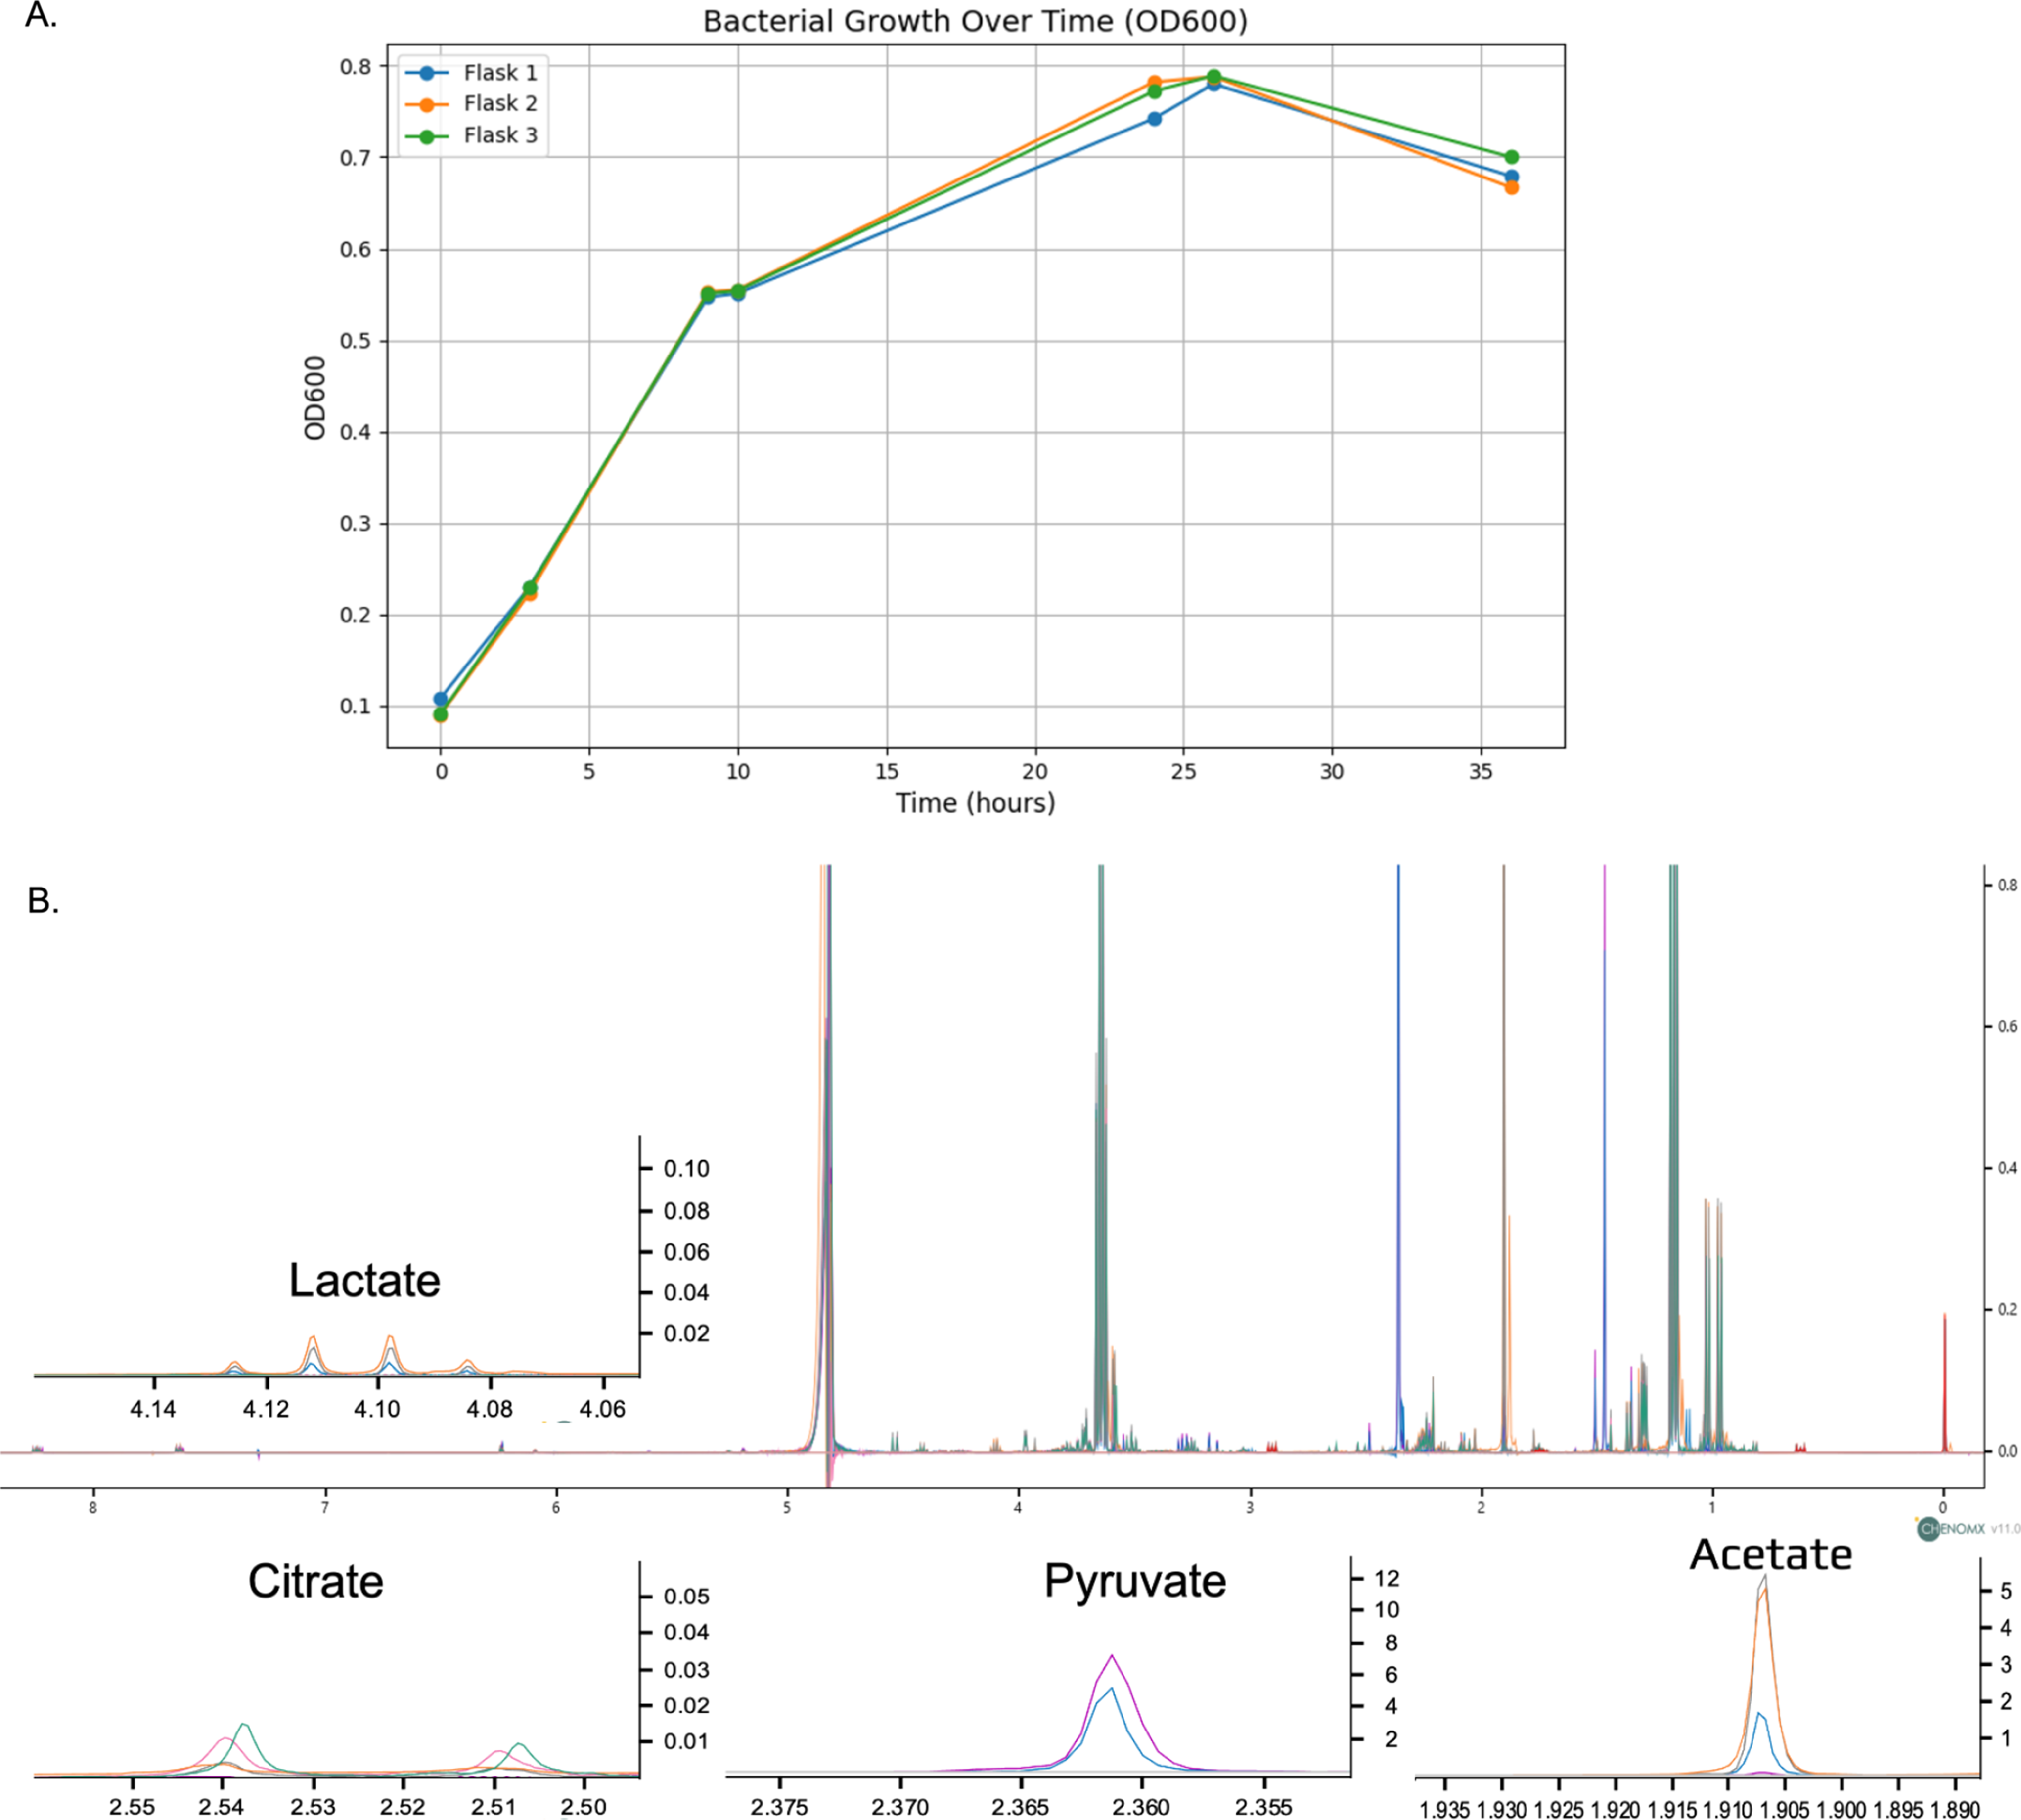
The optical density (OD) measurements at 600 nm were taken at various time points to assess the bacterial growth in three separate flasks (Fig. 1A). By 24 h (14 h post-induction), the cultures reached their peak OD readings, with Flask 1 at 0.742, Flask 2 at 0.782, and Flask 3 at 0.772. Figure 1B displays the full NMR spectra overlaid across different production stages, illustrating the temporal dynamics of metabolites in the bacterial culture. Key metabolites such as lactate, citrate, pyruvate, and acetate are highlighted with expanded views to provide a more detailed analysis.
Fig. 1
(A) Comparative Analysis of Bacterial Growth in Three Independent Cultures Over 36 h, Monitored by Optical Density at 600 nm (B) B Overlay of full NMR spectra at different production stages, with detailed views of key metabolites: lactate, citrate, pyruvate, and acetate, illustrating their concentration dynamics throughout the production process. (0 h (purple), 3 h (blue), 9 h (orange), 10 h (gray), 24 h (pink), 26 h (green)
The bar plots in Fig. 2 illustrate the temporal concentration changes of key metabolites involved in central metabolic pathways during bacterial growth and recombinant protein production. These metabolites were measured at various time points: 0 h, 3 h, 9 h (IPTG induction), 10 h, 24 h, 26 h, and 36 h, capturing metabolic dynamics from the lag phase through the exponential and stationary phases of bacterial growth. The analysis of metabolite concentrations across different time points revealed significant changes in key intermediates involved in central carbon metabolism during bacterial growth and recombinant protein production. These metabolic shifts were observed both before and after IPTG induction, reflecting the cells’ metabolic response to the high availability of pyruvate as the primary carbon source.
Fig. 2
Time-Dependent Concentration Profiles of Key Metabolites during Bacterial Growth and Recombinant Protein Production. A. Pyruvate, B. Acetate, C. Lactate, D. Citrate, E. Glycine, F. Valine, G. Leucine, H. Isoleucine, I. Maleate, J ATP, K. Aspartate, L. Arginine, M. Adenine, N. 2-Hydroxyisovalerate
Pyruvate (Fig. 2A), the main carbon source in this experiment, exhibited a rapid decrease starting well before IPTG induction, with its levels already substantially reduced by the 9-hour mark. At 9 h, just prior to the addition of IPTG for protein induction, the OD values had further increased to approximately 0.55 in all flasks. Early decline in pyruvate suggests that bacterial cells are actively consuming pyruvate through multiple metabolic pathways to support energy production and biosynthesis. The sustained reduction of pyruvate post-9 h further indicates that the cells continue to use pyruvate intensively during recombinant protein production. The early depletion of pyruvate is likely a result of its diversion into multiple pathways, including both the TCA cycle for energy production and overflow metabolic pathways. Concurrent with the depletion of pyruvate, both acetate (Fig. 2B) and lactate (Fig. 2C) showed substantial increases in the culture media prior to IPTG induction. This observation suggests that bacterial cells, faced with an abundance of pyruvate, are converting excess pyruvate into acetate and lactate as a means of mitigating the buildup of intracellular pyruvate. These metabolites are likely excreted into the medium as waste products to avoid toxic intracellular accumulation. The high concentrations of acetate and lactate in the culture media reflect overflow metabolism, a process whereby excess carbon from glycolysis (in the form of pyruvate) is diverted into pathways that produce acetate and lactate, which are then secreted from the cells. This process is typical of bacterial cultures experiencing rapid growth and high glycolytic flux, where the TCA cycle becomes saturated and alternative metabolic routes are used to handle the surplus carbon.
After IPTG induction at 9 h, the concentrations of acetate and lactate in the medium remained elevated. The sustained high levels of acetate and lactate post-IPTG likely reflect the fact that once these metabolites are expelled into the culture medium, their reuptake and reintegration into intracellular metabolism is limited. Acetate and lactate, once secreted, may no longer serve as useful substrates for energy production or biosynthesis. Instead, their accumulation in the medium suggests that the bacterial cells are unable, or inefficient, at reclaiming these byproducts. Citrate (Fig. 2D), a key intermediate of the TCA cycle, showed a gradual increase in concentration, particularly after IPTG induction. This suggests that while pyruvate is being converted into acetate and lactate, a portion of it continues to fuel the TCA cycle to meet the energy demands and biosynthetic needs of the cells. Citrate’s rise is indicative of active TCA cycle flux, particularly after recombinant protein production begins, as the cells require sustained energy and carbon skeletons for the synthesis of amino acids and other macromolecules. Together, the patterns observed in pyruvate, acetate, lactate, and citrate concentrations highlight the metabolic flexibility of bacterial cells in response to pyruvate availability. Before IPTG induction, excess pyruvate is channeled into overflow pathways, resulting in the secretion of acetate and lactate into the medium. Following IPTG induction, this pattern continues, but the rise in citrate suggests that a portion of the pyruvate is also directed into the TCA cycle to support the increased metabolic demands of recombinant protein production. The secretion of acetate and lactate into the culture media throughout the experiment underscores the cells’ need to expel excess metabolites and maintain intracellular metabolic balance under conditions of high pyruvate flux.
Glycine (Fig. 2E) shows stable concentrations before IPTG induction, followed by a modest increase during the later time points. Branched-chain amino acids (BCAAs), including valine (Fig. 2F), leucine (Fig. 2G), and isoleucine (Fig. 2H), show moderate increases post-IPTG induction, indicative of their essential roles in protein synthesis. The upregulation of BCAA biosynthesis following IPTG induction reflects the heightened demand for amino acids during recombinant protein production. The concentration of maleate (Fig. 2I) increases gradually, peaking at 24 h, suggesting its involvement in energy production pathways as bacterial cells transition into the stationary phase. ATP (Fig. 2J) levels rise significantly after IPTG induction, peaking at 10 h, indicating an increased demand for energy during the early stages of recombinant protein synthesis. This is followed by a gradual decline in ATP levels, reflecting a stabilization of energy metabolism as the bacterial culture approaches stationary phase. The ADP (Fig. 2L) profile mirrors that of ATP, peaking at 10 h and gradually decreasing, indicating high energy turnover during protein production.
Aspartate (Fig. 2K) and arginine (Fig. 2L) show continuous increases in concentration after IPTG induction, with aspartate peaking at 24 h. This suggests their critical roles in supporting protein synthesis and nitrogen metabolism, particularly as amino acid demand rises during recombinant protein production. Similarly, betaine (Fig. 2K) concentrations increase over time, peaking at 24 h. Betaine is known to function as an osmoprotectant, and its accumulation may reflect bacterial stress responses during extended periods of growth and protein synthesis. Adenine (Fig. 2M), a purine nucleotide, increases steadily following IPTG induction, peaking at 36 h, indicating heightened nucleotide turnover associated with increased DNA/RNA synthesis during recombinant protein production. Finally, 2-hydroxyisovalerate (Fig. 2N), a metabolite linked to branched-chain amino acid metabolism, shows a gradual increase over time, peaking at 36 h. This suggests its involvement in secondary metabolic pathways, particularly as bacterial cells shift toward the stationary phase and metabolic processes become focused on maintenance rather than growth.
Taken together, these results reveal a clear metabolic reprogramming in response to IPTG induction and recombinant protein production. Pyruvate consumption, acetate overflow, and shifts in amino acid and nucleotide metabolism reflect the bacterial cells’ need to balance energy production with the synthesis of macromolecules for protein production. The most significant metabolic changes occur between 9 and 10 h, shortly after IPTG induction, indicating the critical metabolic adjustments required to meet the demands of protein synthesis. By 24 h (14 h post-induction), the cultures reached their peak OD readings, with Flask 1 at 0.742, Flask 2 at 0.782, and Flask 3 at 0.772. At 26 h (16 h post-induction), the OD values remained stable around 0.78 for all flasks, indicating continued growth. However, at the 36-hour time point (26 h post-induction), a slight decrease in OD was observed across all flasks, with values dropping to 0.679 in Flask 1, 0.667 in Flask 2, and 0.700 in Flask 3. This decline suggests that the bacterial cultures may have entered the stationary phase or experienced nutrient depletion in the medium. As the bacterial culture transitions to the stationary phase (24–36 h), metabolic activity stabilize s, as evidenced by the gradual leveling off of key metabolite concentrations.
Multivariate analysis of metabolite profilesPartial Least Squares Discriminant Analysis (PLS-DA) was performed to further explore the metabolic changes in response to IPTG induction and identify metabolites that contribute most to the observed variations across time points. The PLS-DA scores plot (Fig. 3A) highlights the discriminative power of the PLS-DA model, which maximizes the separation between metabolite profiles at different time points. Component 1 and Component 2 in the PLS-DA model are the first two latent variables that maximize the separation between predefined groups. In this plot, Component 1 explains 48.4% of the variance, and Component 2 explains 22.3%, together capturing a significant portion of the total variability. The clear separation of the time points along these two components reflects the dynamic changes in bacterial metabolism over time, particularly in response to IPTG induction at the 9-hour mark. Pre-induction time points, 0 h, 3 h, and 9 h, form distinct clusters, with 9 h showing more separation from earlier time points, as expected, given that IPTG induction occurs at this time. Interestingly, the 9 h and 10 h samples (1 h post-IPTG induction) show a sharp metabolic shift, as these two clusters are well separated, indicating a rapid metabolic reprogramming following IPTG addition. This shift is likely due to the metabolic demands imposed by recombinant protein production, which alters the cellular utilization of pyruvate and other metabolites involved in central carbon metabolism and amino acid biosynthesis. The pairwise scatter plots of the first five components of the PLS-DA model (Fig. 3B) provide a more detailed breakdown of how each component contributes to the separation of time points. As shown in the plot, Component 1(48.4%) and Component 2 (22.3%) account for most of the variance, with clear separation of early (0 h, 3 h) and post-induction time points. This further supports the observation that IPTG induction introduces significant metabolic shifts, which are well captured by the first two components. The pairwise component plots confirm that the metabolic changes induced by IPTG are most strongly captured by Components 1 and 2, with minimal variance explained by subsequent components. This suggests that the major metabolic reprogramming in response to IPTG induction can be largely described by the shifts along these two axes, with smaller components reflecting minor metabolic adjustments as the cultures reach the stationary phase.The PLS-DA analysis provides a supervised view of the temporal metabolic shifts in bacterial cultures during recombinant protein production. The analysis confirms that IPTG induction at 9 h is a major driver of metabolic variation, leading to rapid and distinct metabolic changes as bacteria adapt to the demands of protein synthesis. The stabilization of metabolite profiles at later time points, as seen in both the scores plot and pairwise component plots, reflects the transition into the stationary phase, where nutrient consumption slows, and the metabolic state becomes more consistent.
Fig. 3
Multivariate Analysis of Metabolite Profiles at Different Time Points. (A) Partial Least Squares Discriminant Analysis (PLS-DA) Scores Plot highlighting the discriminative power of PLS-DA, with Component 1 explaining 48.4% of the variance and Component 2 explaining 22.3%. The plot shows distinct separation of metabolic profiles over time, similar to the PLS-DA results. (B) Pairwise Plot of PLS-DA Components showing the relationship between components generated by the PLS-DA model. (C) Variable Importance in Projection (VIP) Scores from the PLS-DA model, ranking metabolites based on their contribution to class separation. Metabolites such as acetate, glycine, and citrate are the top contributors to the separation between time points, with corresponding heat maps showing their concentration changes over time
To further understand the metabolites driving the separation of time points in the PLS-DA analysis, we calculated the Variable Importance in Projection (VIP) scores (Fig. 3C). VIP scores rank metabolites based on their contribution to the PLS-DA model, identifying those most influential in distinguishing between time points, particularly in response to IPTG induction and the subsequent phases of bacterial growth and protein production.
The metabolites with the highest VIP scores are displayed in Fig. 3C, indicating their importance in explaining the metabolic shifts across the time points. The top-ranking metabolites include pyruvate, acetate, glycine, citrate, isoleucine, and valine, which are directly or indirectly involved in energy metabolism, amino acid biosynthesis, and central carbon metabolism. These metabolites are particularly important in the context of bacterial growth under minimal medium conditions, where pyruvate serves as the sole carbon source.
Its importance in the VIP score suggests that shifts in glycine metabolism are closely linked to the demands of protein production, especially after IPTG induction, when the need for amino acids increases. The VIP score analysis identifies key metabolites that are critical in explaining the metabolic shifts observed during the bacterial growth phases and in response to IPTG induction. Pyruvate, acetate, glycine, citrate, and branched-chain amino acids play pivotal roles in supporting energy metabolism and protein biosynthesis under minimal medium conditions with pyruvate as the carbon source.
These findings provide a comprehensive overview of how central metabolism is reprogrammed in response to the metabolic demands imposed by recombinant protein synthesis (Table 1).
Table 1
Concentration of metabolites at different time points during bacterial growth and recombinant protein production. The concentrations of selected metabolites measured in the culture media at multiple time points (0h, 3h, 9h, 10h, 24h, 26h, and 36h). Metabolite concentrations are reported for three biological replicates (R1, R2, and R3) for each time point
Comments (0)