
Remember me
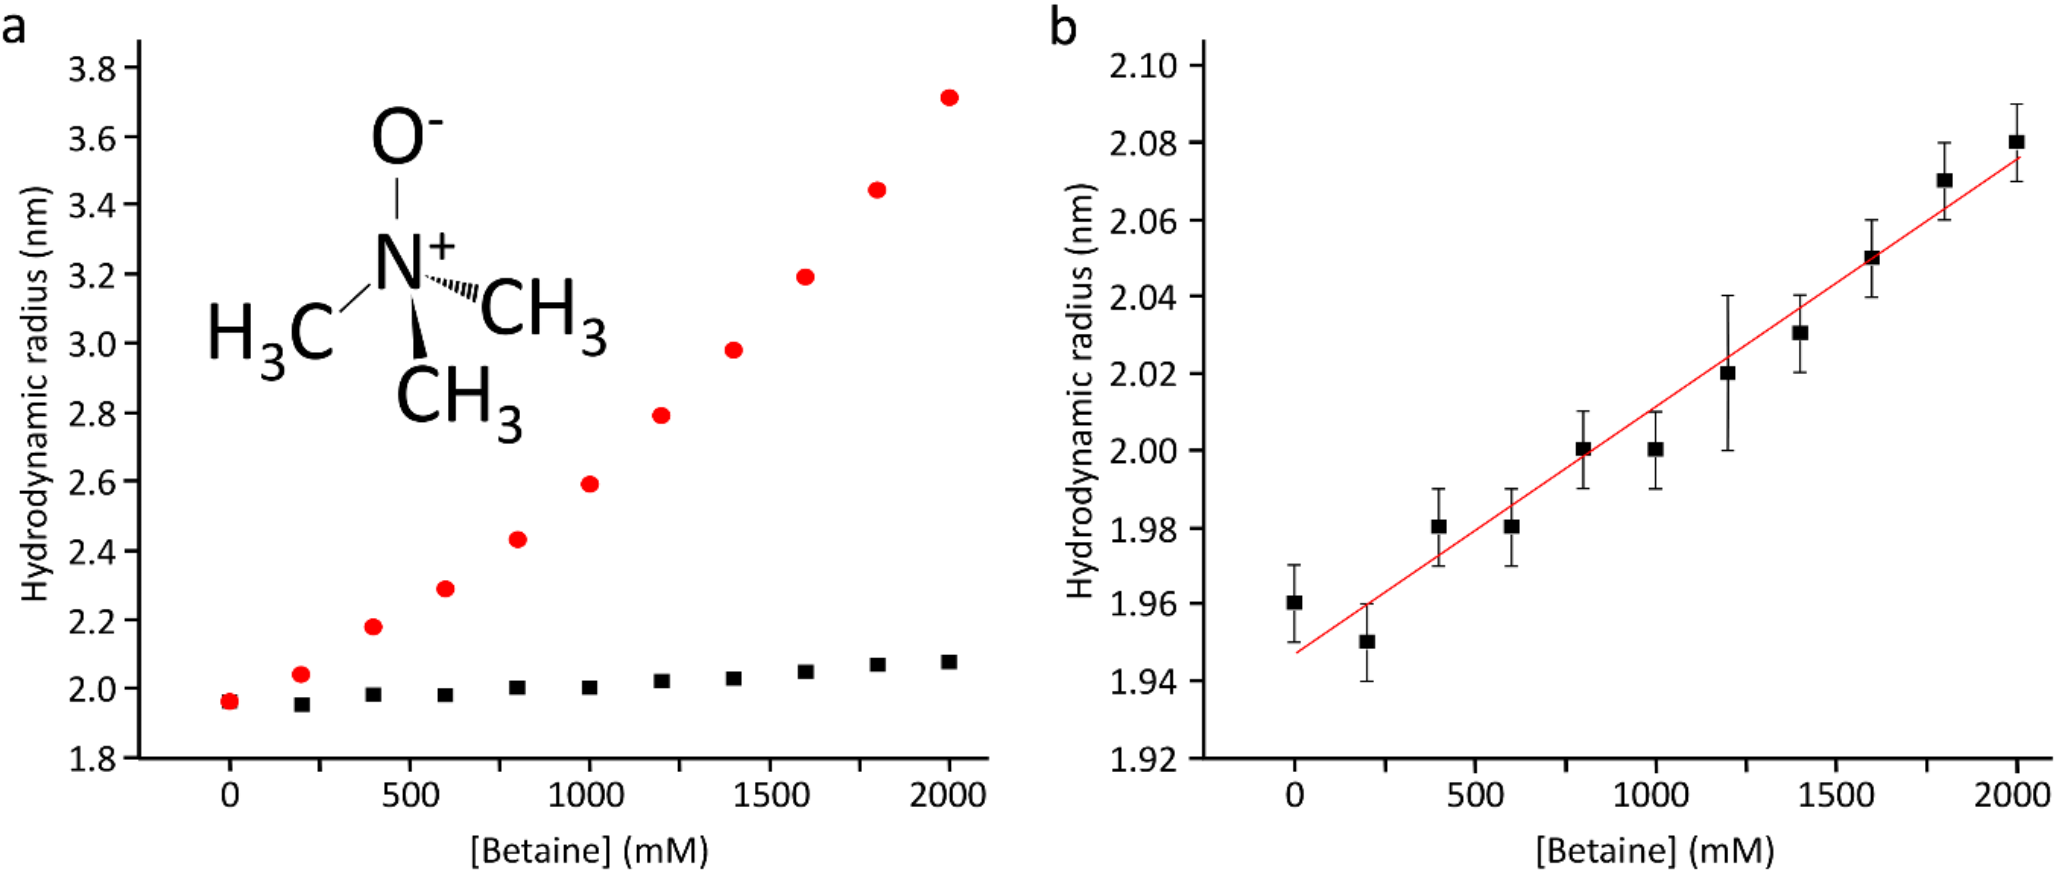
Barnase is an RNAse that catalyses a transesterification of RNA to make a 2’,3’ cyclic intermediate, which is then hydrolysed. It undergoes rather small conformational changes on binding of substrate. On titration of 1 M betaine into barnase, there was an increase in the viscosity of the solution, measured at just under 30% using Fida (Fig. 1a) (Jensen and Østergaard 2010). After correction for the viscosity, there is a linear increase in hydrodynamic radius of 0.64 ± 0.04 Å/M, consistent with replacement of some of the water in the hydration layer by betaine (Fig. 1b). Although betaine (Fig. 1, insert) is excluded from the protein surface, this does not mean that there is no betaine at the surface, merely that the concentration at the surface is lower than it would be in the absence of protein. The small increase in hydrodynamic radius is fully consistent with these expectations. There was a large 1H signal from the betaine at 3.25 ppm, which necessitated some reduction in the receiver gain in HSQC spectra. There was also an increased level of t1 noise and some bleed through of the betaine methyl signal into HSQC spectra, together with a small increase in pulse length. Despite these effects (which overall reduced the intensity of many signals by 20–30%), the quality of the HSQC spectra remained good even with 1 M betaine. We have previously reported an analysis of chemical shift changes in barnase on addition of betaine (Trevitt et al. 2024), which indicated that there is very little direct binding interaction between betaine and barnase. Similar observations were made here: no signals showed shift changes with betaine that were curved and could be convincingly fitted to give a dissociation constant, consistent with very weak binding. There were many chemical shift changes that were linear with betaine concentration, which we interpret (following Trevitt et al. 2024) as arising from interactions between betaine and water, in other words from a change in solvent structure or solvent fluctuations as betaine is added. As a further check on direct binding, saturation transfer difference (STD) spectra (Mayer and Meyer 1999) were collected of barnase in the presence of betaine, and showed no binding.
Fig. 1
Hydrodynamic radius of barnase estimated using Fidabio, which measures the translational diffusion rate across a capillary, by detecting the profile as it passes a detector. (a) (red) Apparent hydrodynamic radius, calculated from the Stokes-Einstein equation; (black) True hydrodynamic radius corrected for solution viscosity as a function of betaine concentration. The chemical structure of betaine is shown. (b) True hydrodynamic radius (expansion of (a), with errors and fitting)
Most backbone amide signals in barnase can be observed, though there are some that are often absent or very weak. Most signal intensities reduce by approximately 25% on addition of 1 M betaine, due to a combination of increased viscosity and reduced receiver gain, the intensity change being linear with betaine concentration. After correction for this effect, roughly 80% of signals have intensities that do not change, with most of the others showing small linear reductions. There was only one absent signal that reappeared on addition of betaine, namely Arg59 (Fig. 2a). Arg59 is one of three backbone amides observed to form hydrogen bonds to the ligand in the crystal structure of barnase with d(CGAC) (Buckle and Fersht 1994), and sits in a loop that has µs/ms timescale dynamics in the d(CGAC) complex but not in the free state (Pandya et al. 2018) (Fig. 2b). In that study we were unable to characterise Arg59 itself because the signal could not be observed, in either the free or the bound state. Several other signals had significant increases in intensity on addition of betaine, namely Ala37, Ser38, Ser67 and Gly68 (Fig. 2c): these all sit at the tips of loops, and three of these (S38, S67 and G68) are absent from HSQC spectra in most of our previous studies (Pandya et al. 2018; Wilton et al. 2009). Thus, the common feature of all four is that they are typically weak or absent in HSQC spectra, and they are located near the ends of loops.
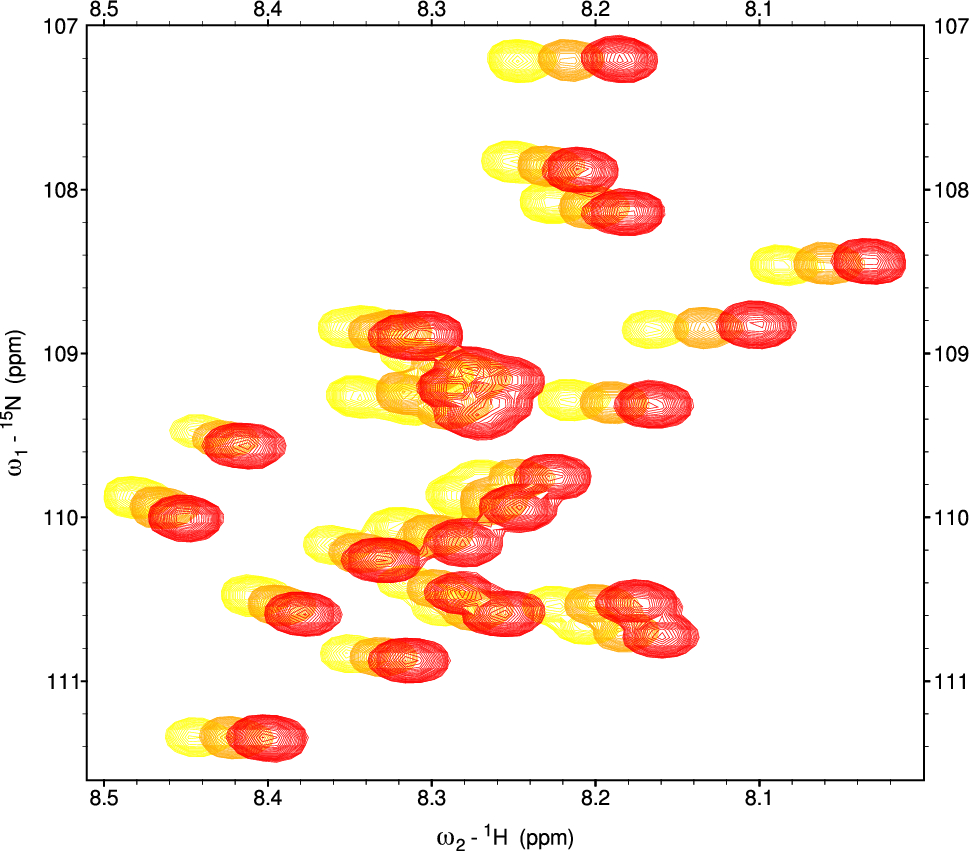
Fig. 2
Increases in signal intensities in barnase on addition of betaine. (a) Part of the HSQC spectrum of barnase without betaine (blue) and with 1 M betaine (red). (b) Crystal structure of barnase (1a2p) showing the locations of the signals with the largest intensity increases. The active site is the shallow depression at top right. The backbone is coloured from blue at the N terminus to red at the C terminus. (c) Changes in intensity relative to an average of unaffected signals. Blue circles A37; green squares S38; black triangles S67; red diamonds: G68. (d) 1D slices at 122.9 ppm through HSQC spectra of barnase. Black without betaine, red plus 1 M betaine. (e) Part of the HSQC spectrum of barnase. Black without betaine, red plus 1 M betaine. Signal intensities were adjusted so that control signals (Asn/Gln sidechain amides) had the same intensity in both spectra. For clarity, the red spectrum has been shifted down. (f) A region of the HSQC spectrum containing signals for S38 and the sidechain of Asn41 (acting as an internal control). Spectra for 0, 0.4, 0.6, 0.8 and 1.0 M betaine are shown, keeping the intensity of the N41 signal at the same intensity, with each successive spectrum being displaced to the right
For most signals, there is no clear change in linewidth on addition of betaine (Fig. 2de), although overall there is a loss in signal-to-noise resulting from the addition of betaine. There is however a group of weak signals that is markedly more intense (Fig. 2cf). Considering that the increase in viscosity is approximately 25%, it is surprising that there is no obvious change in 1H linewidth. Possibly the window function has sharpened the signals enough to remove any obvious line broadening.
The dynamics of barnase was probed using 15N relaxation. 15N R1, R2 and NOE were measured and analysed using Modelfree (Mandel et al. 1995) to derive order parameters. The results are shown in Fig. 3, and show, as reported previously (Sahu et al. 2000), that barnase has limited internal dynamics, with an average order parameter of 0.865, with only the N terminus and residue 98 having an order parameter below 0.7. There is nothing noteworthy about the order parameters of the five residues listed above or the loops that they sit in. Addition of 1 M betaine increased the average order parameter by a small but significant amount (to 0.873, p < 0.01, Student’s t-test), and the results indicated the expected increase in correlation time, from 6.64 to 8.53 ns. In barnase alone, most residues fitted to the simplest model of Modelfree, i.e. requiring just the order parameter, although 9 residues required the addition of a correlation time τe characterising slightly slower motions. Only 10 residues required an Rex term, characteristic of motions on the µs/ms timescale. On addition of 1 M betaine, fewer residues required τe (only 3): in conjunction with the increased order parameters, this implies a more rigid protein at fast timescales. Some Rex terms decreased, and some increased (Fig. 3e), implying no consistent change in motions on the µs/ms timescale.
Amide exchange rates were measured in the absence and presence of 1 M betaine. Exchange rates in 1 M betaine were slower by a factor of 2.8 ± 1.0 (Table 1). The exchange rate was slowed by roughly the same factor over a wide range of measured rates (Fig. 4). This suggests that the rare unfolding events that lead to amide exchange are less frequent (roughly by a factor of 3) in the presence of 1 M betaine.
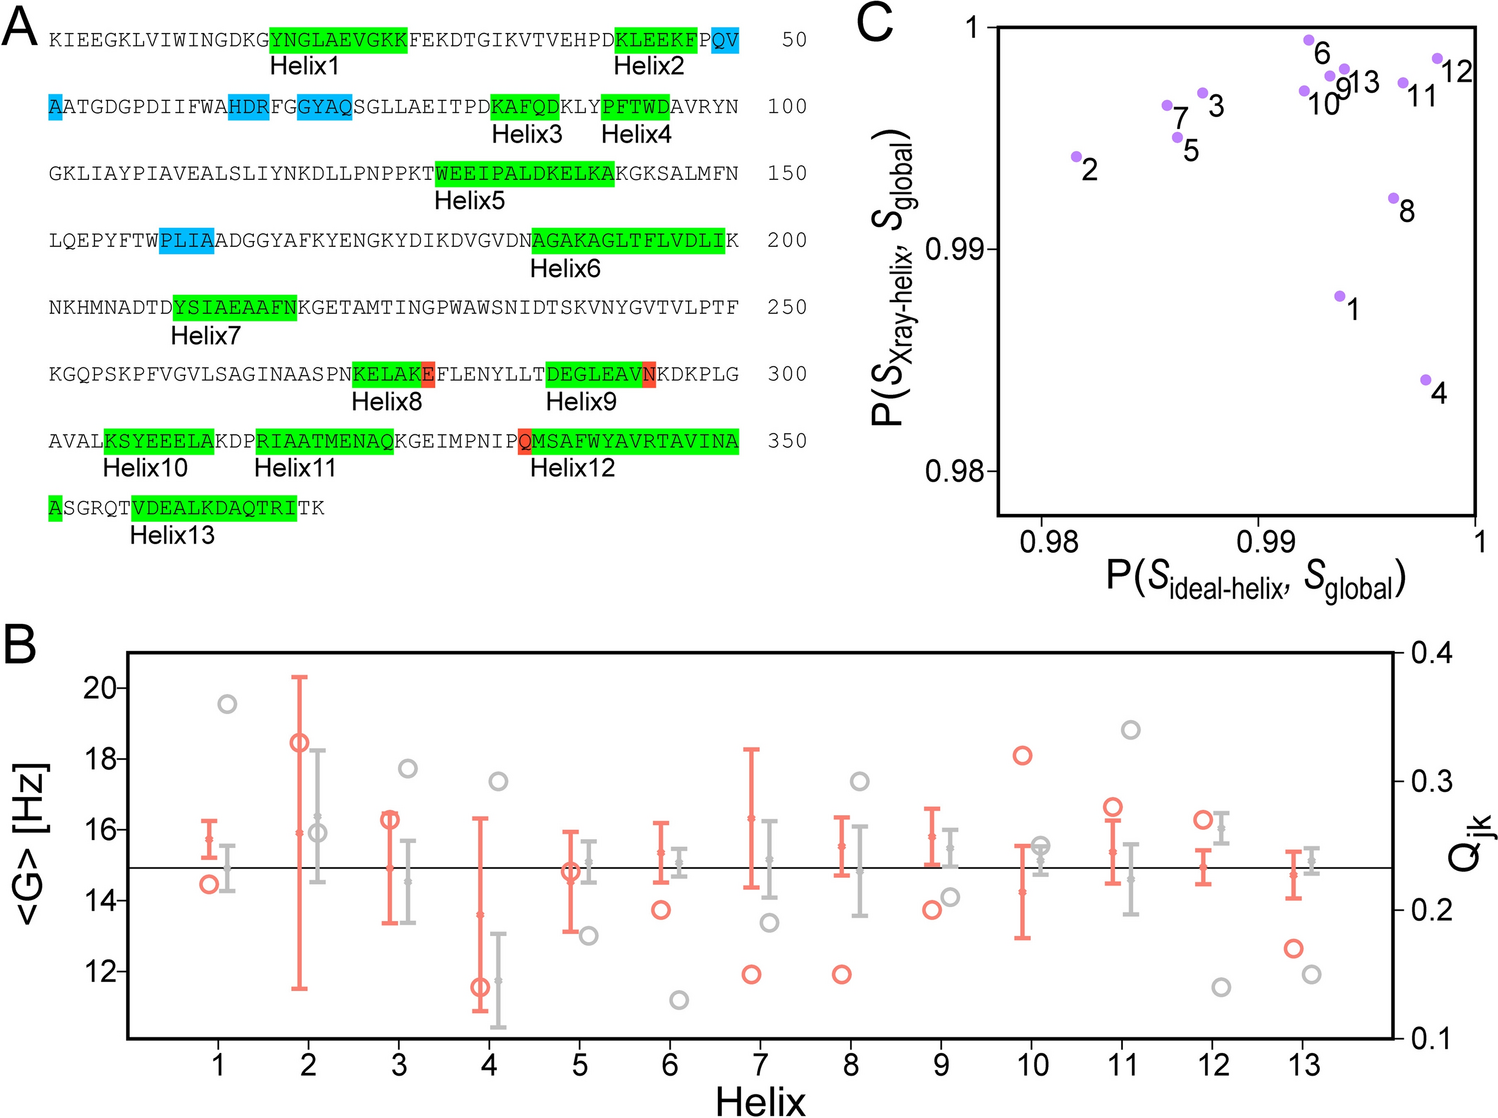
Fig. 3
Relaxation parameters for barnase. Solid: barnase alone. Open: with 1 M betaine
Fig. 4
Amide proton exchange rates of slowly exchanging amides in the presence and absence of 1 M betaine. The values are given as log10(rate in hr− 1). The double log plot is used to emphasise that the slowing down of amide exchange in the presence of betaine is similar over a wide range of exchange rates, using a dashed line with gradient = 1 merely to guide the eye
Table 1 Amide exchange rates in Barnase (30 °C, pH 6.7). The residues listed are those for which confident rates were measured in both conditionsFlap endonuclease plus betaineFlap endonuclease (FEN) is approximately 650 residues long, with the endonuclease domain (studied here) containing 350 residues. It removes the single-stranded 5’ overhang on a DNA duplex, for which it has an active site containing divalent metal ions, as well as an arch formed from two helices, through which the single-stranded DNA strand passes (AlMalki et al. 2016). This arch is disordered in the absence of substrate and becomes ordered when the enzyme is bound to single stranded DNA (Balakrishnan and Bambara 2013). The protein used here is from the protozoan parasite Plasmodium falciparum.
On addition of betaine to FEN, 17 backbone amide signals (out of a total of 299 assigned signals) showed increases in intensity. These signals are found all over the protein, including several from in and around the arch (Fig. 5a). Order parameters were estimated using TALOS (Shen and Bax 2013) based on backbone chemical shifts (Berjanskii and Wishart 2008), showing that many of the enhanced signals come from regions with low order parameters (Fig. 5b). As for barnase, STD experiments showed that there is no discernible binding of betaine to FEN.
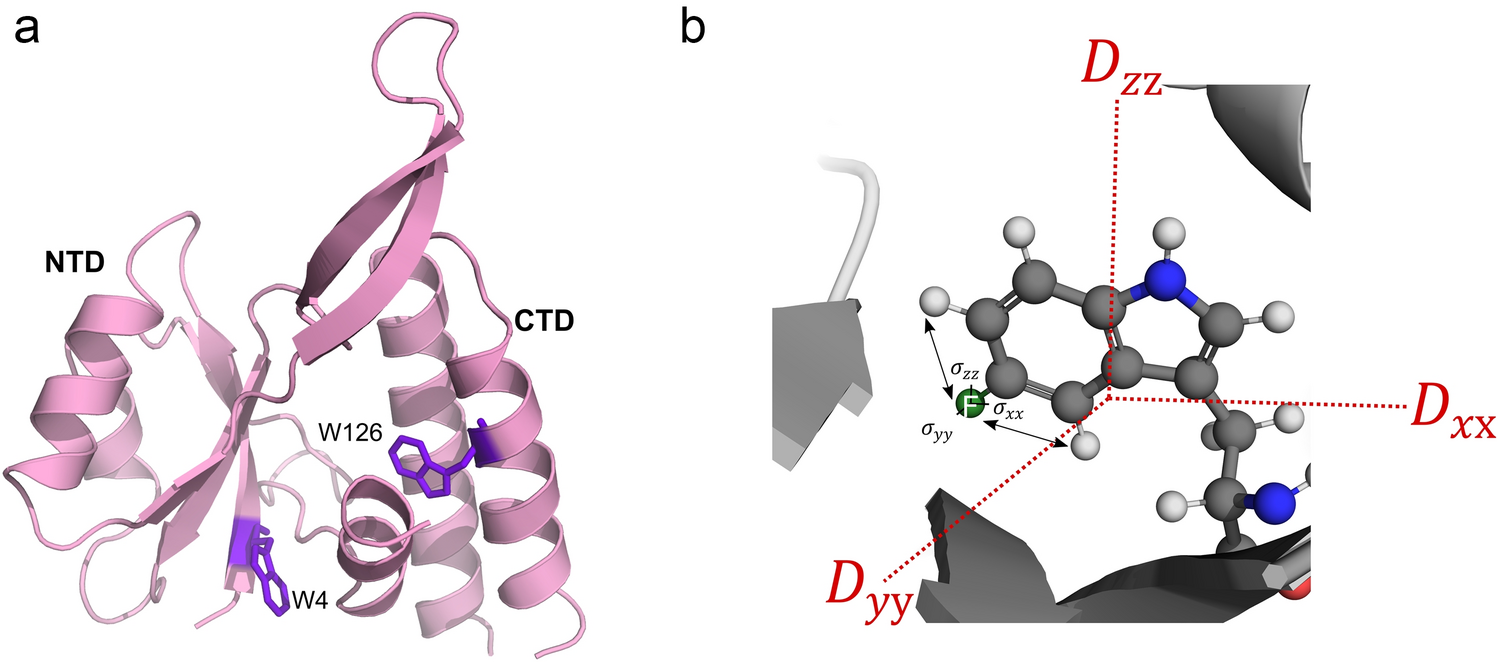
Fig. 5
Flap endonuclease, indicating residues having increases in intensity. (a) Structure of FEN (AlphaFold2 prediction for Plasmodium falciparum FEN), including position of the DNA substrate, coloured from blue at the N terminus to red at the C terminus. Residues with intensity increases are highlighted in magenta. (b) Order parameter values estimated for FEN based on backbone chemical shifts and predicted by TALOS-N. Residues with intensity increases are highlighted in red. The arch is residues 40–60, and the region 90–120 with low order parameters is in contact with the DNA substrate
Comments (0)