
Remember me
COLMARvista can read processed frequency-domain data in several different file formats, including NMRPipe (Delaglio et al. 1995) (with its file extension ft2), UCSF Sparky (Lee et al. 2015; Goddard and Kneller 2008) (file extension ucsf), and Topspin txt files (generated in Topspin using the "totxt" command). One of the major advantages of COLMARvista is its WebGL-based contour plot visualization. For a typical 2D HSQC spectrum the initial calculation of contours from spectral data may take from several seconds, such as a HSQC, to up to a minute. For more complex spectra with a large number of cross-peaks, such as a TOCSY or NOESY spectrum. However, common subsequent operations, such as zooming and panning, are instantaneous even when working with multiple overlaid contour plots owing to the high computational efficiency of modern GPU’s. In addition to the main 2D plot, COLMARvista provides two 1D spectral windows, which can display either projections or selected 1D cross-sections based on user preference. The 2D plot supports intuitive zooming using a brush tool, allowing users to select specific regions for more detailed inspection. Meanwhile, the 1D plots feature zooming via the mouse wheel (or equivalent) and panning through mouse dragging. Both 1D plots are fully synchronized with the main 2D plot, i.e. zooming or panning in one plot automatically updates the others, thereby maintaining consistent views across all windows. More detailed information is available in the software manual.
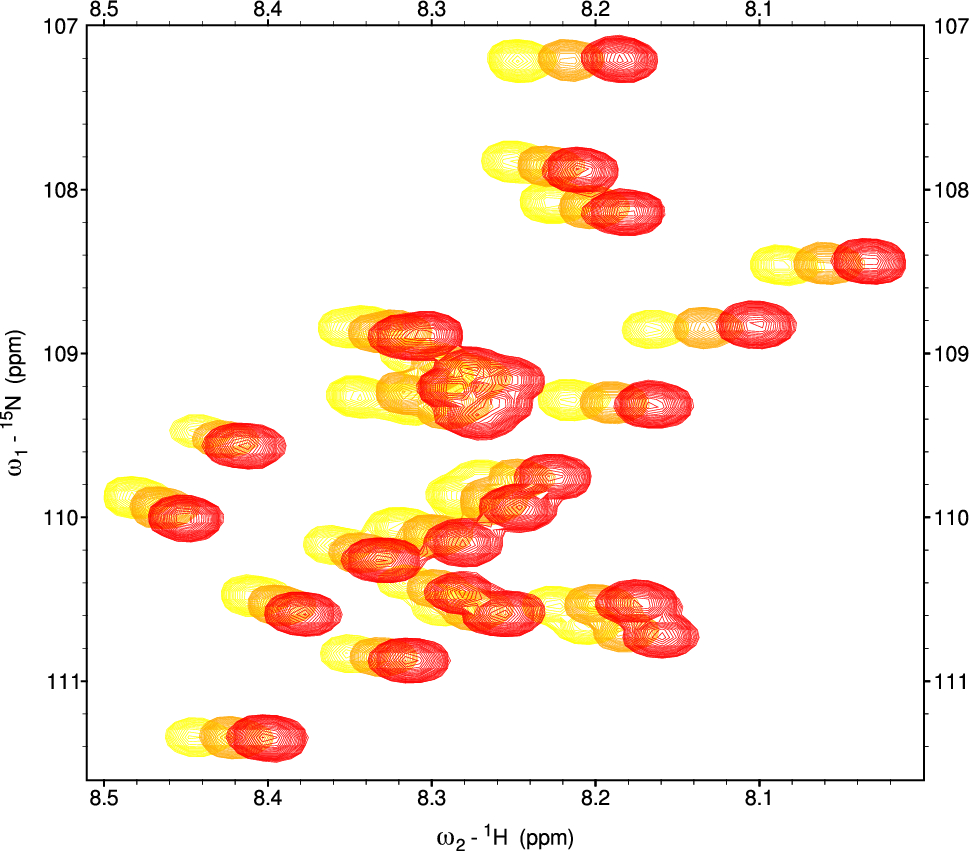
Users can overlay an essentially unlimited number of spectra in COLMARvista, each with its own chemical shift reference. This high level of versatility allows for comprehensive comparative analysis across many spectral datasets as is often required in practice. Users can also rearrange the order of overlaid spectra by simply dragging and dropping them, ensuring that the most relevant spectrum is displayed prominently in the foreground. Additionally, the color of each contour plot can be fully customized according to the user’s preferences, making it easy to visually distinguish the different spectra. To further enhance the visualization experience, COLMARvista includes options for adjusting contour levels. The software also supports the export of images for blogs and presentations. Figure 1 shows an example of two superimposed solution NMR protein 1H-15N HSQC spectra, highlighting chemical shift perturbations. Additionally, COLMARvista supports the display of peak labels, such as assignments, next to each peak. The label positions are automatically arranged for optimal visualization and minimal mutual overlap and, if desired, allowing easy manual adjustment as illustrated in Fig. 2.
Fig. 1
Visualization of the superposition of a selected region of two 2D 1H-15N HSQC spectra of two different samples of K-Ras (in black and gold) by COLMARvista, highlighting chemical shift perturbations (measured at 850 MHz proton frequency)
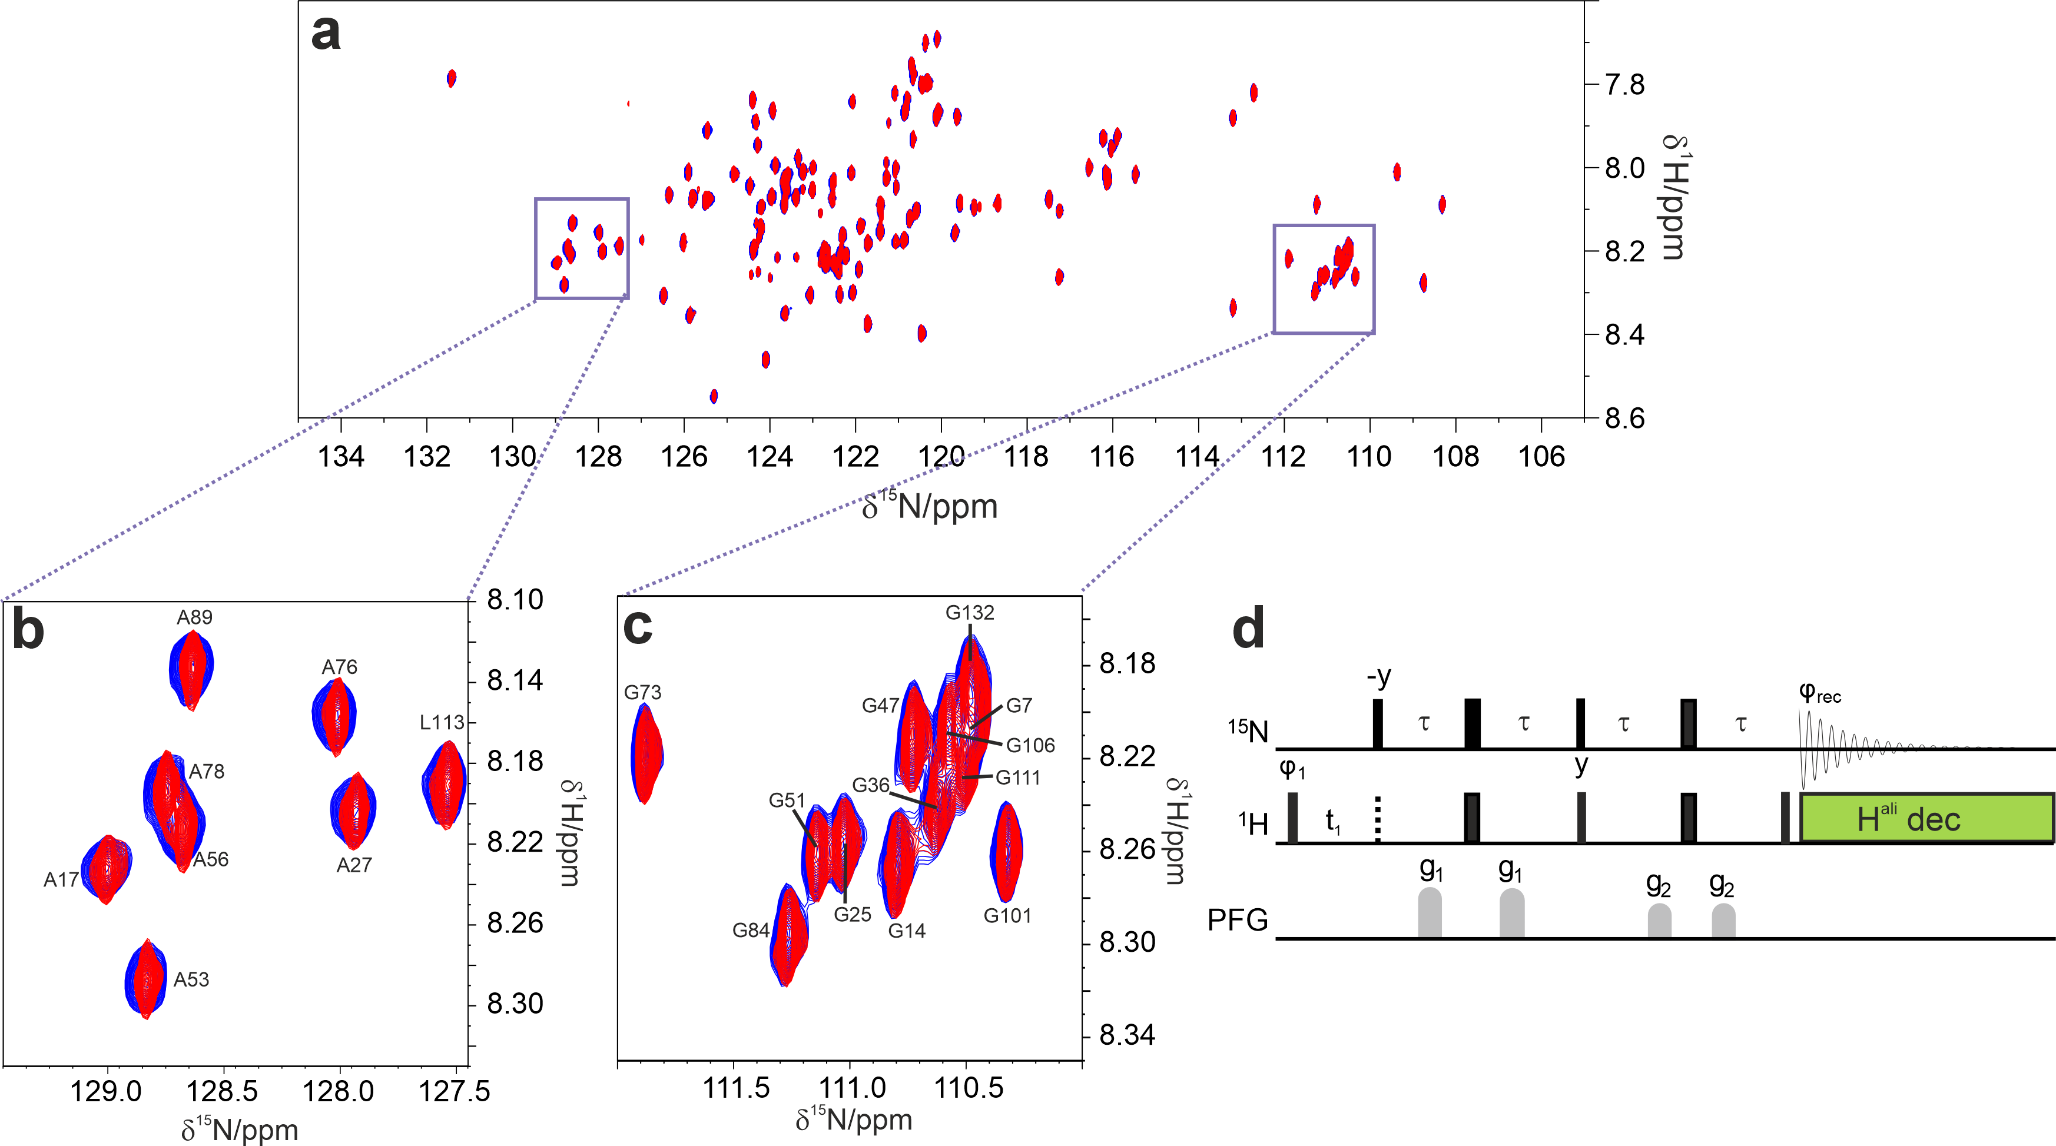
Fig. 2
A 2D 1H-15N HSQC spectrum of colicin E7 immunity protein Im7 with selected peaks and their assignments (indicated by red labels). 1D cross-sections along the green lines in the 2D spectrum are displayed on the left and top of the contour plot
In addition to visualization, COLMARvista offers essential tools for the processing of 2D or pseudo-3D time-domain data in Bruker format (version 3.0 or later required). Once users upload the time-domain data (i.e. free induction decays (FIDs)), COLMARvista reads the data and performs a series of predefined processing steps. These include Fast Fourier Transformation (FFT), apodization using user-specified window functions, zero-filling according to user-defined number of folds, and automatic phase correction. If users are not satisfied with the automatic phase correction, COLMARvista provides easy-to-use tools for additional manual phase adjustments to ensure optimal results. For experiments with substantial water signals, COLMARvista also includes automated water solvent suppression by removing the zero-frequency signal from the FID prior to FFT. The overall workflow design, including the syntax of window functions, closely mirrors that of the NMRPipe software, making it intuitive for users familiar with existing NMR data processing software. A screenshot of COLMARvista’s processing interface is shown in Fig. 3 with the fields users can fill in, if the default values need to be changed. Figure 4 depicts the same selected region of a 2D 1H-15N HSQC protein spectrum (a) with automatic phase correction and (b) without phase correction along the direct dimension. Furthermore, 1D cross-sections along both dimensions are shown in the figures.
Fig. 3
Screenshot of the COLMARvista web application. COLMARvista accepts both pre-processed 2D NMR spectral files in the frequency domain or, alternatively, it can directly process Bruker time-domain data (Topspin 3.0 and later versions). Its processing options, such as apodization, zero-filling, phase correction and extraction, closely mirror those available in NMRPipe and include an automatic phase correction tool
Fig. 4
Selected region of a protein 2D 1H-15N HSQC spectrum of K-Ras a with autonomous 0th and 1st order phase correction and b without phase correction along the direct 1H dimension (phase correction along the indirect 15N dimension was applied in both spectra using the phase information defined by the pulse sequence). The cross-section along the direct dimension in (b) displays clear phase errors, whereas (a) is free from phase errors
In addition to directly processing Bruker-format time-domain data, COLMARvista can also serve as a spectrum visualization and manual phase correction tool as an alternative to NMRDraw to extract phasing information for spectral processing with NMRPipe. Specifically, users can first process time-domain data in NMRPipe, save the frequency-domain spectrum with the imaginary components retained, and then load it into COLMARvista. The phase correction values obtained with COLMARvista, either fully automated or manually, can then be seamlessly integrated into the NMRPipe processing script, following a workflow analogous to that of NMRPipe/NMRDraw.
COLMARvista also allows processing of non-uniformly sampled (NUS) 2D experiments using the SMILE algorithm (Ying et al. 2017). To process NUS data, users simply upload a "nuslists" file alongside the corresponding spectral data files, which automatically designates it as an NUS dataset in COLMARvista. For NUS experiments, users must provide phase correction parameters along the indirect dimension, which are known in most cases directly from the pulse sequence used (see also Fig. 4). COLMARvista will then automatically handle the processing along the direct dimension, including phase correction. Next, the time-domain is fully, i.e. uniformly, reconstructed along the indirect dimension using the SMILE algorithm, which is followed by standard processing along the indirect dimension. As with uniformly sampled experiments, users can then customize within COLMARvista phase correction parameters, apply user-defined window functions, and specify the amount of zero-filling to be used.
Furthermore, COLMARvista serves as a convenient graphical user interface (GUI) for our DEEP Picker (Li et al. 2021) and Voigt Fitter programs (Li et al. 2022), which deconvolute 2D NMR spectra into individual peaks with high accuracy, even for spectra with strong peak overlaps. The spectral deconvolution step plays a critical role for most NMR analysis, as its quality directly impacts all downstream analysis. While DEEP Picker and Voigt Fitter are increasingly used in the field, their current command-line-only interface has a learning curve, particularly for users accustomed to GUI-based applications. COLMARvista bridges this gap by offering a user-friendly interface: by the click of a button users can run DEEP Picker on the displayed spectrum, with the identified peaks automatically overlaid on the spectrum. Users also have the flexibility to manually refine the peak list, by interactively adding, moving, or deleting peaks as needed, before proceeding to the final peak fitting step by Voigt Fitter. By selecting a few parameters, such as the fitted line shape type, users can complete this task with minimal effort. Once peak fitting is complete, COLMARvista generates an updated peak list and displays the synthetically reconstructed spectrum based on the peak list and overlays it on the experimental spectrum, which allows the direct visual assessment of the deconvolution quality. All results can be downloaded for subsequent use and documentation. Alternatively, users can upload their own peak list in either NMRPipe or Sparky format for visualization and further refinement by Voigt Fitter. Figure 5 shows a selected region of a 2D 1H-13C HSQC spectrum of a biofilm metabolomics sample of Pseudomonas aeruginosa (blue) along with the reconstructed spectrum (magenta) obtained from peak deconvolution using the built-in DEEP Picker and Voigt Fitter programs. The fitted spectrum was uniformly shifted for better visualization.
Fig. 5
A selected region of a 2D 1H-13C HSQC spectrum of a biofilm metabolomics sample of P. aeruginosa (blue) together with the reconstructed spectrum (magenta) from peak deconvolution using the DEEP Picker and Voigt Fitter programs built in COLMARvista. The reconstructed spectrum was shifted by a uniform frequency offset along the indirect 13C dimension for better visualization
COLMARvista provides an intuitive platform also for the quantitative analysis of pseudo-3D experiments. In a typical workflow, users can upload FID data and use COLMARvista’s automatic processing tool with the “Process first plane only” option selected (default). The resulting spectrum can then be visually inspected, and adjustments can be made, such as phase correction, window function, and amount of zero filling. Once satisfied, users simply uncheck the “process first plane only” option and reprocess the FID. COLMARvista will then process all planes sequentially, by applying the same optimized processing parameters, and display the contour plots of all planes overlaid for easy comparison. Next, users can run DEEP Picker and Voigt Fitter typically, but not necessarily, on the first plane to generate a deconvoluted peak list. This peak list can then serve as the starting point for the pseudo-3D peak fitting step. In this mode, Voigt Fitter ensures consistent peak positions and line shapes across all planes, allowing only peak heights to vary for each fitted peak between planes. The downloadable results are formatted similarly to those of NMRPipe, with columns labeled Z_A0, Z_A1, Z_A2, etc., to represent the relative peak heights across all planes. The relative peak heights can be directly used in downstream analysis tools to calculate parameters, such as R1 and R2 relaxation rates, or to plot profiles of CEST experiments, depending on the type of pseudo-3D data. This is illustrated in Fig. 6, where a zoomed region of a pseudo-3D protein spectrum with the superposition of four spectral planes distinguished by color (blue, black, cyan, and green) is shown after being shifted for visualization purposes.
Fig. 6
A zoomed-in region of a pseudo-3D 15N-R1 protein spectrum of K-Ras with four planes superimposed (blue, black, cyan, and green) corresponding to increasing relaxation delays and shifted for better visualization by COLMARvista. The contours are displayed on a linear scale to visualize relative peak volumes
As a bonus, COLMARvista can display NMR spectra also in a perspective 3D mode, either as a continuous surface (with highlighted contour lines) or as a terrace model. The 3D mode supports intuitive panning, zooming, and rotation operations using the mouse, along with optimized lighting effects. This 3D plot provides a comprehensive overview of the entire spectrum, including potential artifacts, and highlights relative peak heights in a way that aligns with human intuition. In Fig. 7a 3D surface plot of the 1H-15N HSQC spectrum of the IDP protein ɑ-synuclein is depicted. COLMARvista includes detailed instructions for all its functionalities and programming considerations, which are accessible directly within the software.
Fig. 7
Selected region of the 3D surface plot of the 1H-15N HSQC spectrum of the IDP protein ɑ-synuclein generated by COLMARvista
Comments (0)